Peter Suhm recently wrote about how his form builder Reform uses Reform for their own business.
In the same spirit, this post takes a look at how we use DebugBear to monitor site speed internally.
Tracking site speed over time
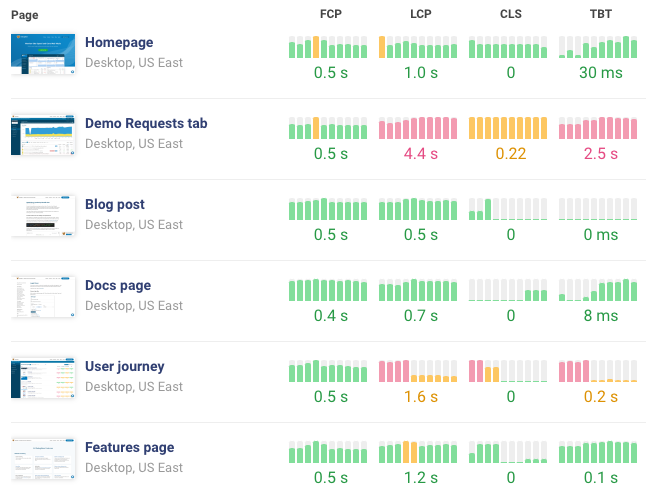
We use the DebugBear dashboard to stay on top of longer-term site performance trends, and to check how the performance optimizations we've deployed are working.
We also use it to sort our monitored pages by worst performance, to find out which URL we need to optimize.
Getting alerted to regressions and investigating them
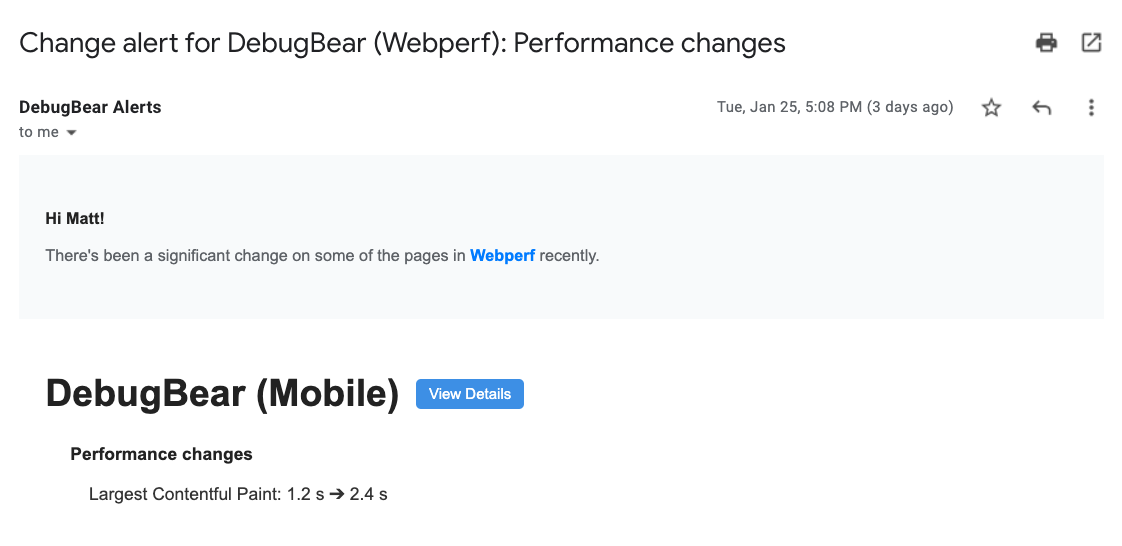
When our performance metrics go down, DebugBear sends us an alert via email. For example, we recently saw a big jump in our Largest Contentful Paint (LCP) metric on the mobile homepage.
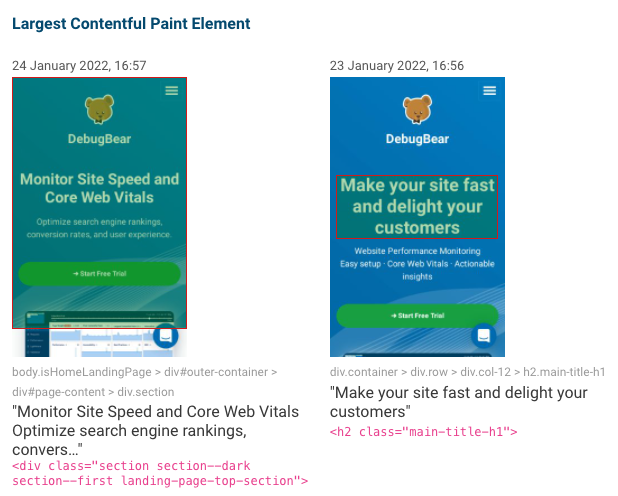
When investigating the regression, it turned out that in this case our website didn't actually get any slower.
We had changed the title on the homepage to be a bit shorter, and it turned out that having a smaller H1 element meant that Chrome now detects a different element as the LCP element.
Testing performance in CI
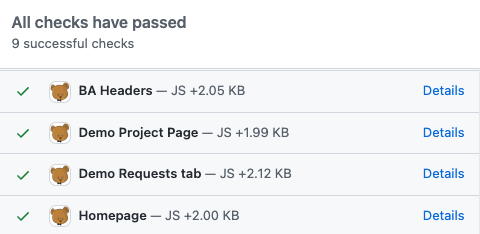
Ideally, we want to avoid rolling out performance regressions to production. So we've set up DebugBear to run as part of our Continuous Integration process.
Every time we push code to GitHub, DebugBear tests 4 of our pages and reports how the code changes impact performance.
Looking back at how DebugBear changed over time
This is not a performance feature, but DebugBear takes screenshots as part of running the performance tests, and sometimes it's useful to review how the site changed over time.
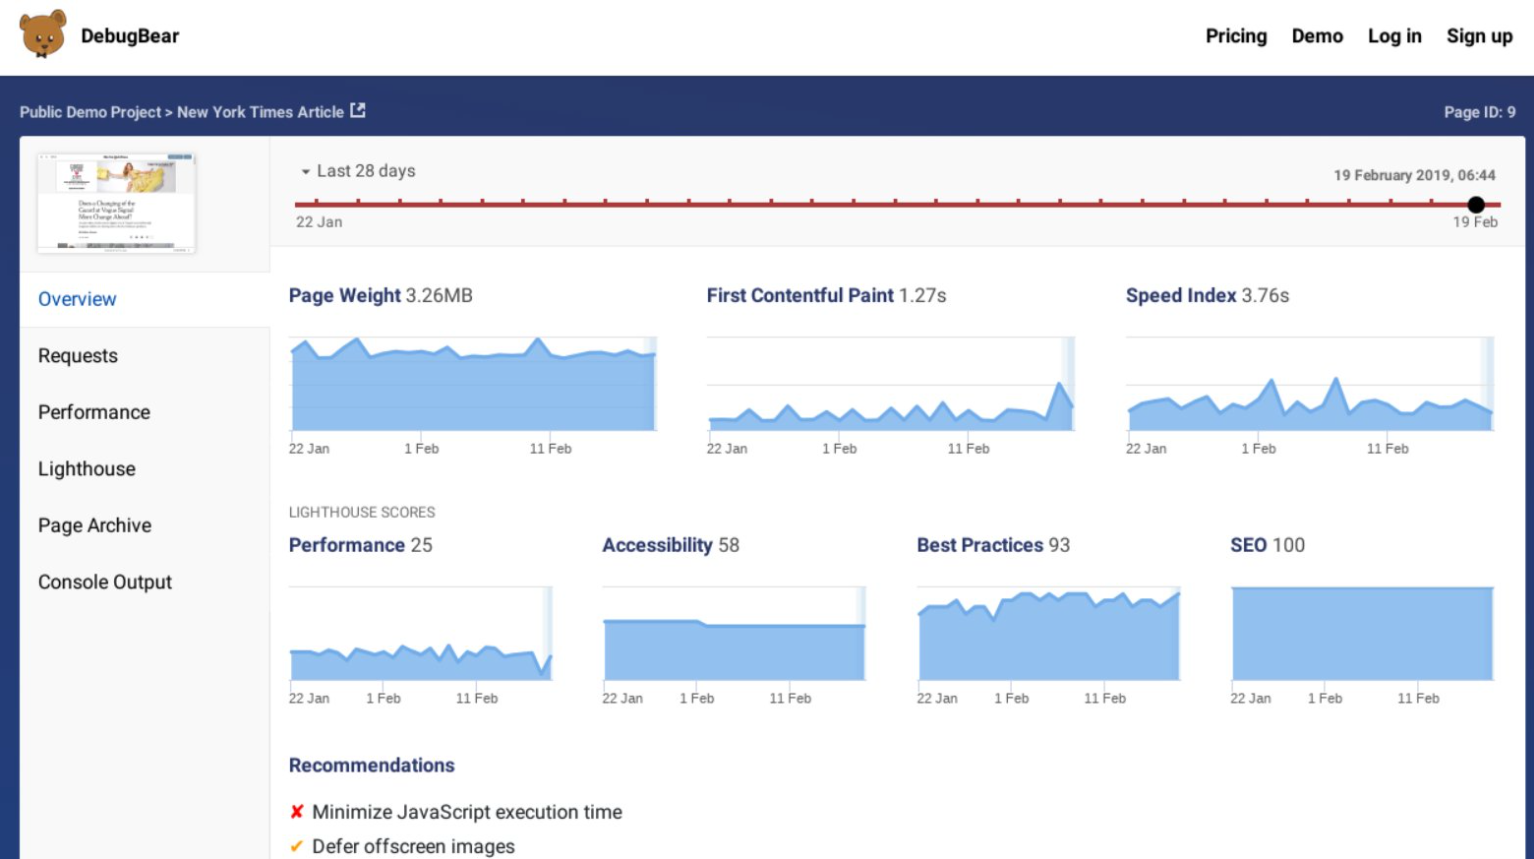
For example, we can see how our homepage messaging has changed, or look back to the day the first customer signed up. This is what DebugBear looked like then:
Compared to now.
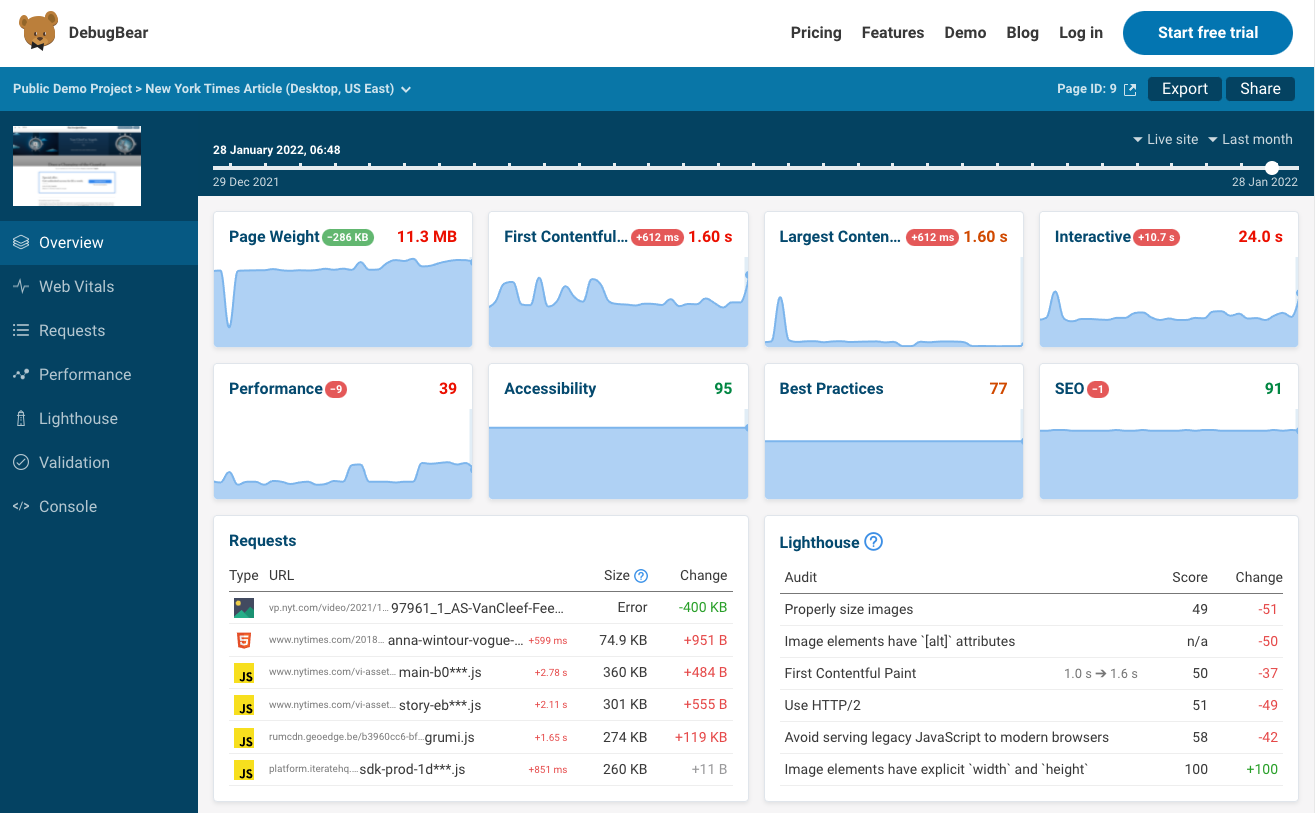
We started working with a designer again recently, so there should be some further improvements soon.