DebugBear tracks how your metrics in Google's
Chrome User Experience Report (CrUX) change over time.
Real-user and lab-based testing
Run scheduled page speed tests and collect real world analytics on your website.
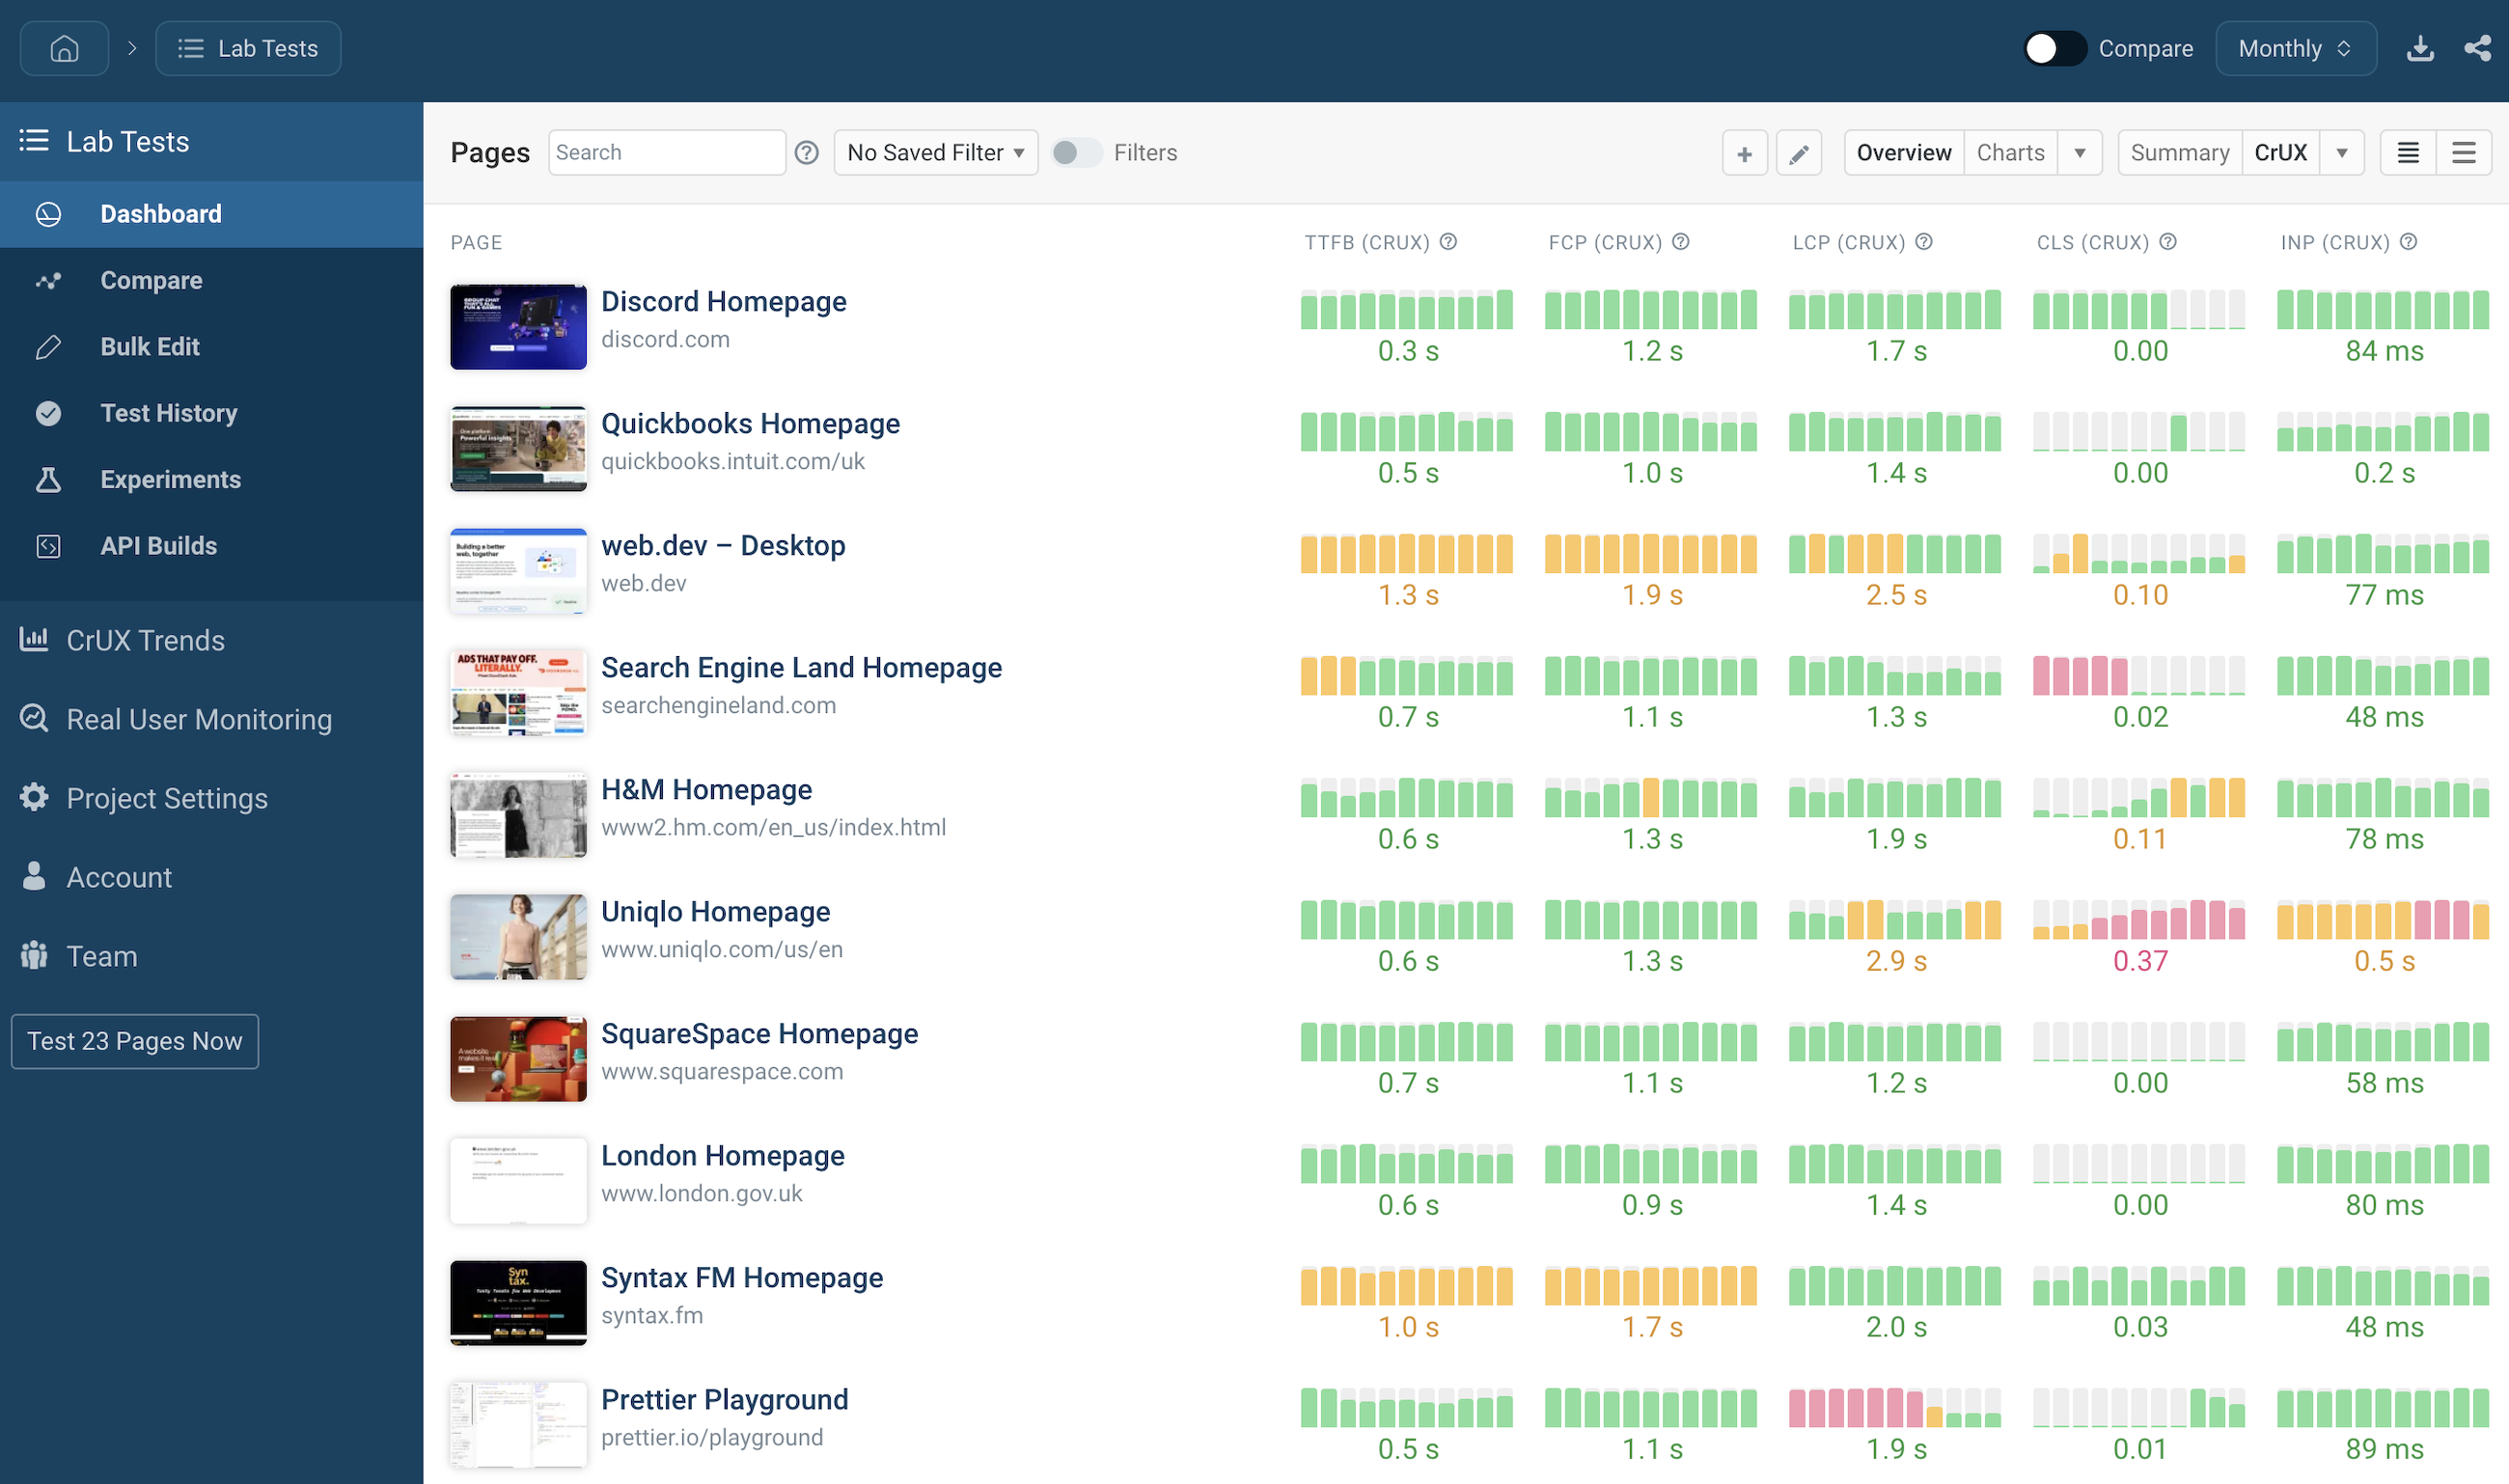
Identify slow pages through the dashboard
View long-term performance trends and sort pages
to identify those with the most potential for optimization.
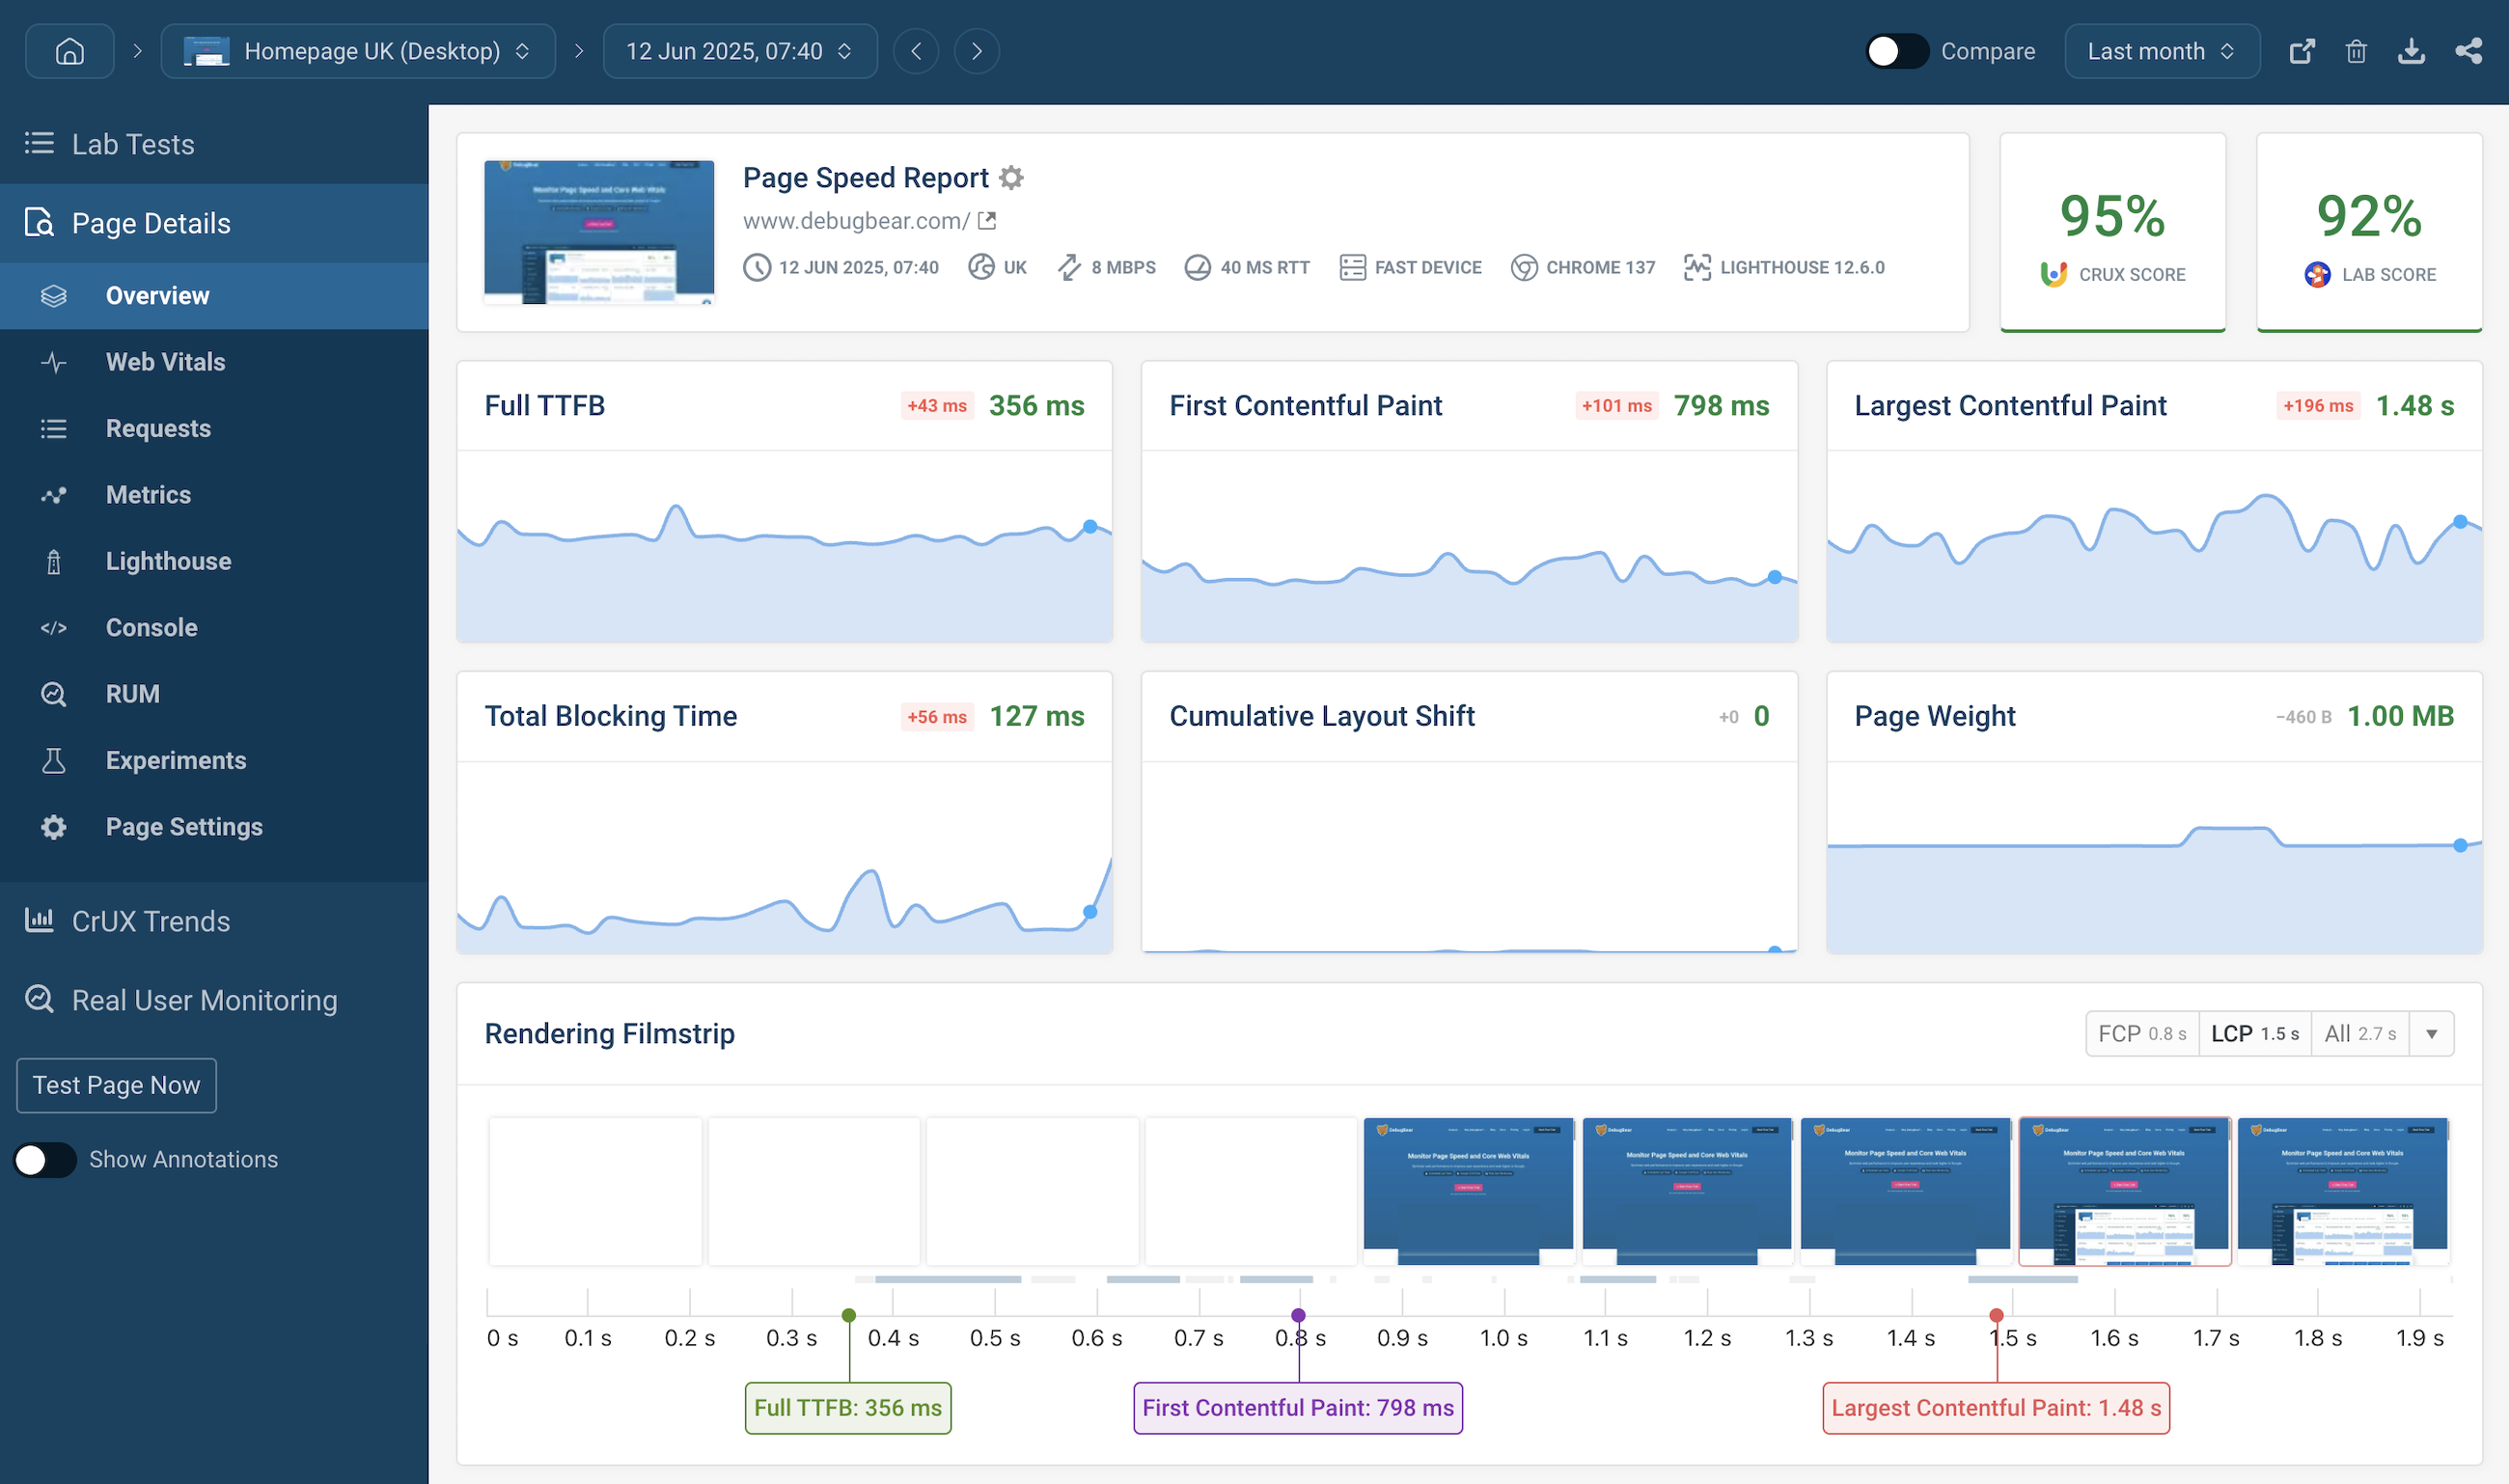
Lighthouse lab reports
Complement field data with lab data
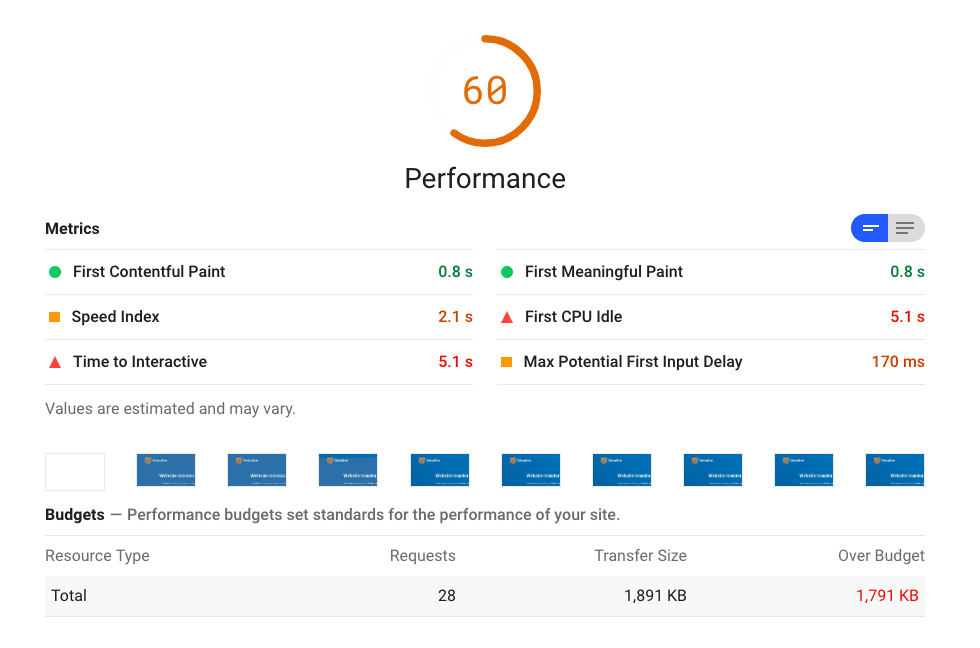
Tests your website with Google Lighthouse every day, so
you don't have to wait 28 days for the field data to update.
Like PageSpeed Insights, but more accurate
PSI uses a network simulation to quickly serve up data.
This is less accurate than testing in a real throttled environment, making
it harder to use lab data to explain what you see in the field.
DebugBear provides data you can rely on.
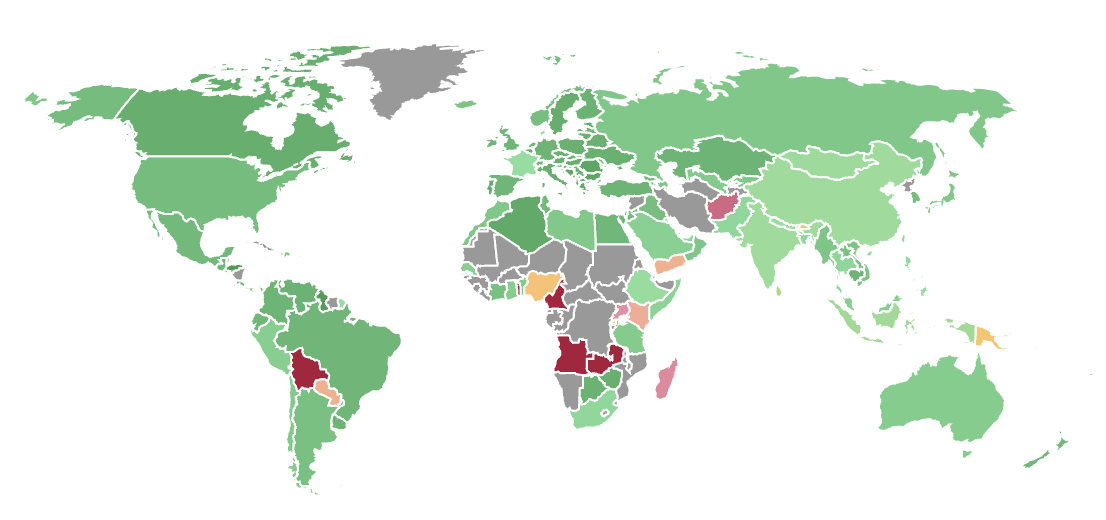
Run tests from 20+ global locations
Pick test locations that match where your users are.
See how you do compared to your competition
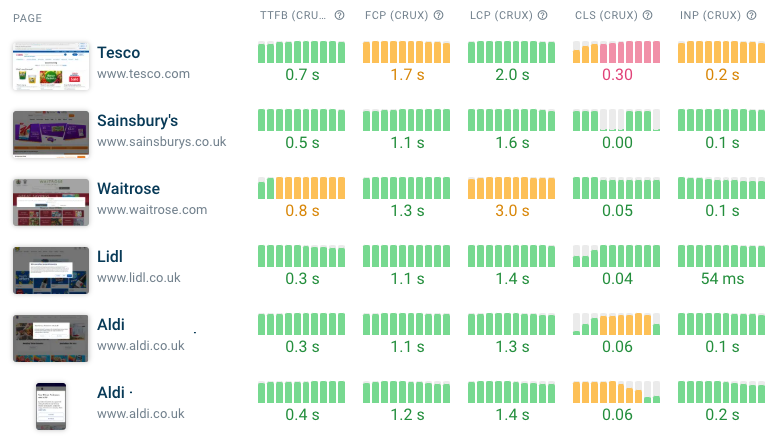
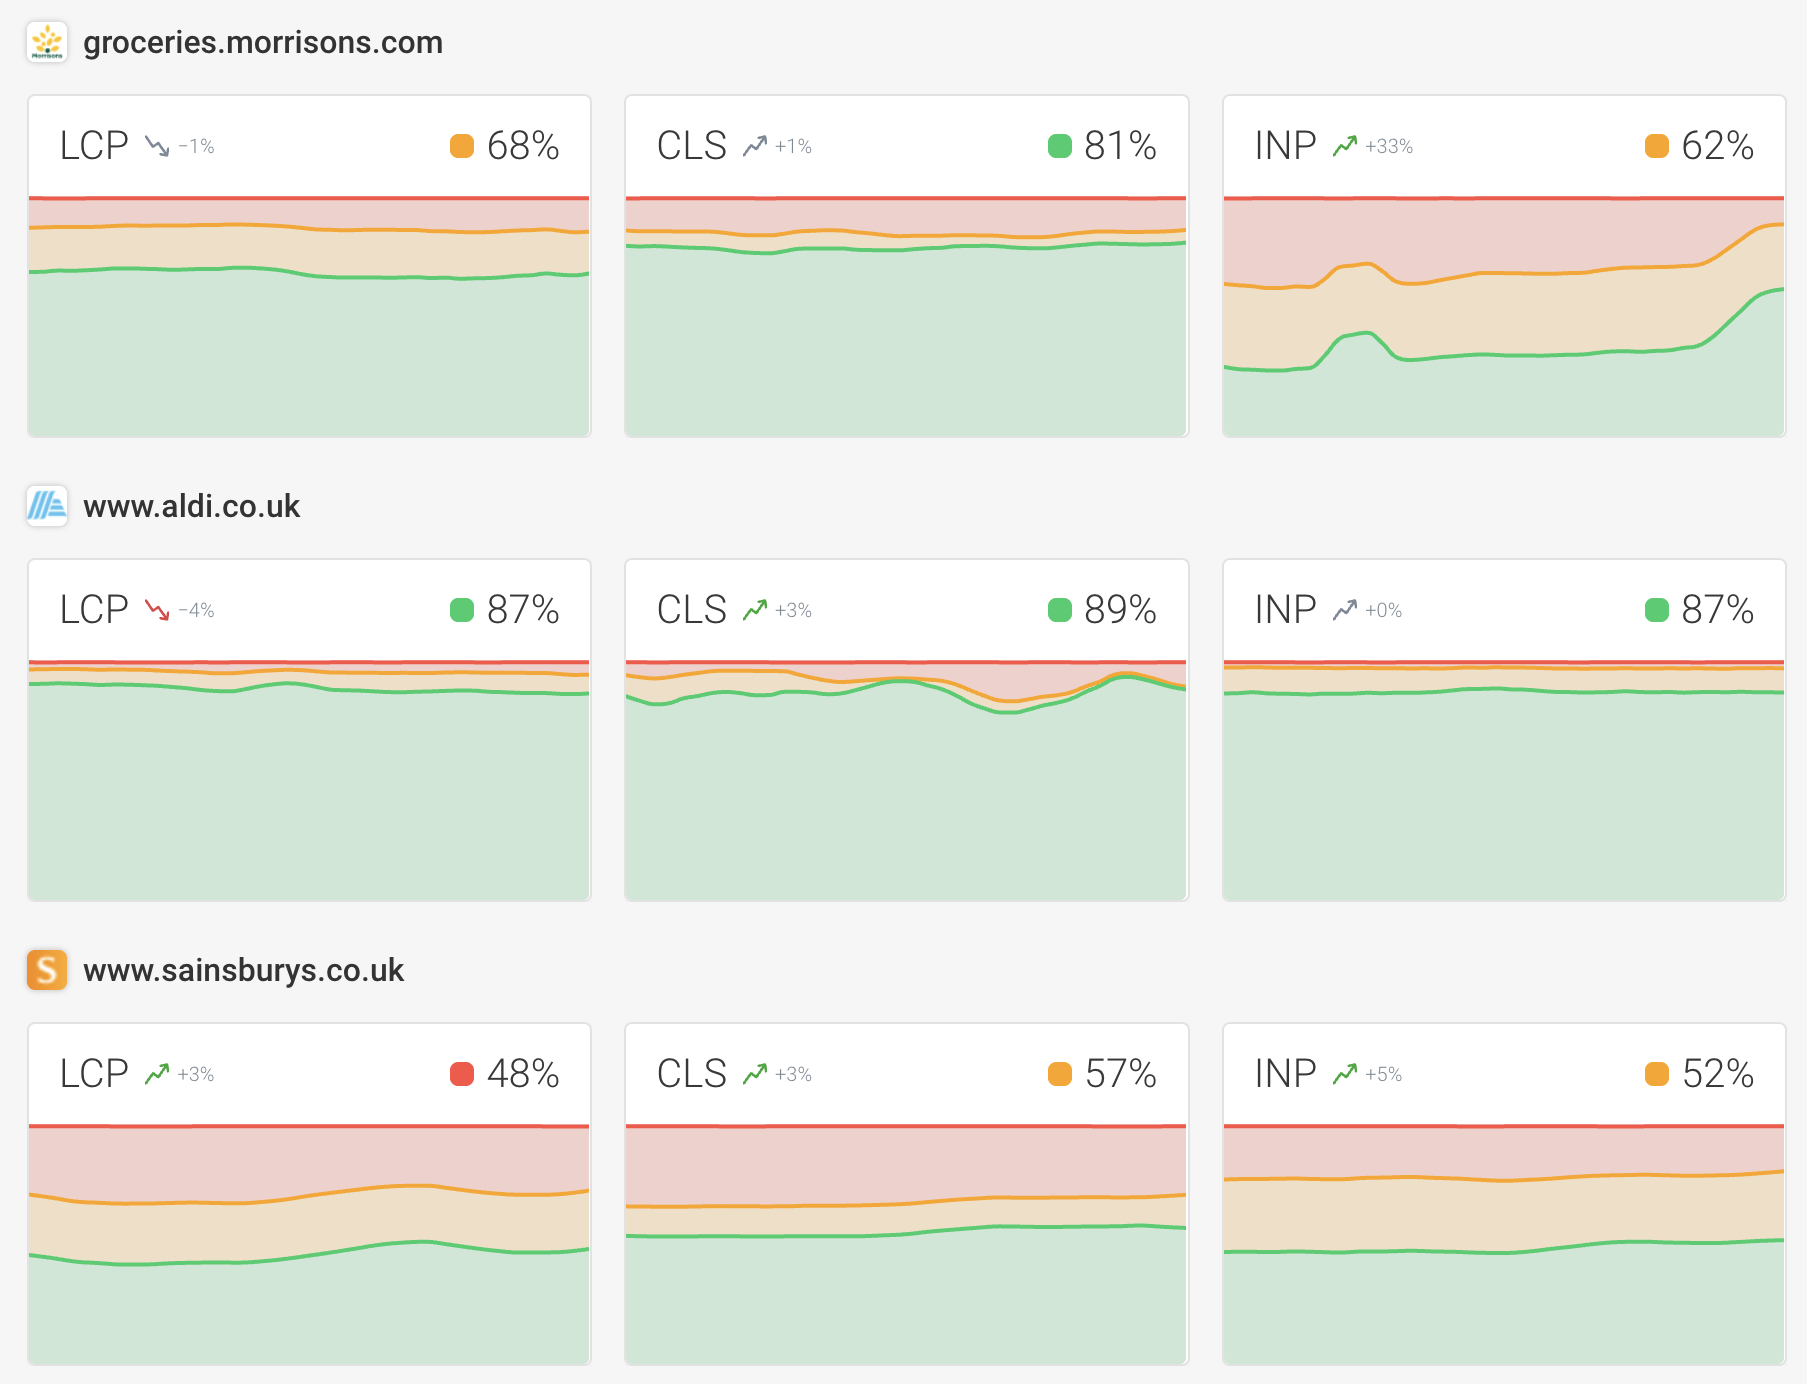
Benchmark your website with CrUX Trends
DebugBear's CrUX Trends dashboard shows you how fast your website is compared to your competitors,
and how it's changed over time.
Have the best technical SEO
See how you can optimize your website to be the best in the industry.
Google's Core Web Vitals are a search result ranking factor.
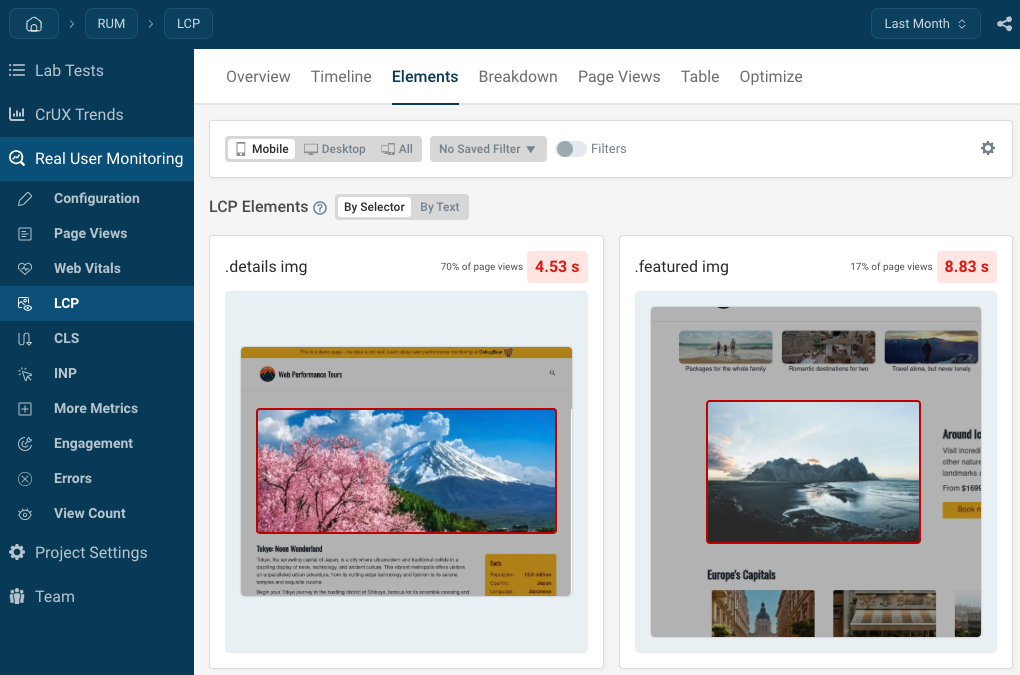
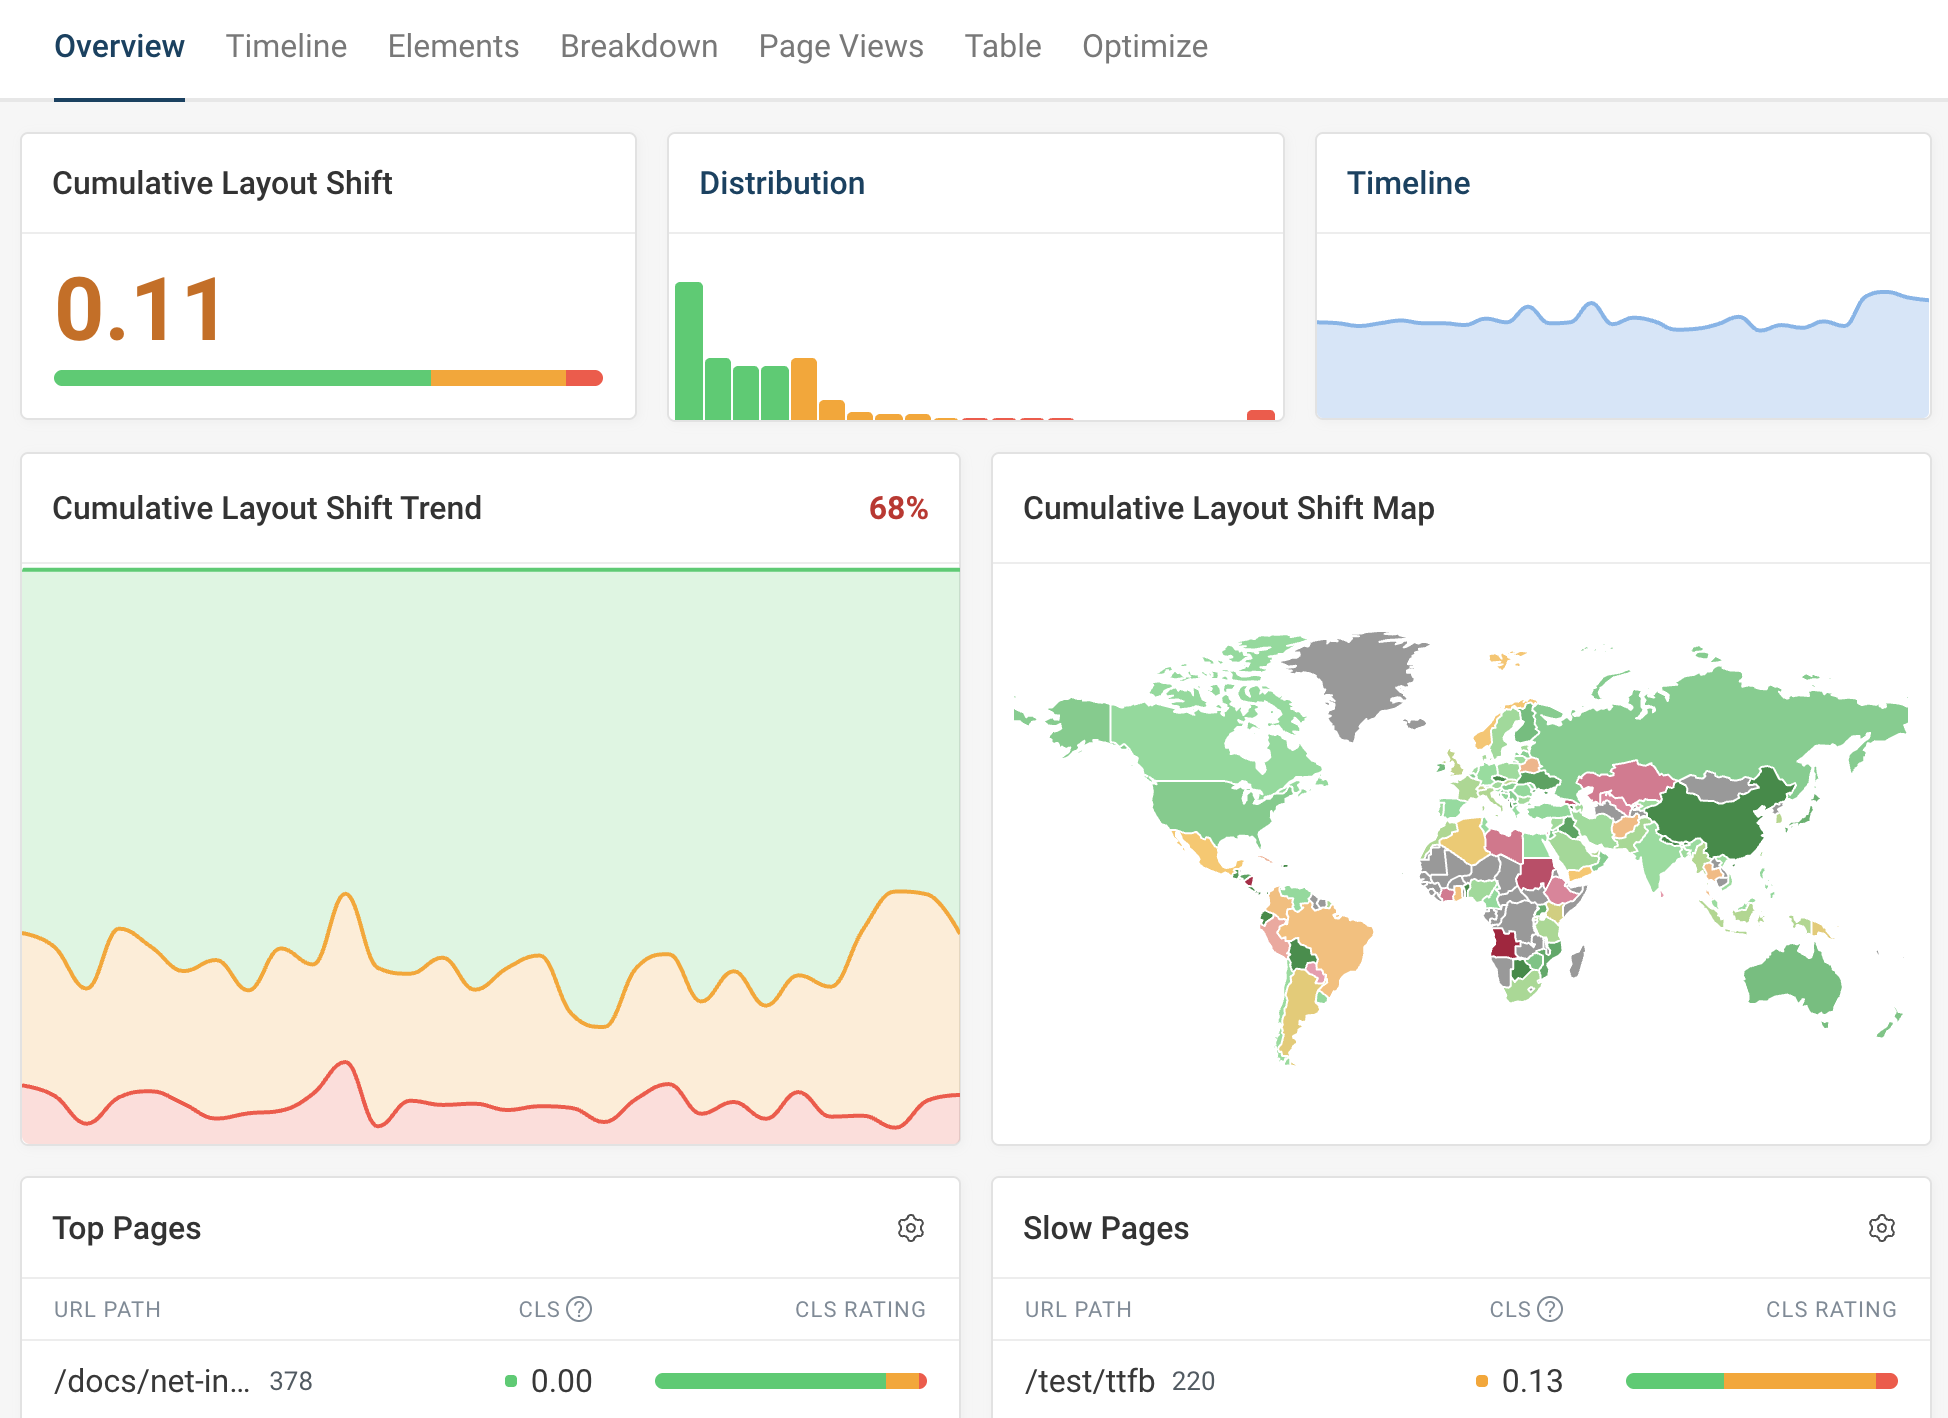
Real user monitoring
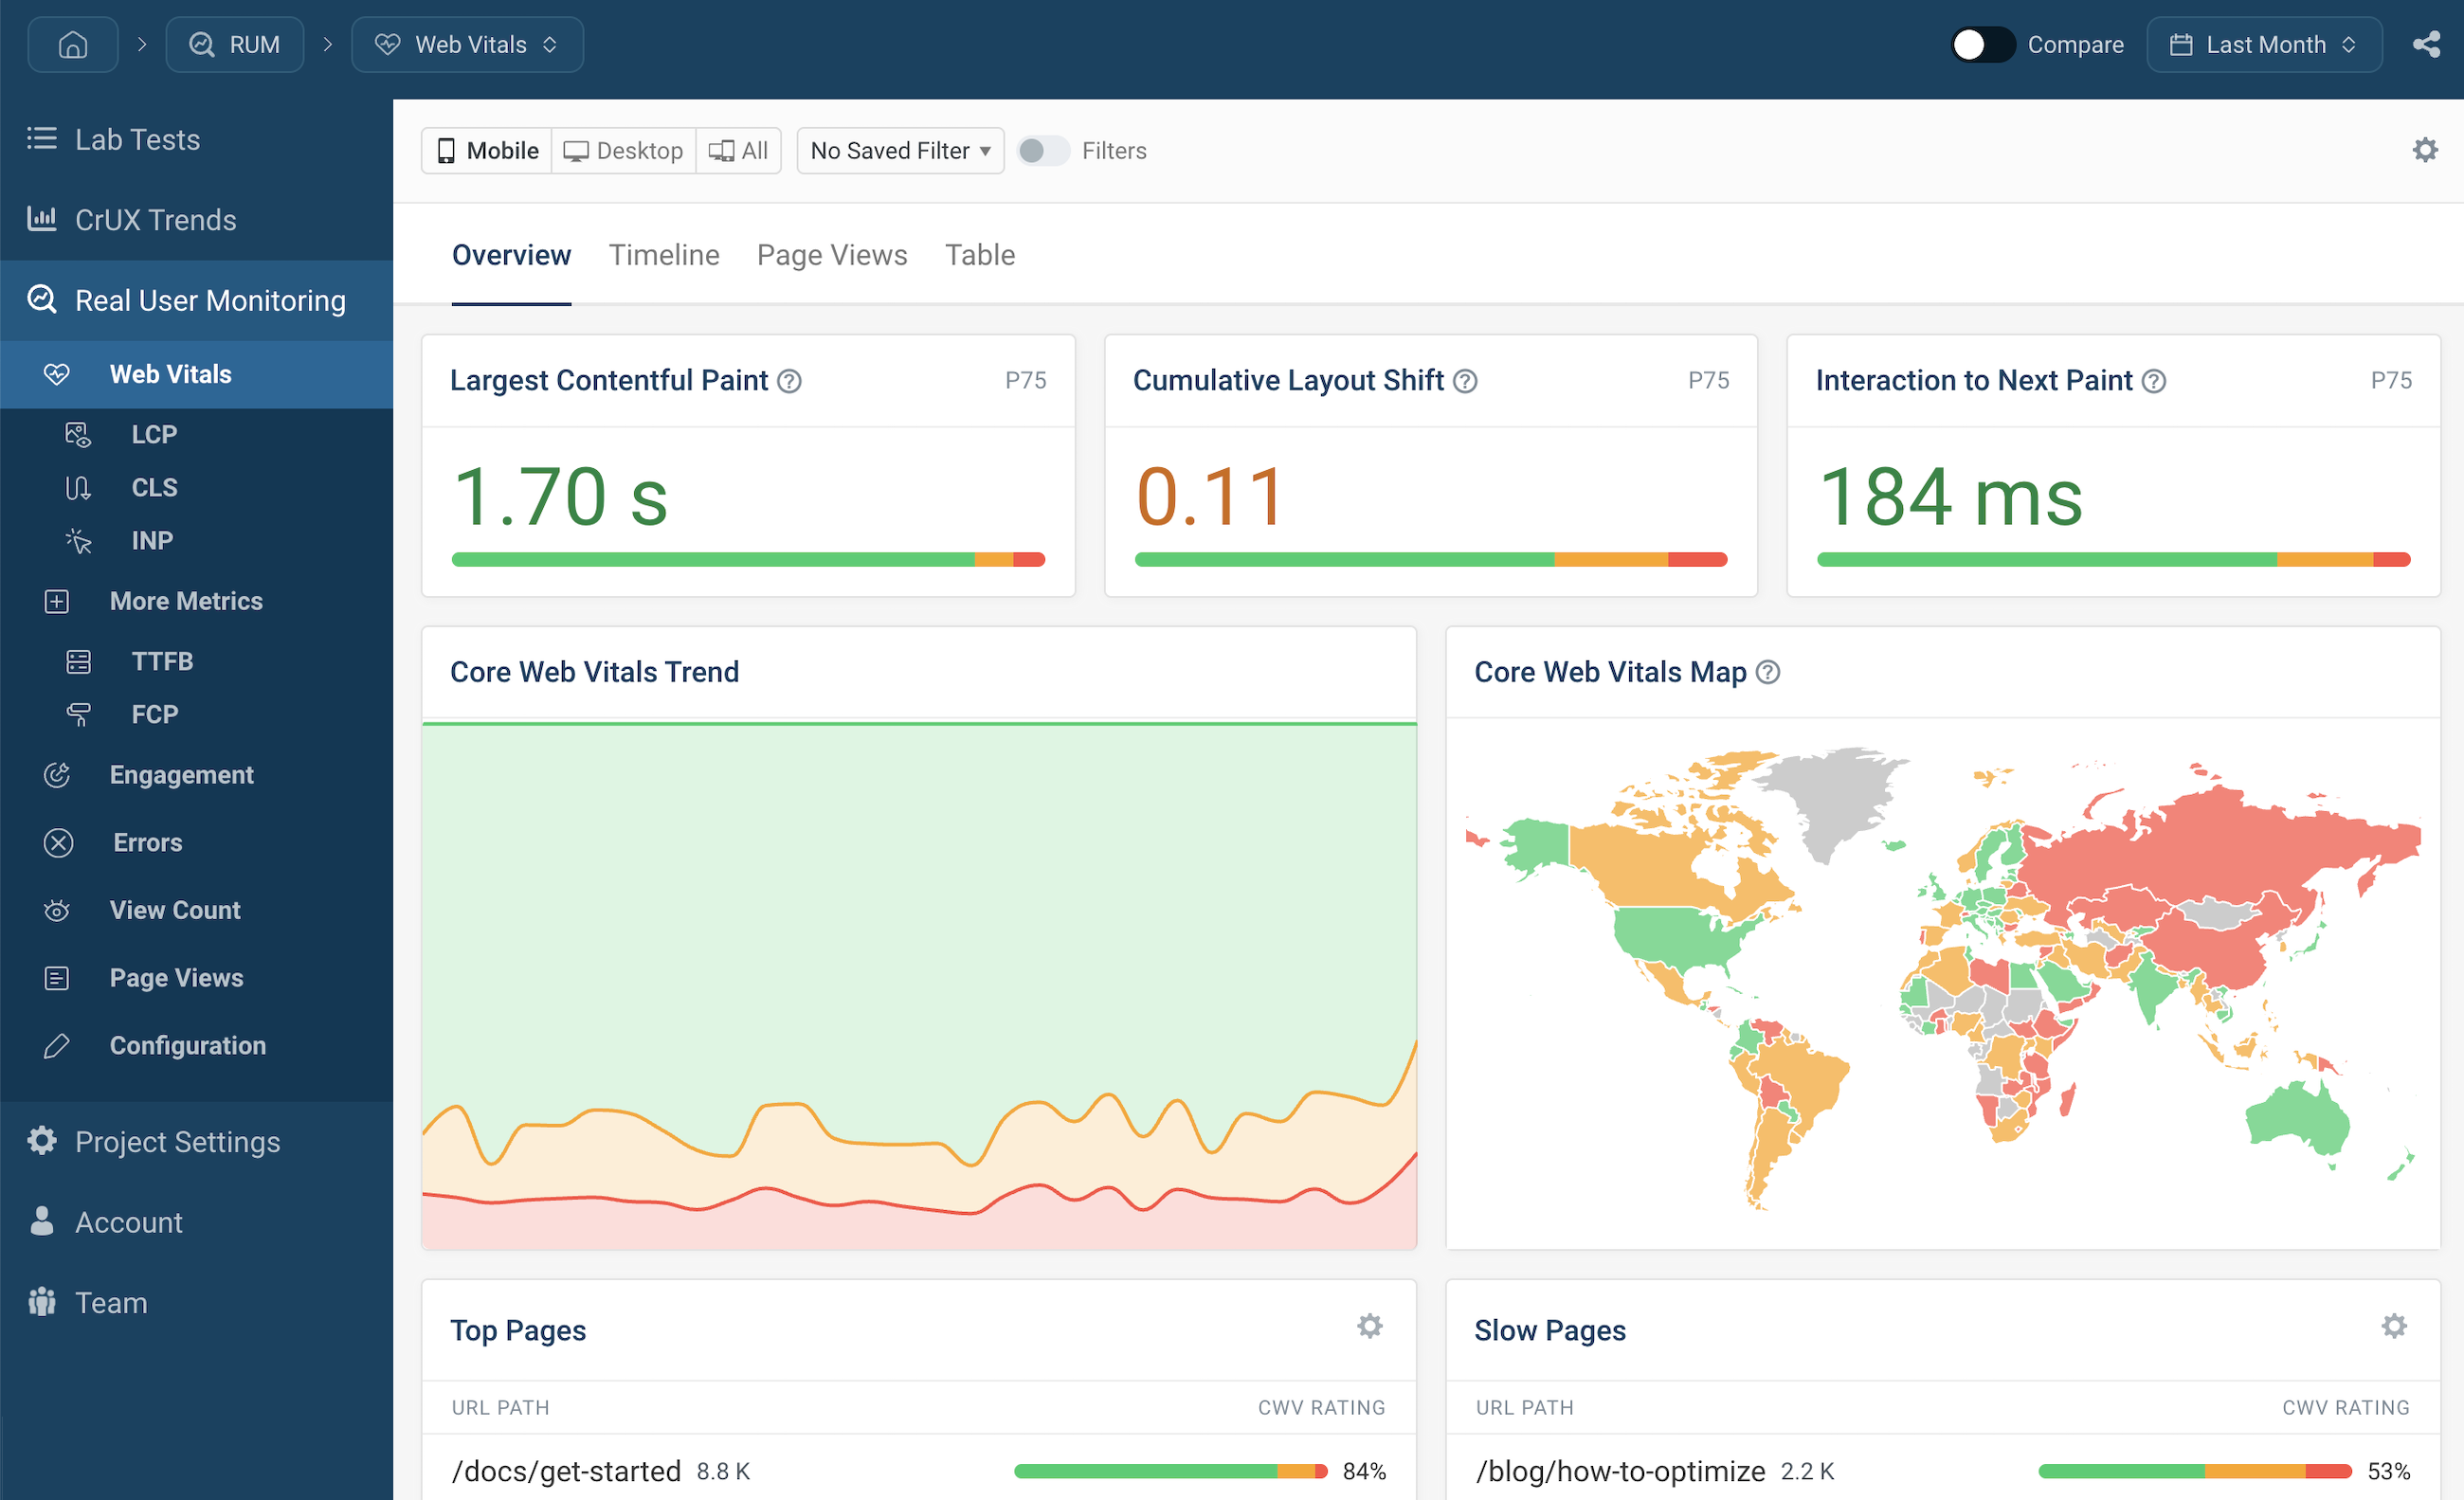
Collect data across your whole website
Install a analytics snippet and see what pages on your website are slow.
Then use our detailed page experience data to optimize them.
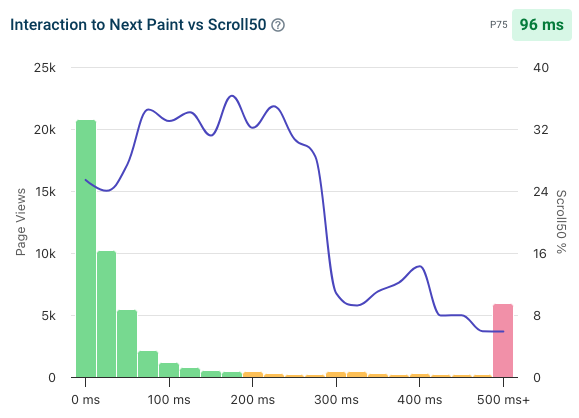
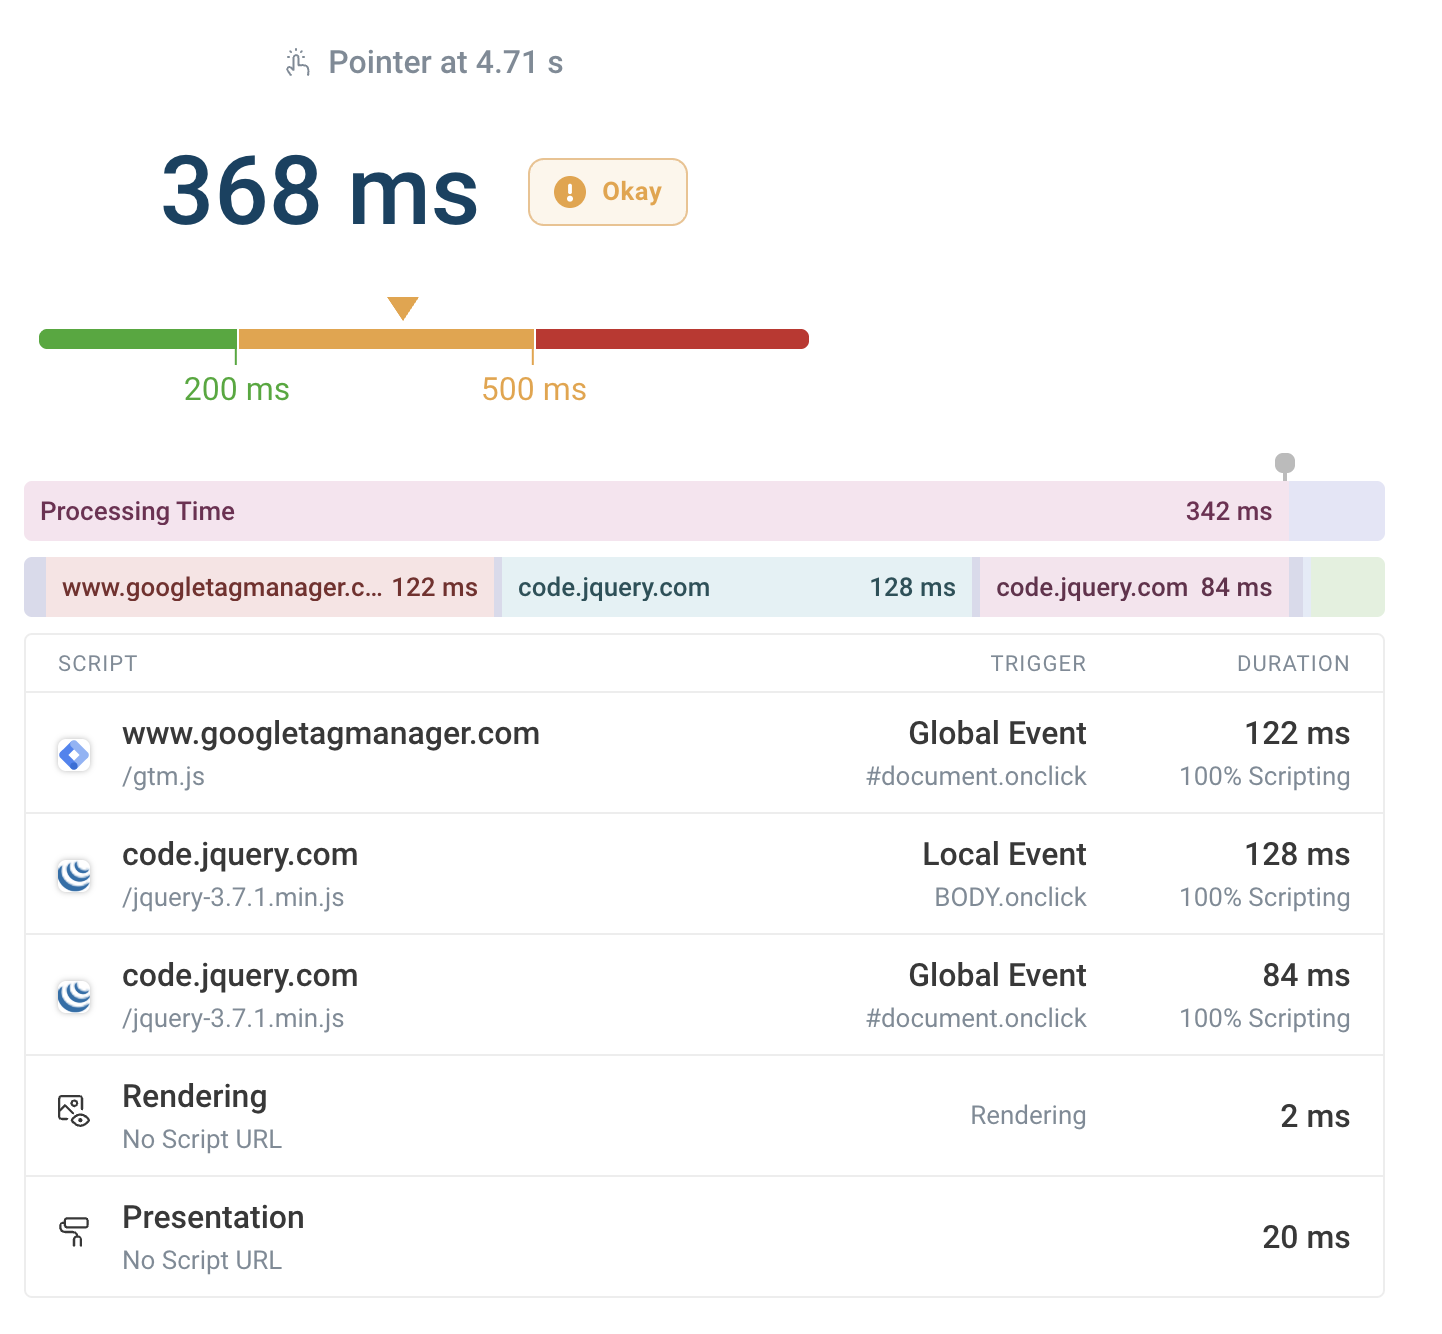
Improve Interaction to Next Paint
Google's new Core Web Vitals metric is hard to debug in the lab. DebugBear tells you
what page elements are causing long interaction delays.
Analyze performance with in-depth data
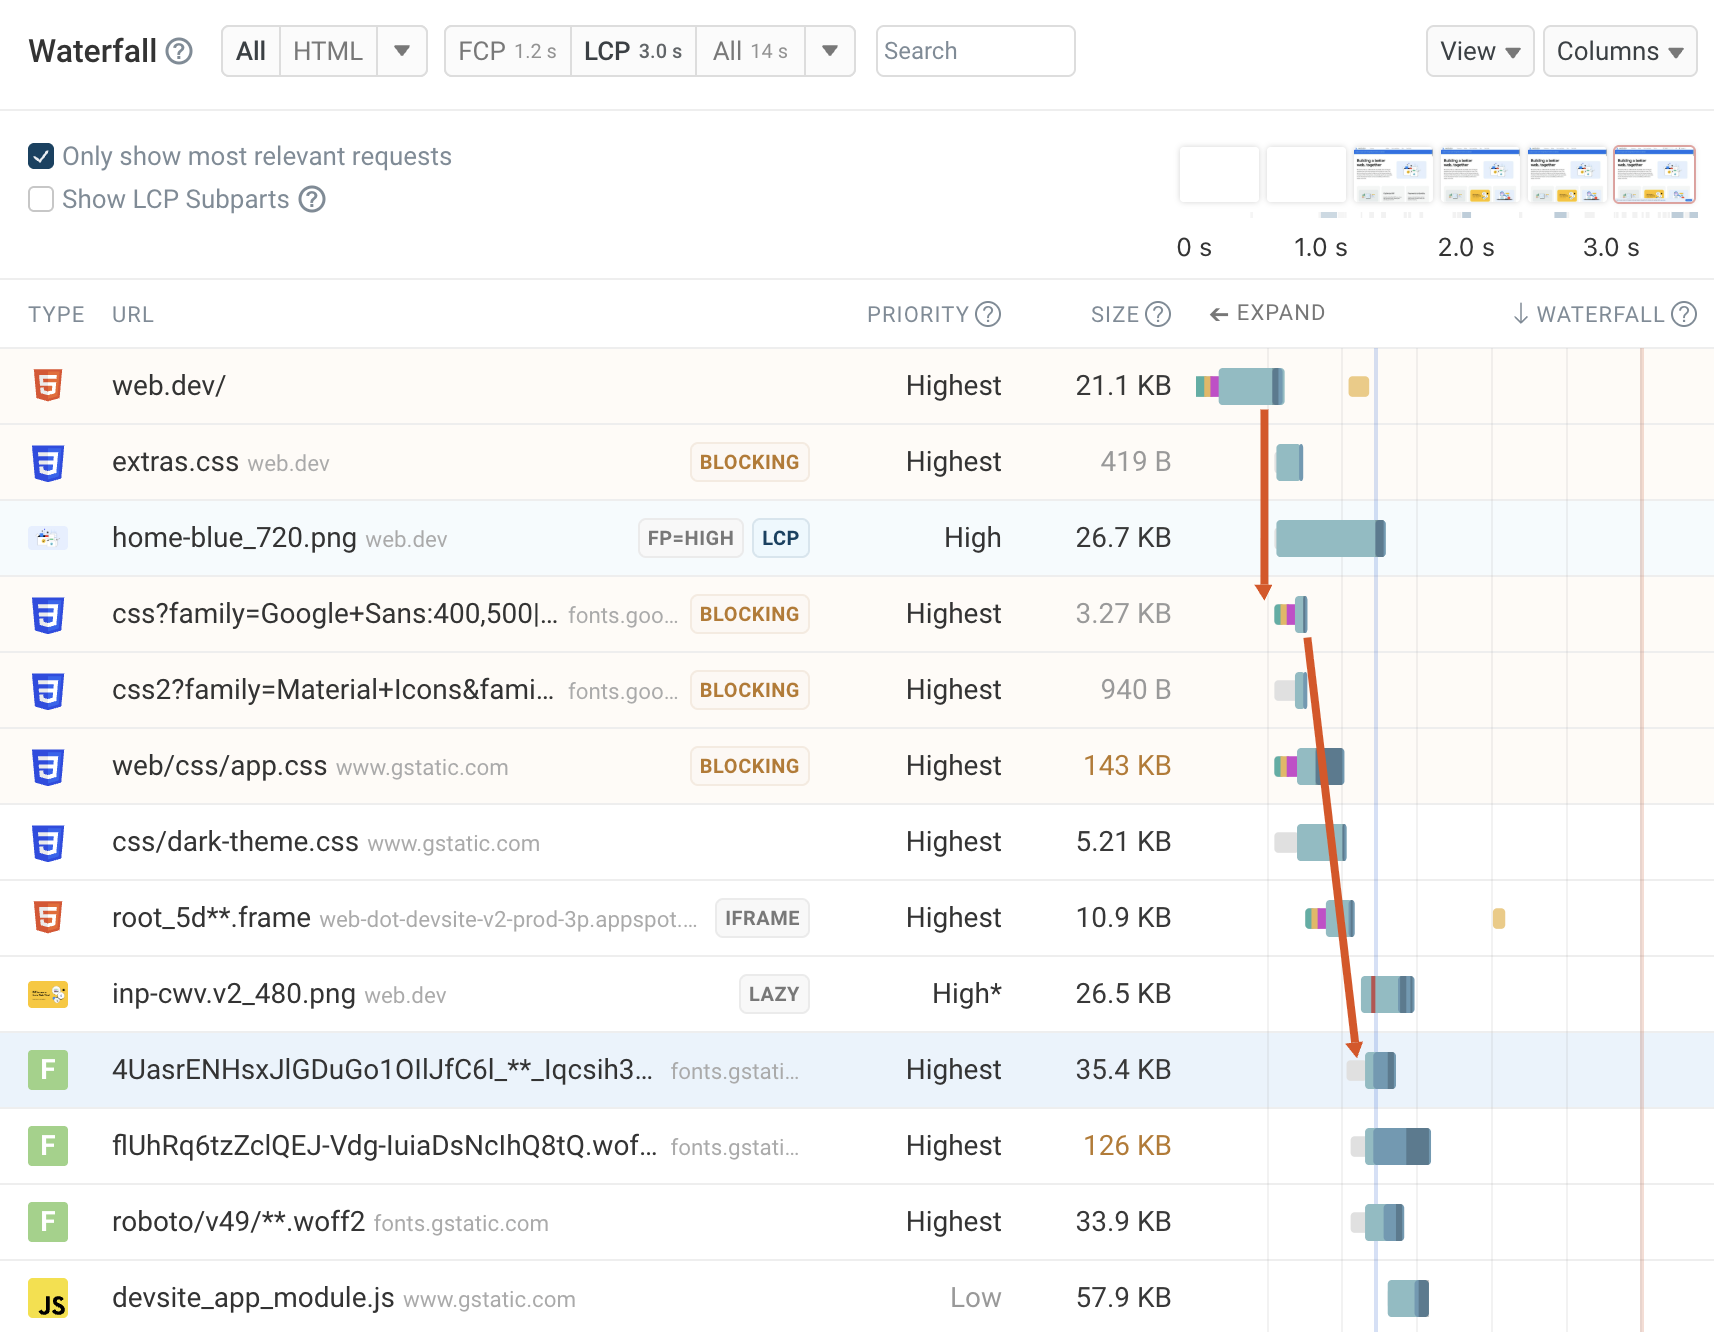
Beyond metrics and Lighthouse audits
DebugBear runs on top of Lighthouse, but it collects a large amount of additional
debug data to help you understand and optimize your site speed.
Give developers the details they need
Share in-depth data on network and CPU activity, and compare
different test results to understand a regression.