Measure And Optimize Google Core Web Vitals: A Guide
The Core Web Vitals are a set of three website performance metrics that capture how users experience the speed and responsiveness of your website. They are used as a search result ranking factor by Google.
Whether you need to learn about, test, or fix your Core Web Vitals, this post explains it all.
Core Web Vitals Quick Start
Not sure where to start? We recommend following these steps in order:
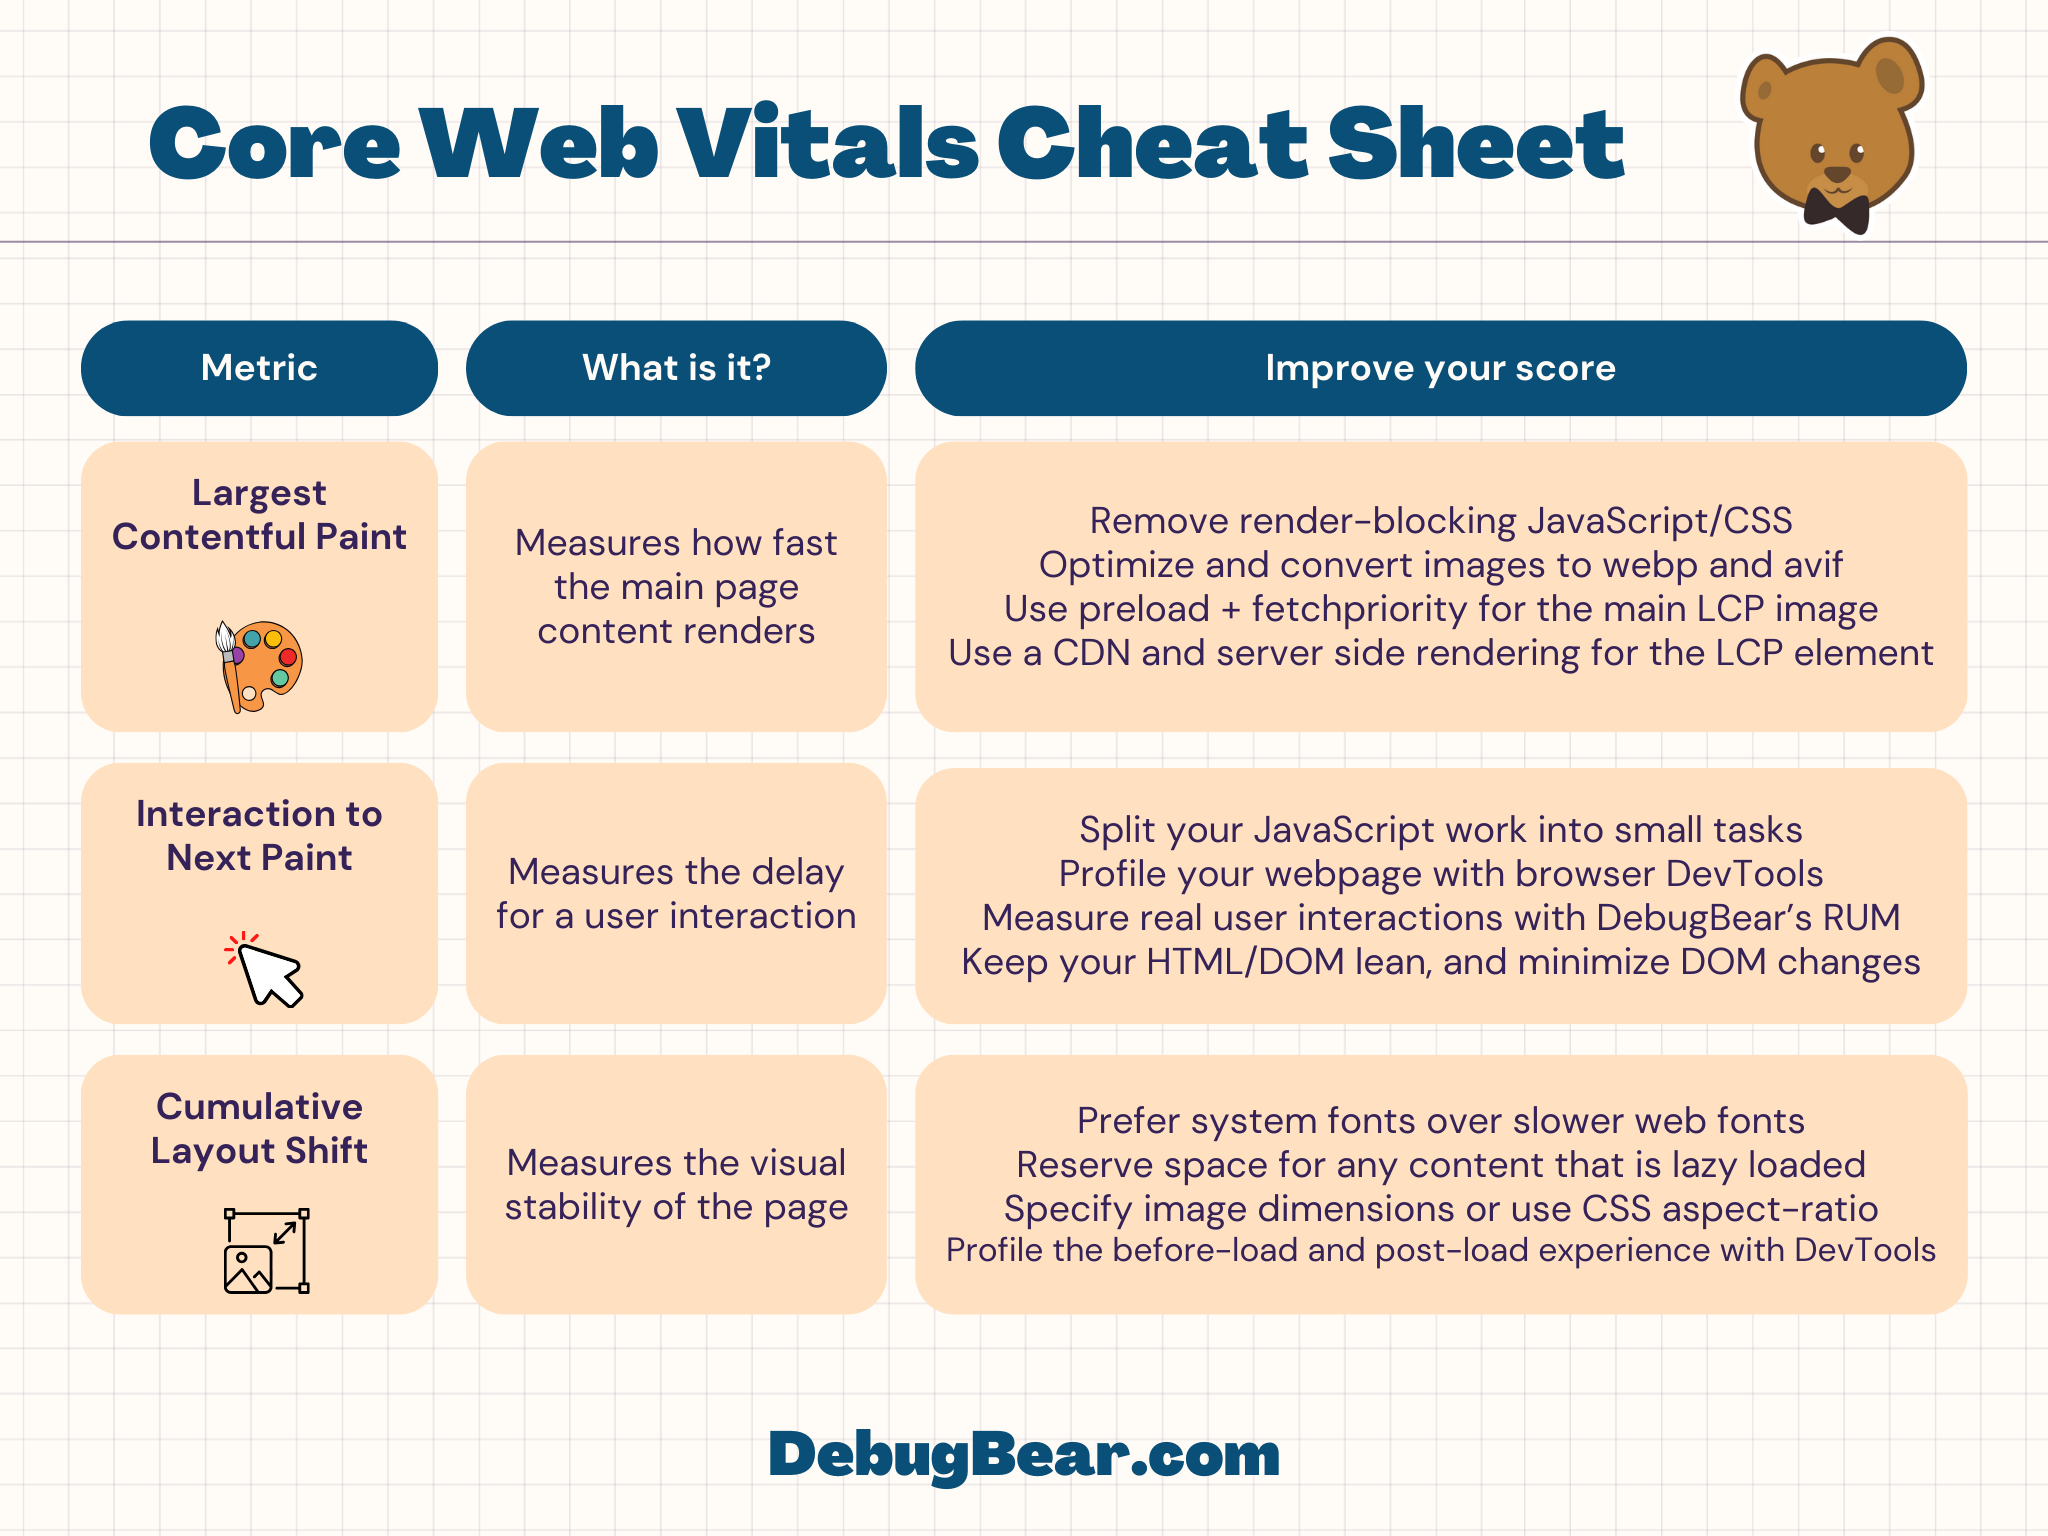
And don't forget to download our free Core Web Vitals cheat sheet.
What are the three Core Web Vitals metrics?
There are three Core Web Vitals metrics that measure your website performance and affect your search engine rankings:
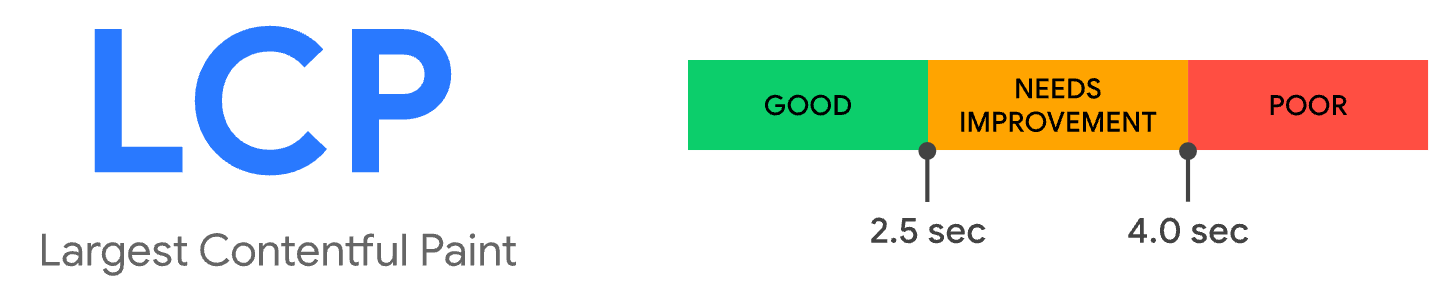
- 🖼️ Largest Contentful Paint (LCP): Measures how quickly the main page content renders
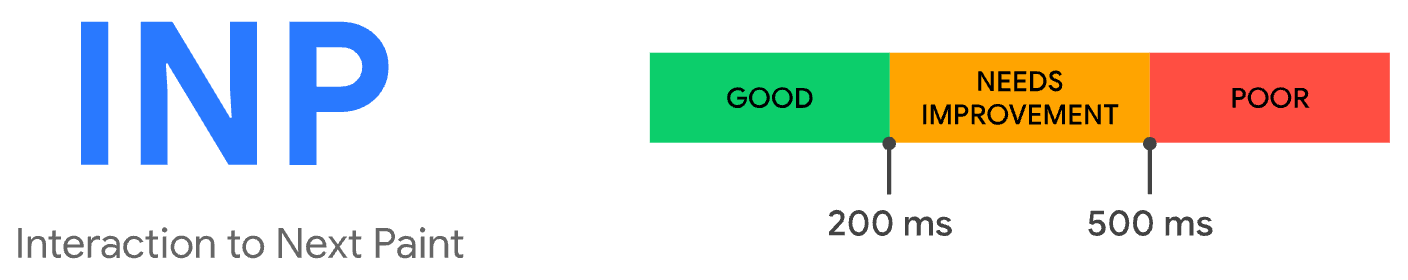
- 🖱️ Interaction to Next Paint (INP): Measures the latency for a user interaction
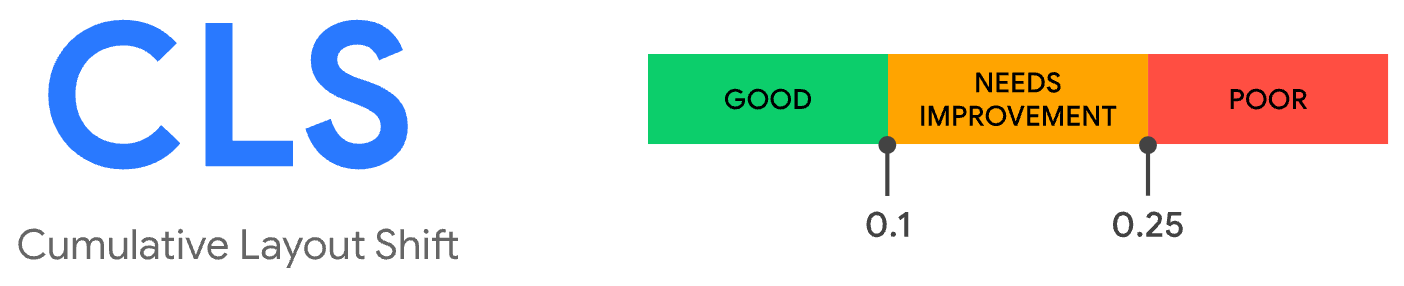
- ↕️ Cumulative Layout Shift (CLS): Measures the visual stability of the page
Google has defined scores for each metric of Core Web Vitals to rate them as "Good", "Needs Improvement", or "Poor". Scoring is covered in more detail later.
Test Core Web Vitals on your website
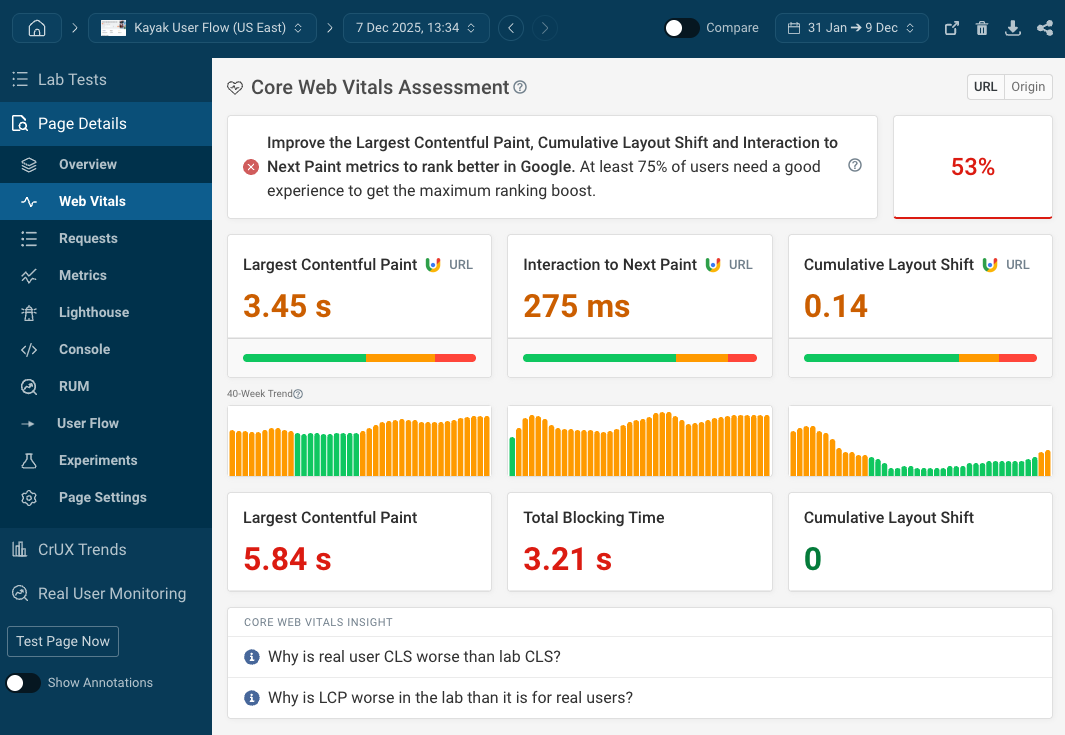
We offer a free Core Web Vitals testing tool that can show you how fast your website is for real users and what you can improve.
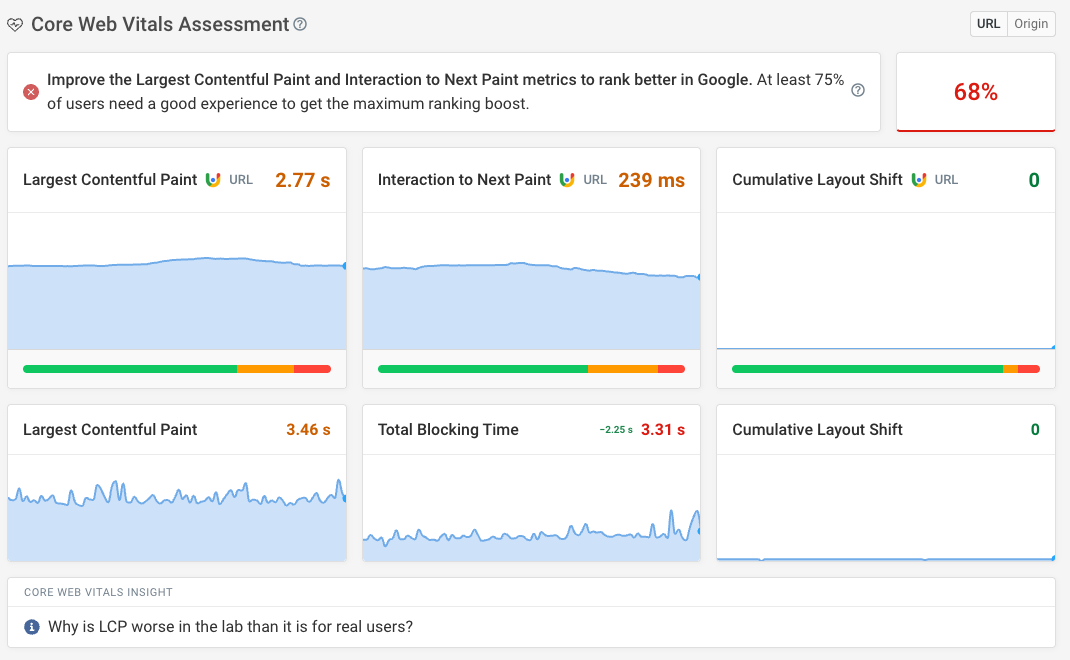
Open the Web Vitals tab after running the test to get an in-depth analysis. This will show you the real-user data from Google's CrUX as well as a result from an on-demand test.
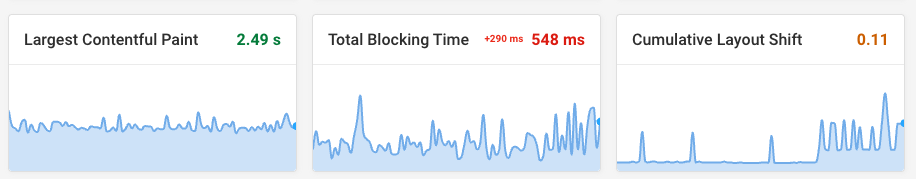
The result also shows a 40-week trendline for real user data.
Learn about Largest Contentful Paint (LCP)
LCP is one of the three Core Web Vitals metrics that measures how quickly the main content of a page renders.
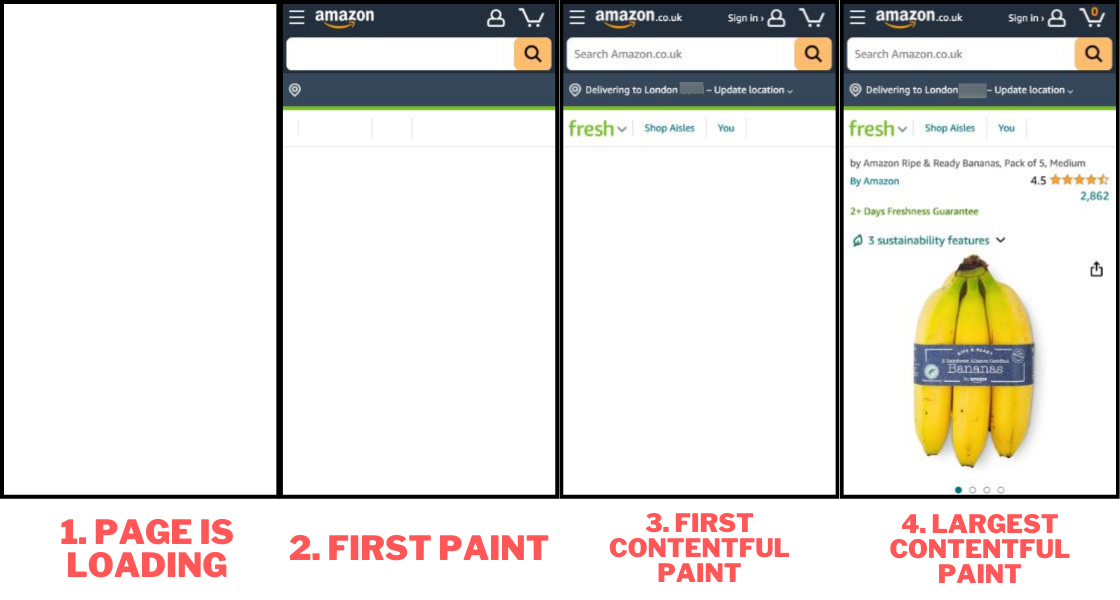
What happens when you load a website? It first starts out with a blank page. Content then starts to appear on the screen - in the browser rendering world, this is known as a paint.
Browsers have the concept of paint milestones. These milestones can be used to measure a website's performance:
- The First Paint (FP) measures when the browser first starts rendering parts of the page. This includes empty boxes without any content.
- The First Contentful Paint (FCP) measures when content, like text or images, is first rendered by the browser.
- The Largest Contentful Paint (LCP) measures at what time the largest UI element was rendered on the page.
Load time milestones like this have been used as page speed metrics for a long time. Early on the Load Event was used to assess whether a page had loaded. However, the load event has no direct relationship to visual content appearing for the user, so new metrics like FCP and LCP were introduced over time to better reflect the user experience.
This filmstrip timeline shows how more and more content is rendered by the browser as it becomes available.
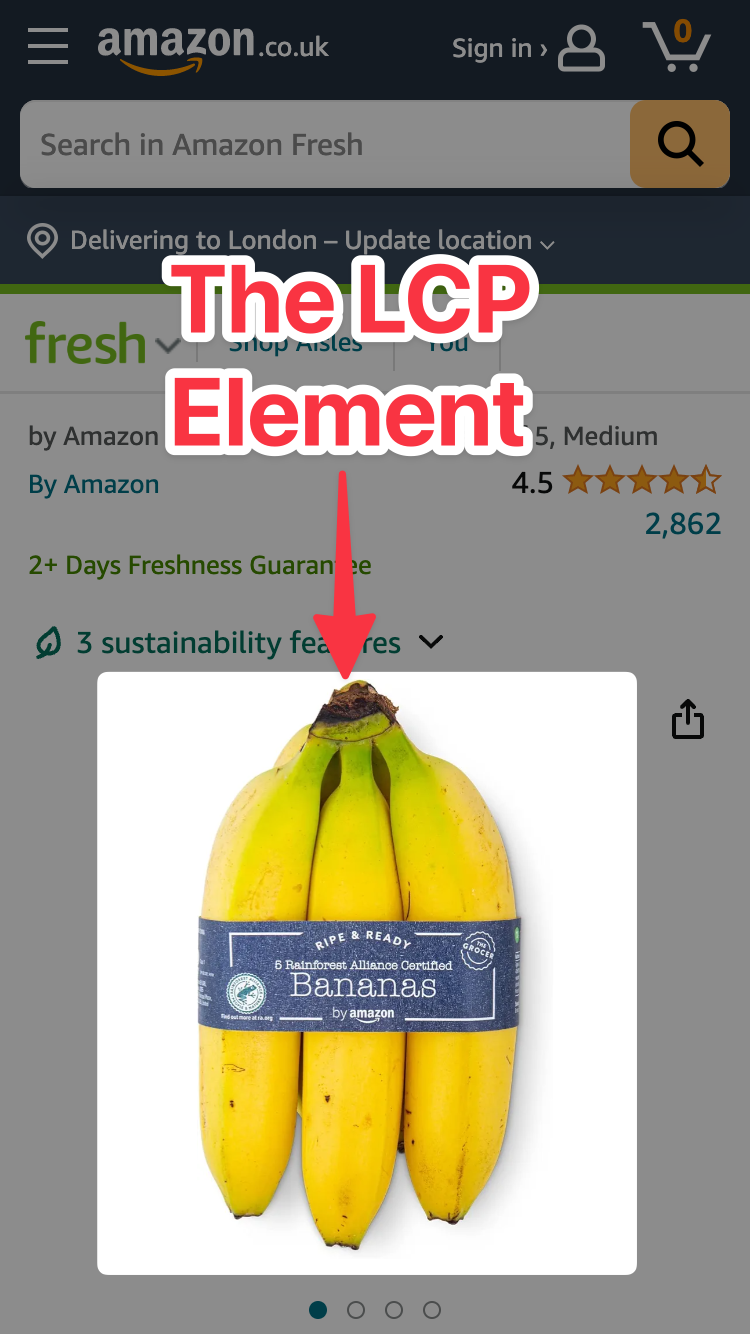
The previous screenshot shows how the product image (the bananas) is the LCP element. When that image appears in less than 2.5 seconds, the LCP score is considered "Good".
The Largest Contentful Paint tries to identify the single largest content element on the page and measures when it appears. A content element could be a piece of text, an image, or the first frame of a video.

To optimize the Largest Contentful Paint you should:
- Reduce server response time: For example, use a Content Delivery Network (CDN) to serve content closer to the user.
- Remove render-blocking resources: Use
asyncanddeferattributes for JavaScript files, so they don't block the rendering of the page. You should also consider inlining critical CSS. - Optimize your images and size them appropriately: Modern image formats like
.avifand.webphave good browser support and can reduce the size of your images. - Prioritize the LCP image with the
fetchpriorityattribute and lazy load less important images to reduce bandwidth competition. - Preload the main page image: Use the
rel="preload"attribute to tell the browser to fetch the main image as soon as possible. - Use server-side rendering when building JavaScript applications: Instead of using client-side rendering, you should render the page on the server and send the full HTML to the browser.
Scoring the Largest Contentful Paint metric
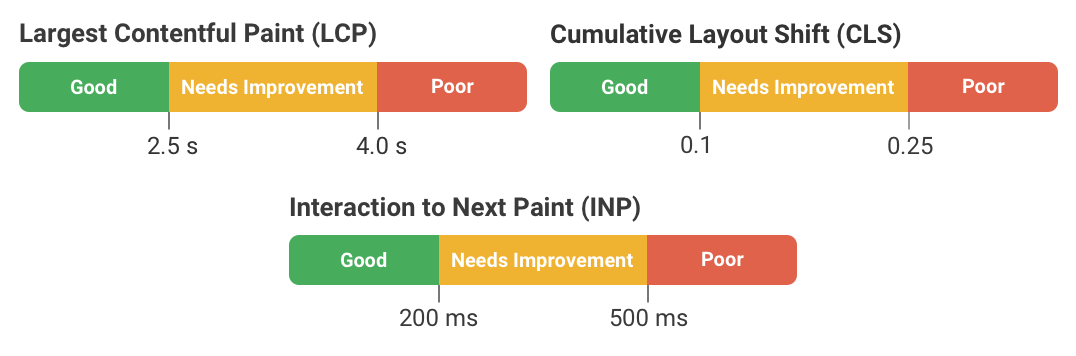
Here's the current LCP scoring guide, as set by Google:
- 🟢 If your LCP is under 2.5 seconds, it's considered "Good".
- 🟡 If your LCP is between 2.5 and 4 seconds, it "Needs Improvement".
- 🔴 If your LCP is over 4 seconds, it's "Poor".
Understand Interaction to Next Paint (INP)
Interaction to Next Paint is another Core Web Vitals metric, and measures how quickly a page responds to user interactions.
For example, when a user clicks a button it might take half a second to process the event and update the user interface. If the user interaction takes half a second to process, the INP score is 500 milliseconds.
But what is a "user interaction"? For the purposes of the INP metric, a user interaction is a click, tap, or keypress.

Optimizing your INP score can involve a number of tasks. If you're having issues with INP, we recommend going through the following steps to fix your INP scores:
- Profile user interactions in Chrome DevTools: Perform a user interaction on your website during a DevTools performance recording, then inspect the results to identify slow tasks.
- Minimize overall CPU time and blocking tasks that can delay event processing (measured by the Total Blocking Time metric).
- Remove unused JavaScript and CSS code to reduce the amount of work the browser has to do. Code coverage tools within DevTools can help you identify unused code.
- Start using DebugBear's real user monitoring service to track slow interactions experienced by real users.
Scoring the Interaction to Next Paint metric
Here's the current INP scoring guide, as set by Google:
- 🟢 If your INP is under 200 milliseconds, it's considered "Good".
- 🟡 If your INP is between 200 and 500 milliseconds, it "Needs Improvement".
- 🔴 If your INP is over 500 milliseconds, it's "Poor".
Explore Cumulative Layout Shift (CLS)
Moving onto the final Core Web Vital metric covered in this guide, Cumulative Layout Shift (CLS) measures how much content moves around after first being rendered. Visual stability is important for a good experience.
This video shows an example of content shifting around during a page load:
Layout instability can cause users to be disoriented, for example if a button moves around while the user is trying to click it, or if text shifts around after the user starts reading.
Only unexpected layout shifts count toward the CLS score. If content moves around after a user interaction like a click then this does not increase CLS.
How you optimize your CLS score depends on the cause of the layout shift. But here are some common strategies:
- Set dimensions for media: If you know the size of an image or video, set the dimensions in the HTML to reserve space for it, or use the
aspect-ratioCSS property. - If you're using web fonts, consider using system fonts instead. Or, if you must use web fonts, make sure the fallback font closely resembles the web font.
- Reserve the space for ads, embeds, or any lazy-loaded content: You can do this with a placeholder element or with the CSS
aspect-ratioproperty.
Scoring the Cumulative Layout Shift metric
Largest Contentful Paint and Interaction to Next Paint are both measured in seconds, but Cumulative Layout Shift is measured in a unitless score.
Here's the current CLS scoring guide, as set by Google:
- 🟢 If your CLS is under 0.1, it's considered "Good".
- 🟡 If your CLS is between 0.1 and 0.25, it "Needs Improvement".
- 🔴 If your CLS is over 0.25, it's "Poor".
How to test your Core Web Vitals
You now have some understanding of the Core Web Vitals metrics. But you might be wondering:
- How do I test Core Web Vitals on my own website?
- If Interaction to Next Paint is measured from real user data, how do I get that data?
- Can I check Core Web Vitals for free?
Continue reading to learn more, and get answers to these questions.
Test Core Web Vitals with DebugBear
The Core Web Vitals Testing tool is a free online tool that takes in a URL and gives you a report on how your website performs. You can use this report to conduct a performance analysis.
To check your Core Web Vitals, enter your URL on the DebugBear Core Web Vitals Testing Tool or use this sample report.

Once the test is complete, click on Web Vitals in the sidebar, and notice you see both real user data from Google's Chrome User Experience Report (CrUX) and lab data from the test (it's normal for the two to differ).
Google CrUX data (collected from real users):
DebugBear lab data (will be different from CrUX data):
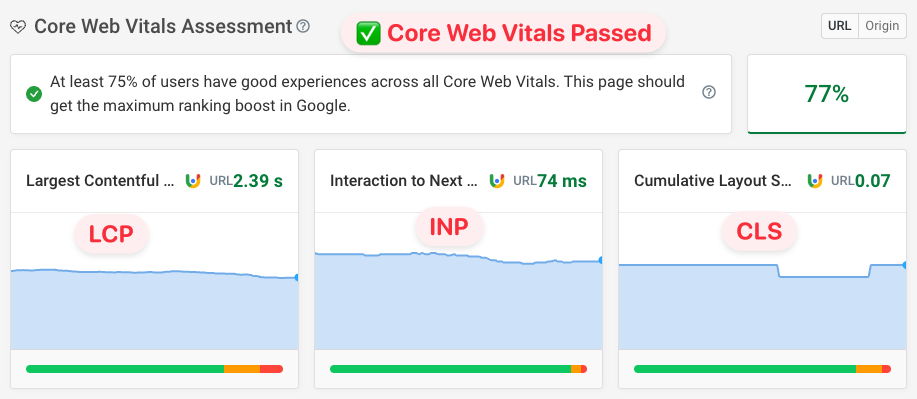
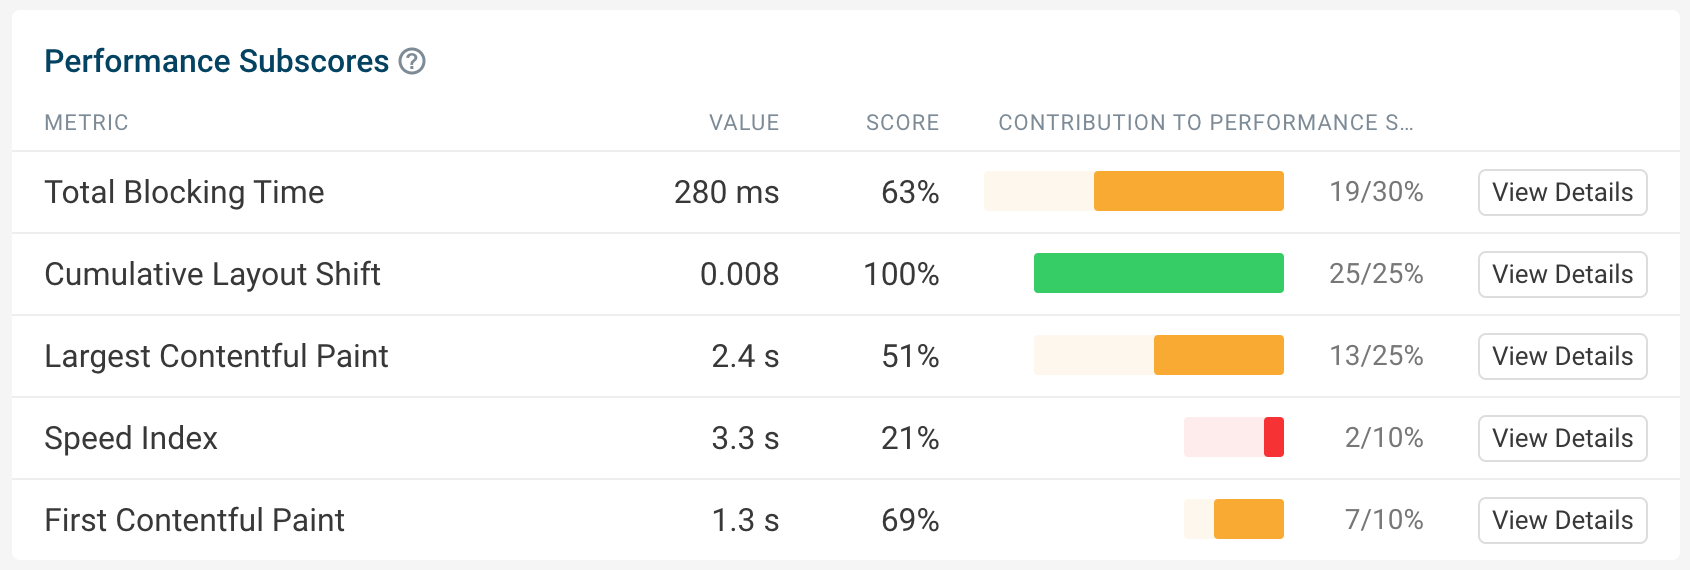
In addition to letting you know if you pass or fail the Core Web Vitals assessment, DebugBear also provides recommendations on how to optimize your website, as well as reporting additional web performance metrics like page weight or server response time.
The following screenshot shows a DebugBear lab result. Match the numbers on the screenshot with the explanations below the image.
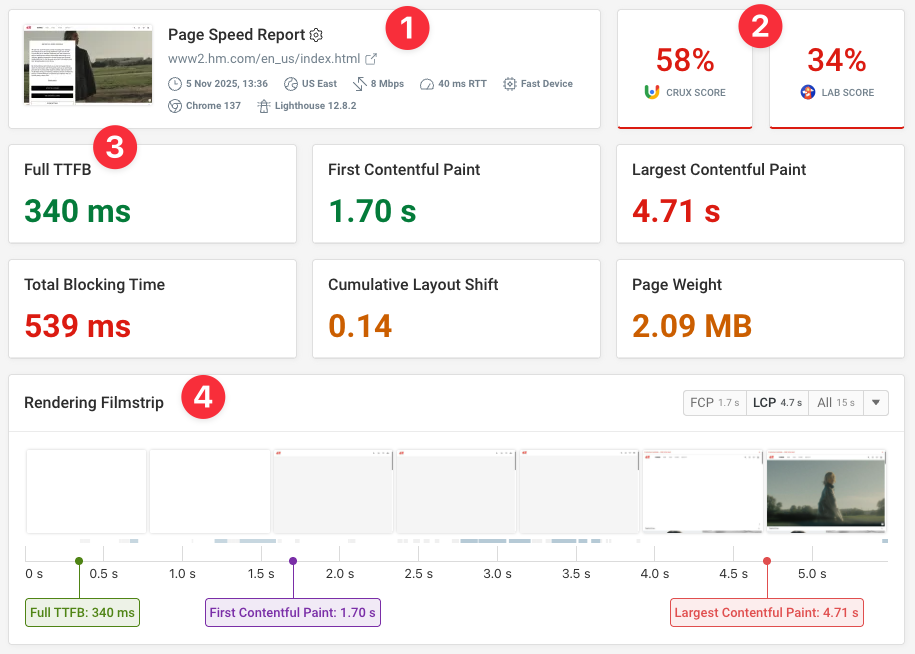
Explanations:
-
The lab test conditions: This shows the device and network conditions used for the test.
-
A real user score and lab data score: The real user score consists of Google Core Web Vitals data, and the lab data score comes from the current test run, and is made up of additional performance metrics.
-
Performance metrics like LCP, FCP, Speed Index, TTFB, Page Weight and more.
-
A timeline of the page load, including screenshots and rendering milestones.
In addition to the free test, you can also sign up for a free trial to monitor page speed over time and track real user Core Web Vitals on your website.
Collecting real-user Core Web Vitals data
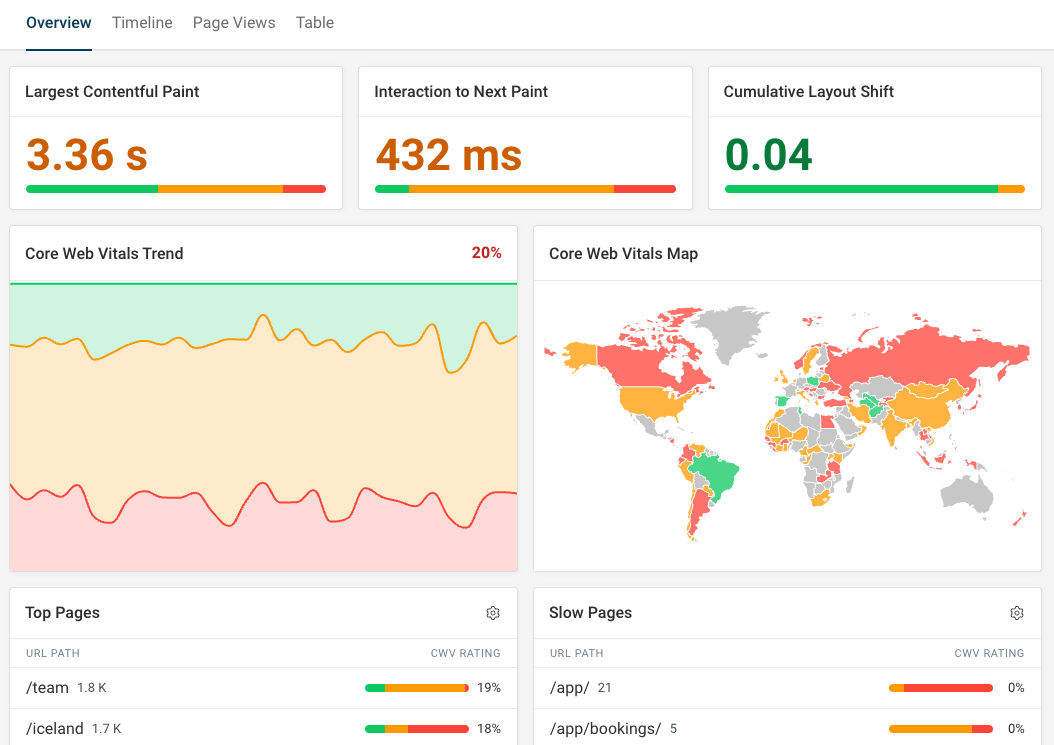
Real user monitoring (RUM) shows you how fast different pages on your website are, and whether visitors from different places across the world experience it differently.
Unlike Google's CrUX data, RUM provides real-time reporting and includes debug data to help you analyze and fix performance issues.
You can also see details like:
- What are the most common LCP elements on a page? For example, is the main product image the LCP element for most user visits?
- What page elements are most likely to result in slow interactions? The Optimize feature guides you through this process.
- Data for individual user experiences: Dive into specific user journeys to gain visibility of the device, network, browser, location, and more, for each user experience.
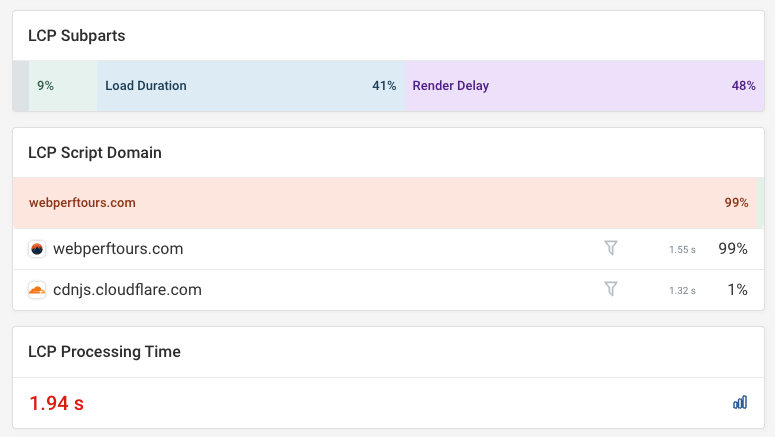
For example, when debugging LCP issues you can see how often different content elements are the largest page component, and what LCP subpart contributes the most to overall load time.
DebugBear RUM can also identify specific scripts that are slowing down the initial page load.
Looking at specific visitor interactions tells you where the user clicked and what scripts were involved in handling the interaction.
You can see when each script ran during the interaction. In this example, almost all processing happens directly in response to the user interaction, rather than as part of a background task or when presenting page content.
Some scripts run as part of global event handlers, while the BUTTON.onclick trigger indicates an event handler directly on the button that the user clicked on.

Browsers report script processing data through the Long Animation Frames API.
Additional tools to test your Core Web Vitals
There are other free Core Web Vitals testing tools available, such as:
- Google PageSpeed Insights: Provides field data where available, and also lab data.
- Site Speed Chrome Extension: View the Core Web Vitals for the page you're currently on, in just one click!
- Google Search Console: Where available, Google can present Core Web Vitals data from CrUX within the Search Console.
- Chrome DevTools: The Performance and Lighthouse panels within Chrome DevTools can be used to measure Core Web Vitals.
Core Web Vitals data on PageSpeed Insights
DebugBear offers lab data, real user monitoring data, and Google's CrUX data in one place. However, if you want to explore Core Web Vitals data in other tools, here's how to do it in PageSpeed Insights.
Google provides the free PageSpeed Insights (PSI) tool to test the performance of your website.
PageSpeed Insights reports two types of data:
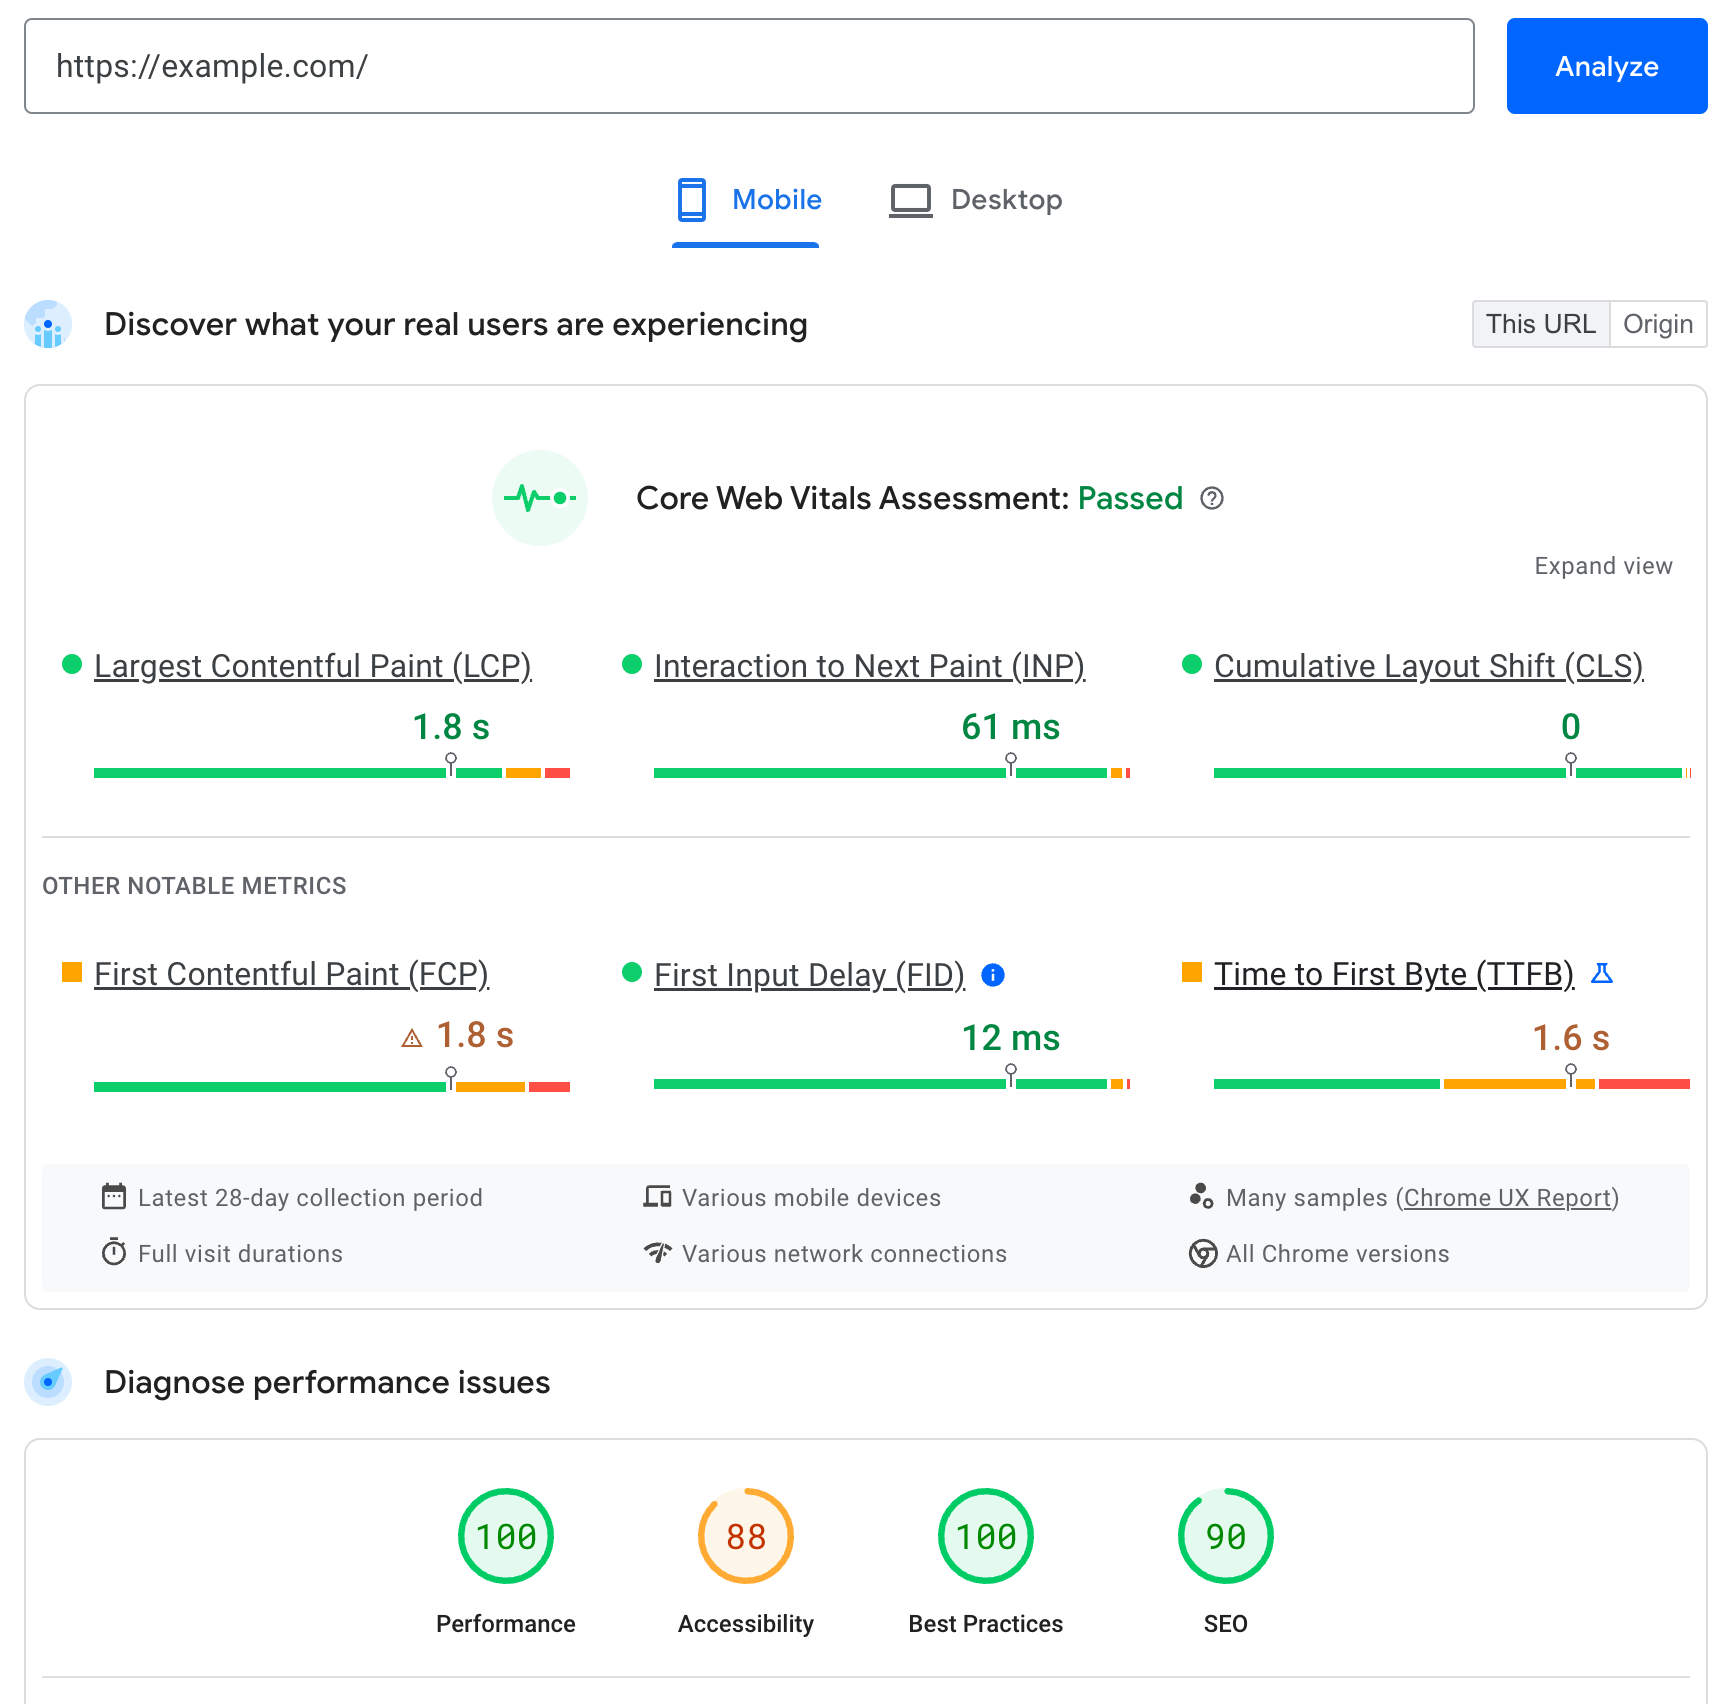
- Field data has been collected by Google from real users accessing your page. If your website doesn't get much traffic, you might not get any data here, or see data aggregated across your entire website.
- Lab data is collected in a Lighthouse lab environment when you run the PageSpeed Insights test. It uses a simulated mobile device to generate test data. This is what you see under the diagnose performance issues heading.
Note that the Lighthouse Performance score does not directly impact rankings and should only be used as a high-level indicator.
What are other notable Web Vitals metrics in PageSpeed Insights?
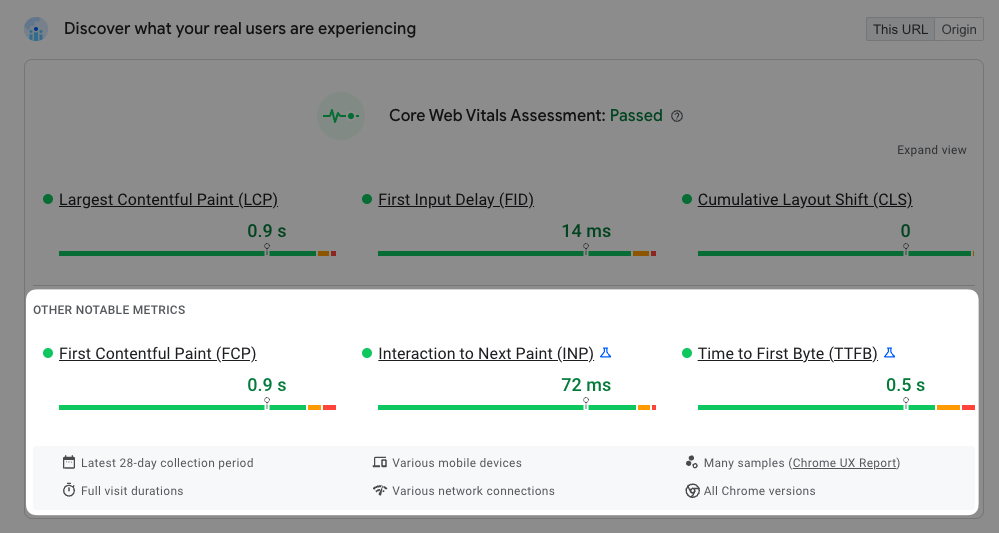
In addition to the three Core Web Vitals, PageSpeed Insights also shows real user data for First Contentful Paint, Interaction to Next Paint, and Time to First Byte. These three Web Vitals metrics don't affect Google rankings, but are useful as diagnostic metrics.
For example, Time to First Byte (TTFB) measures how quickly the server responds to the HTML document request. Before loading the HTML document the browser can't start displaying content. If you get a slow server response time, that suggests backend code on your server is slow and might be holding back the Largest Contentful Paint.
Easily view web vitals data with a Chrome extension
We built a Site Speed extension for Google Chrome. It shows you Core Web Vitals for the page you're currently on.
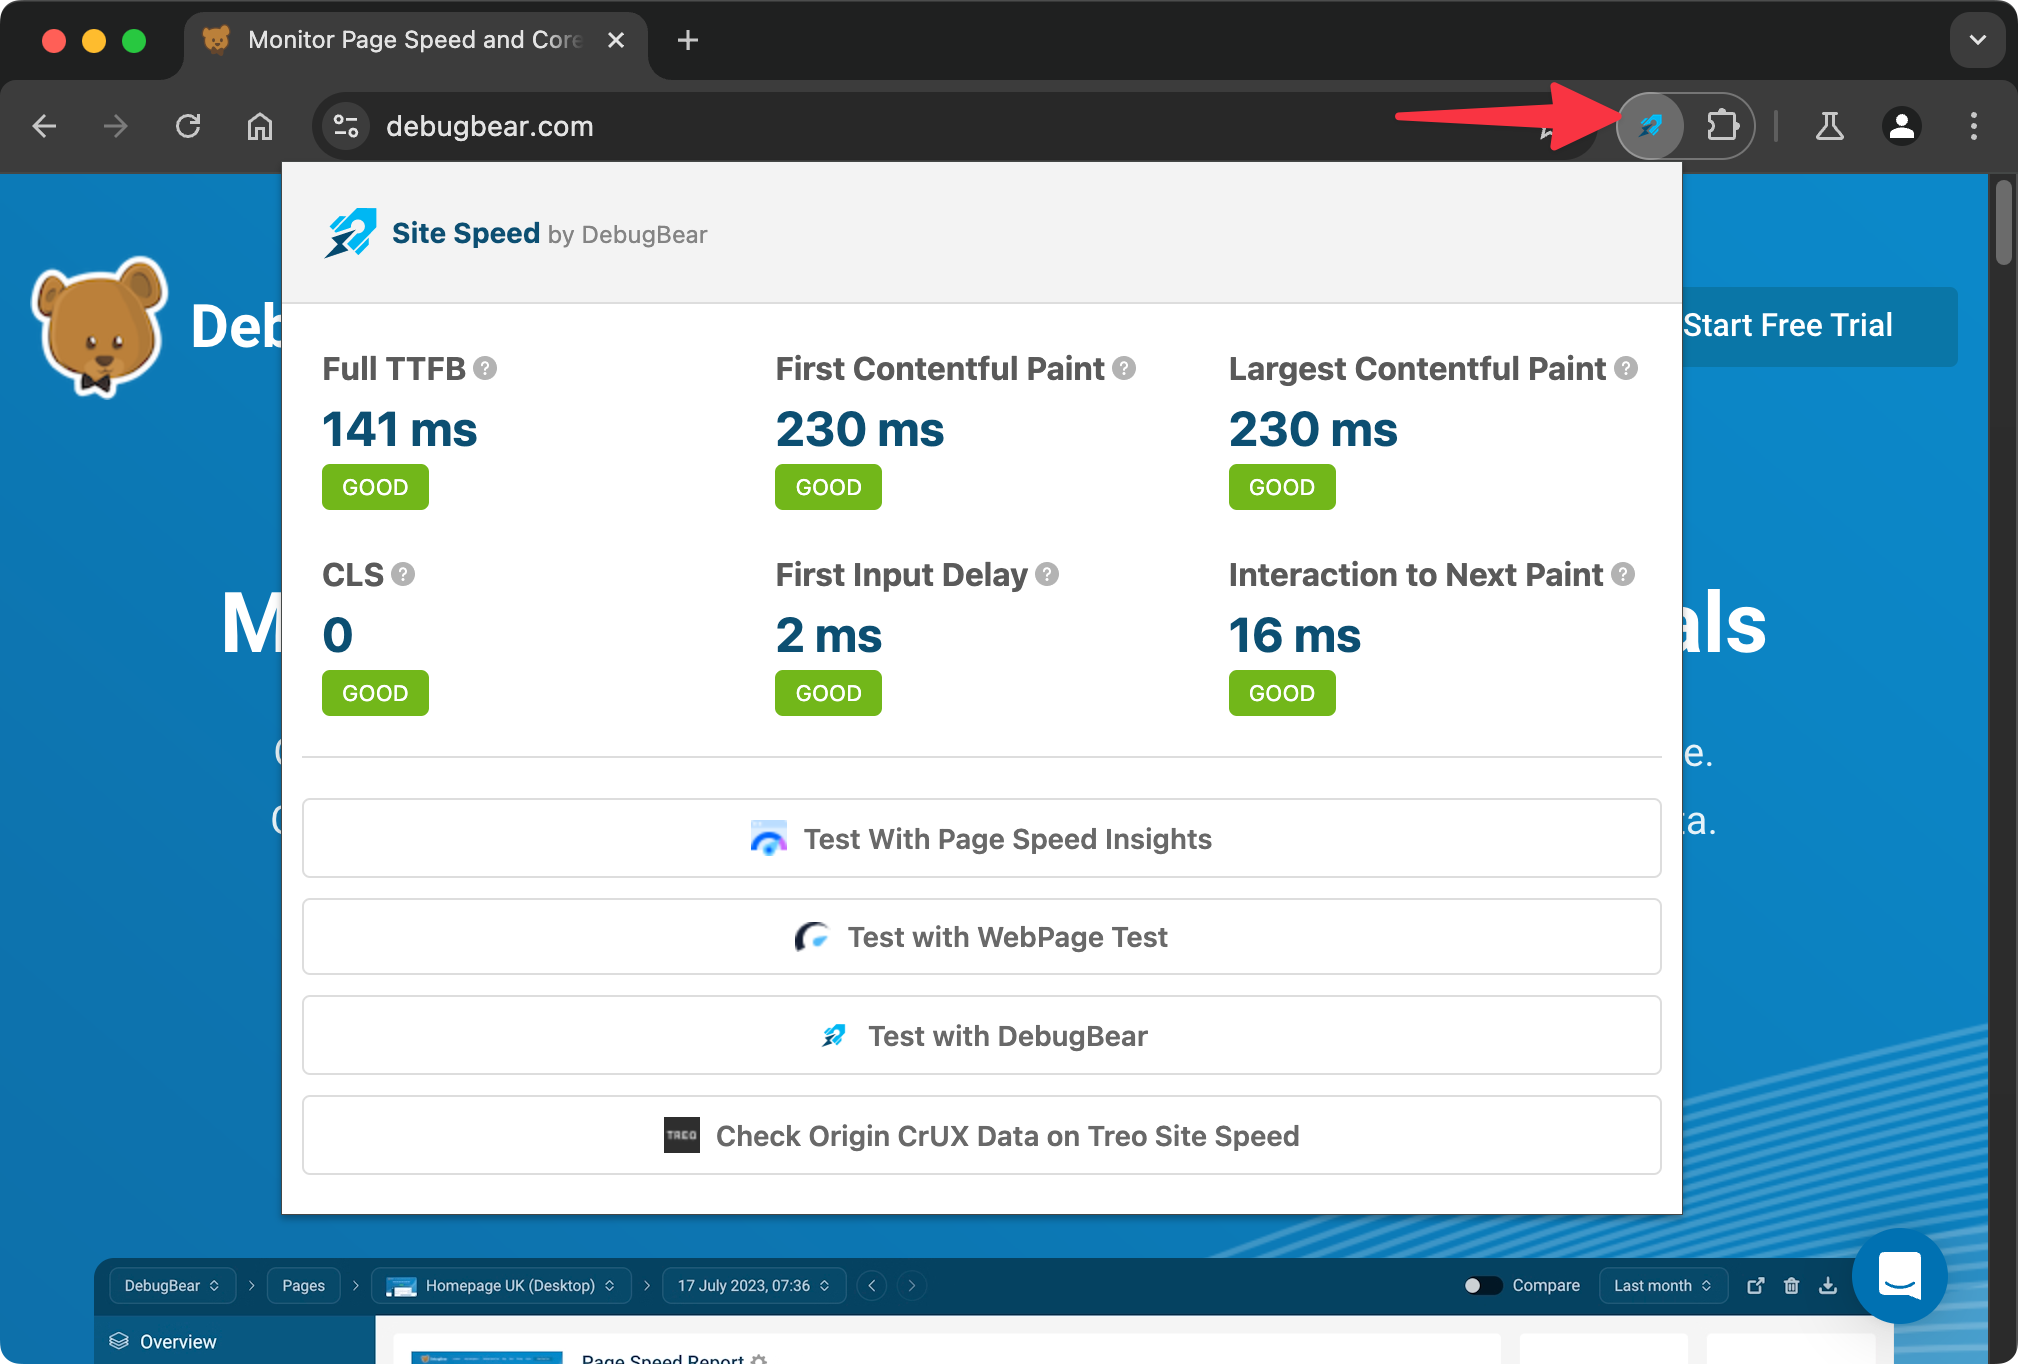
Using this extension can complement your performance testing workflow, as you get instant feedback as you're browsing pages on a website. When you discover surprising results, or want to investigate further, you can run a full test with DebugBear and DevTools.
Check site-wide Core Web Vitals performance in Google Search Console
If you have already enabled Google Search Console for your website, it's worth being aware of the Web Vitals data in Google Search Console. If you do not have access to Google Search Console, it's not imperative to set it up just for Core Web Vitals data.
Select Experience > Core Web Vitals from the sidebar to view how your website is doing.
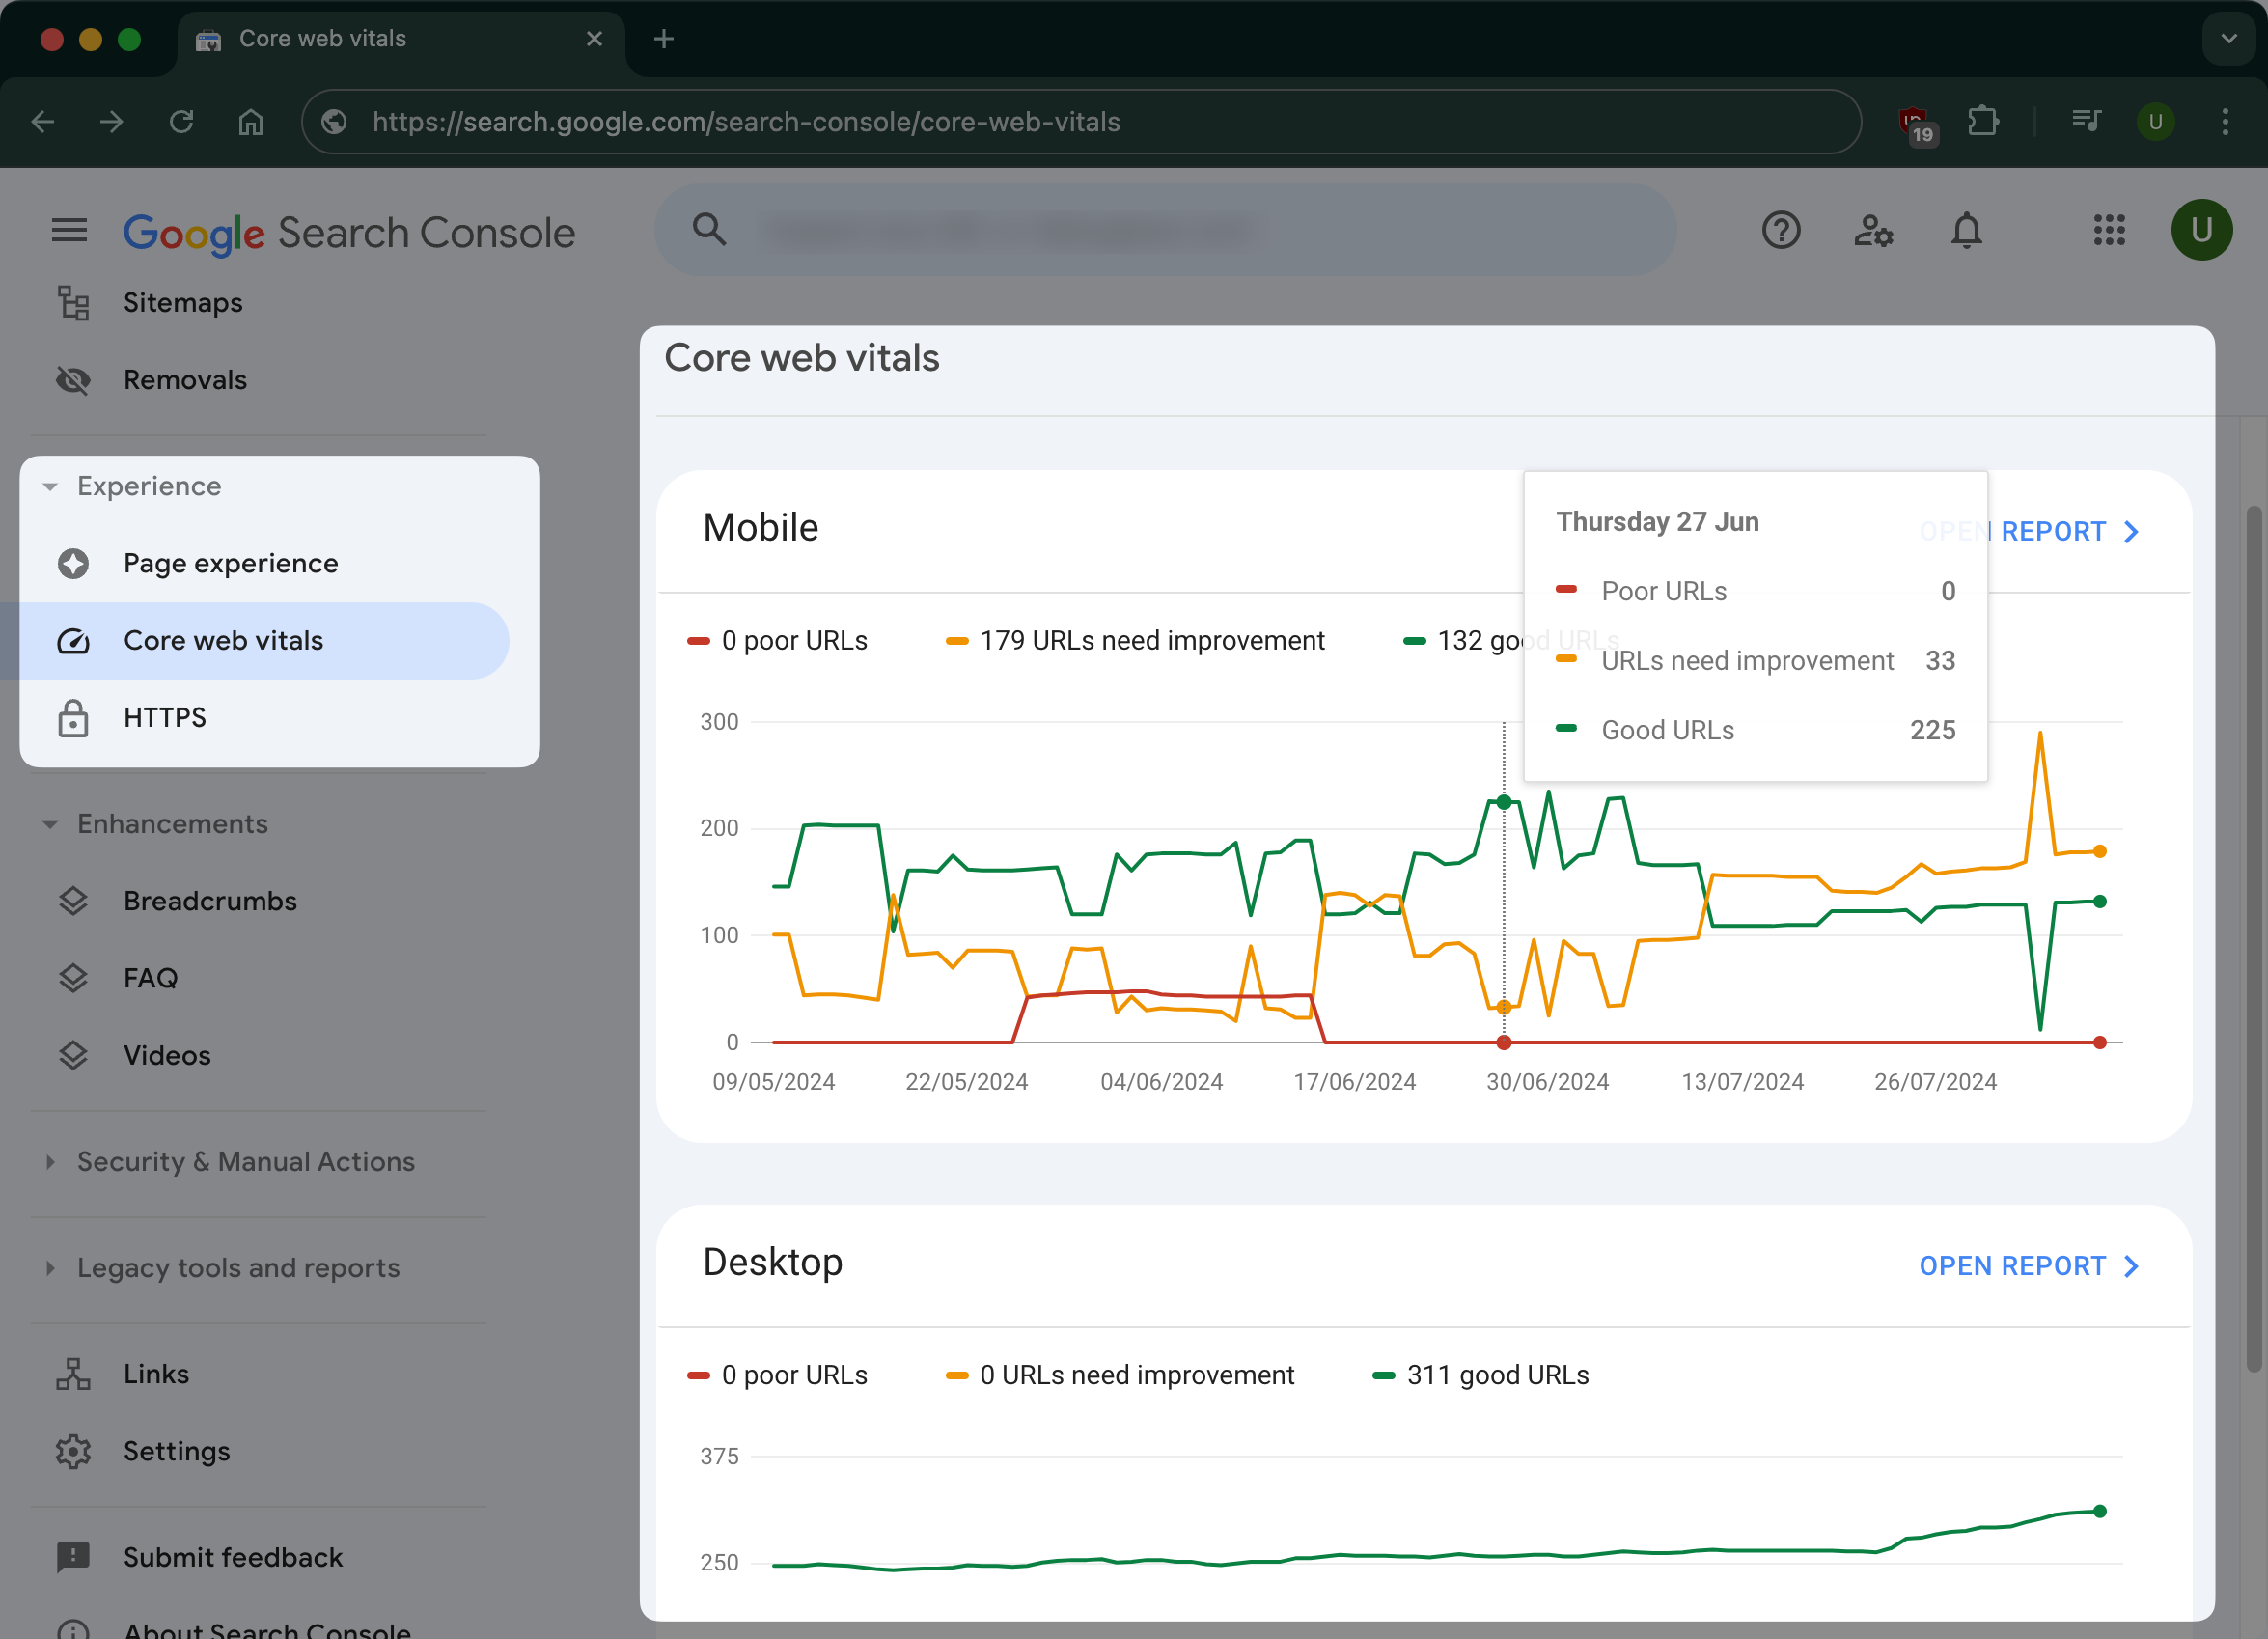
You can open up Mobile or Desktop report to see a breakdown of the Core Web Vitals metrics for your website, grouped by "Good", "Needs Improvement", and "Poor".
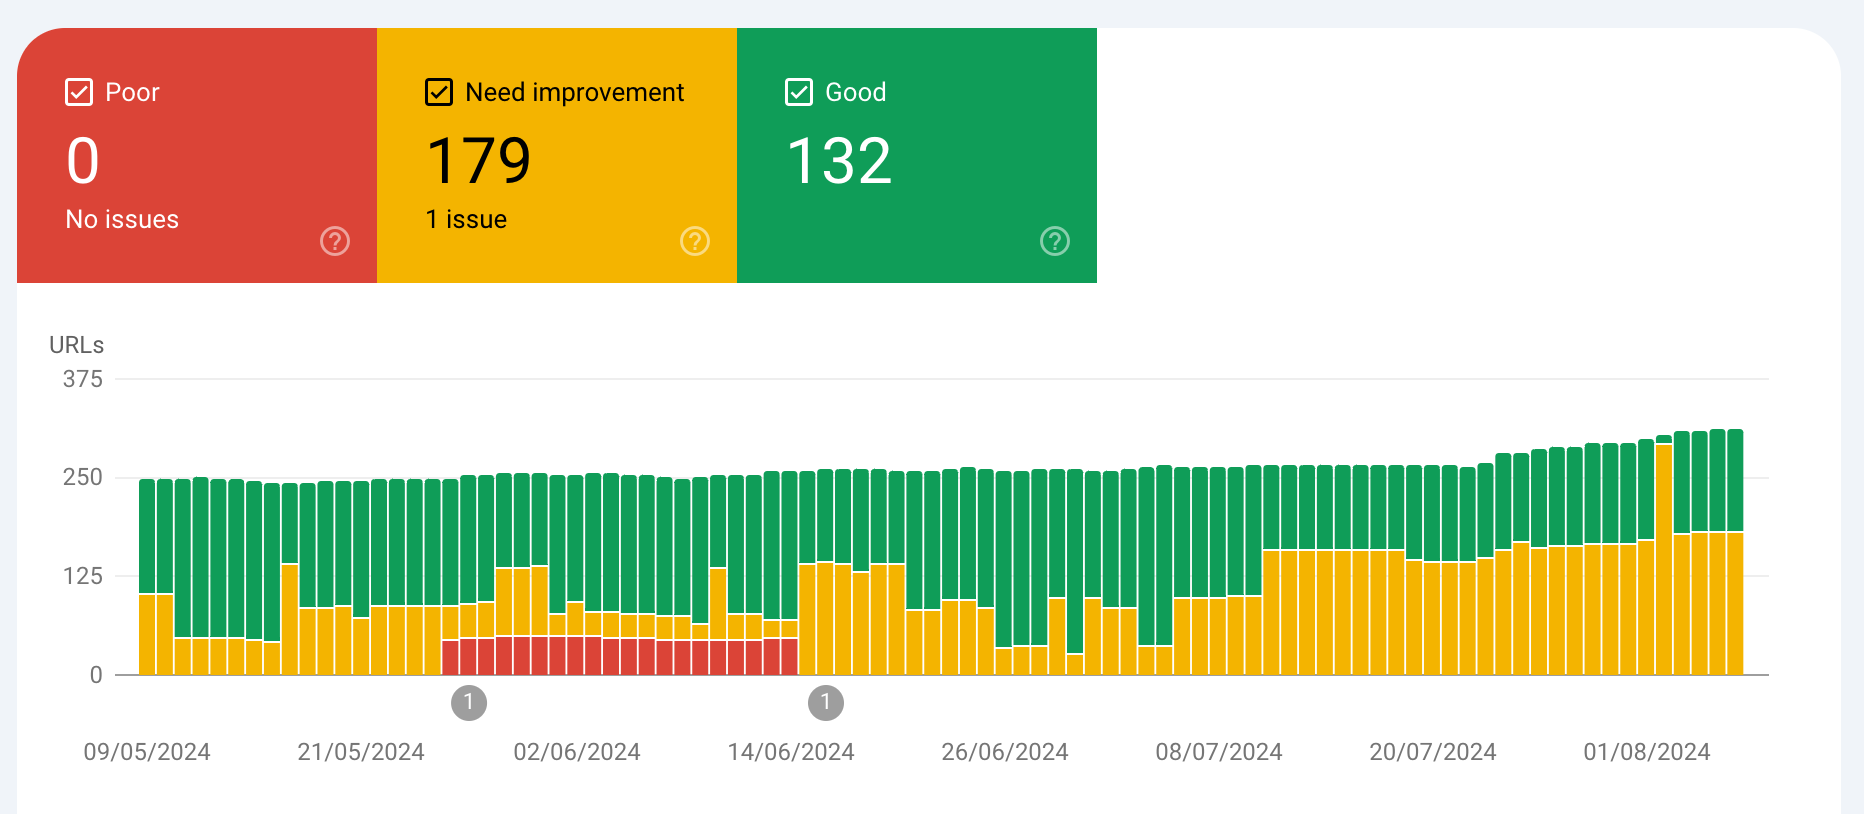
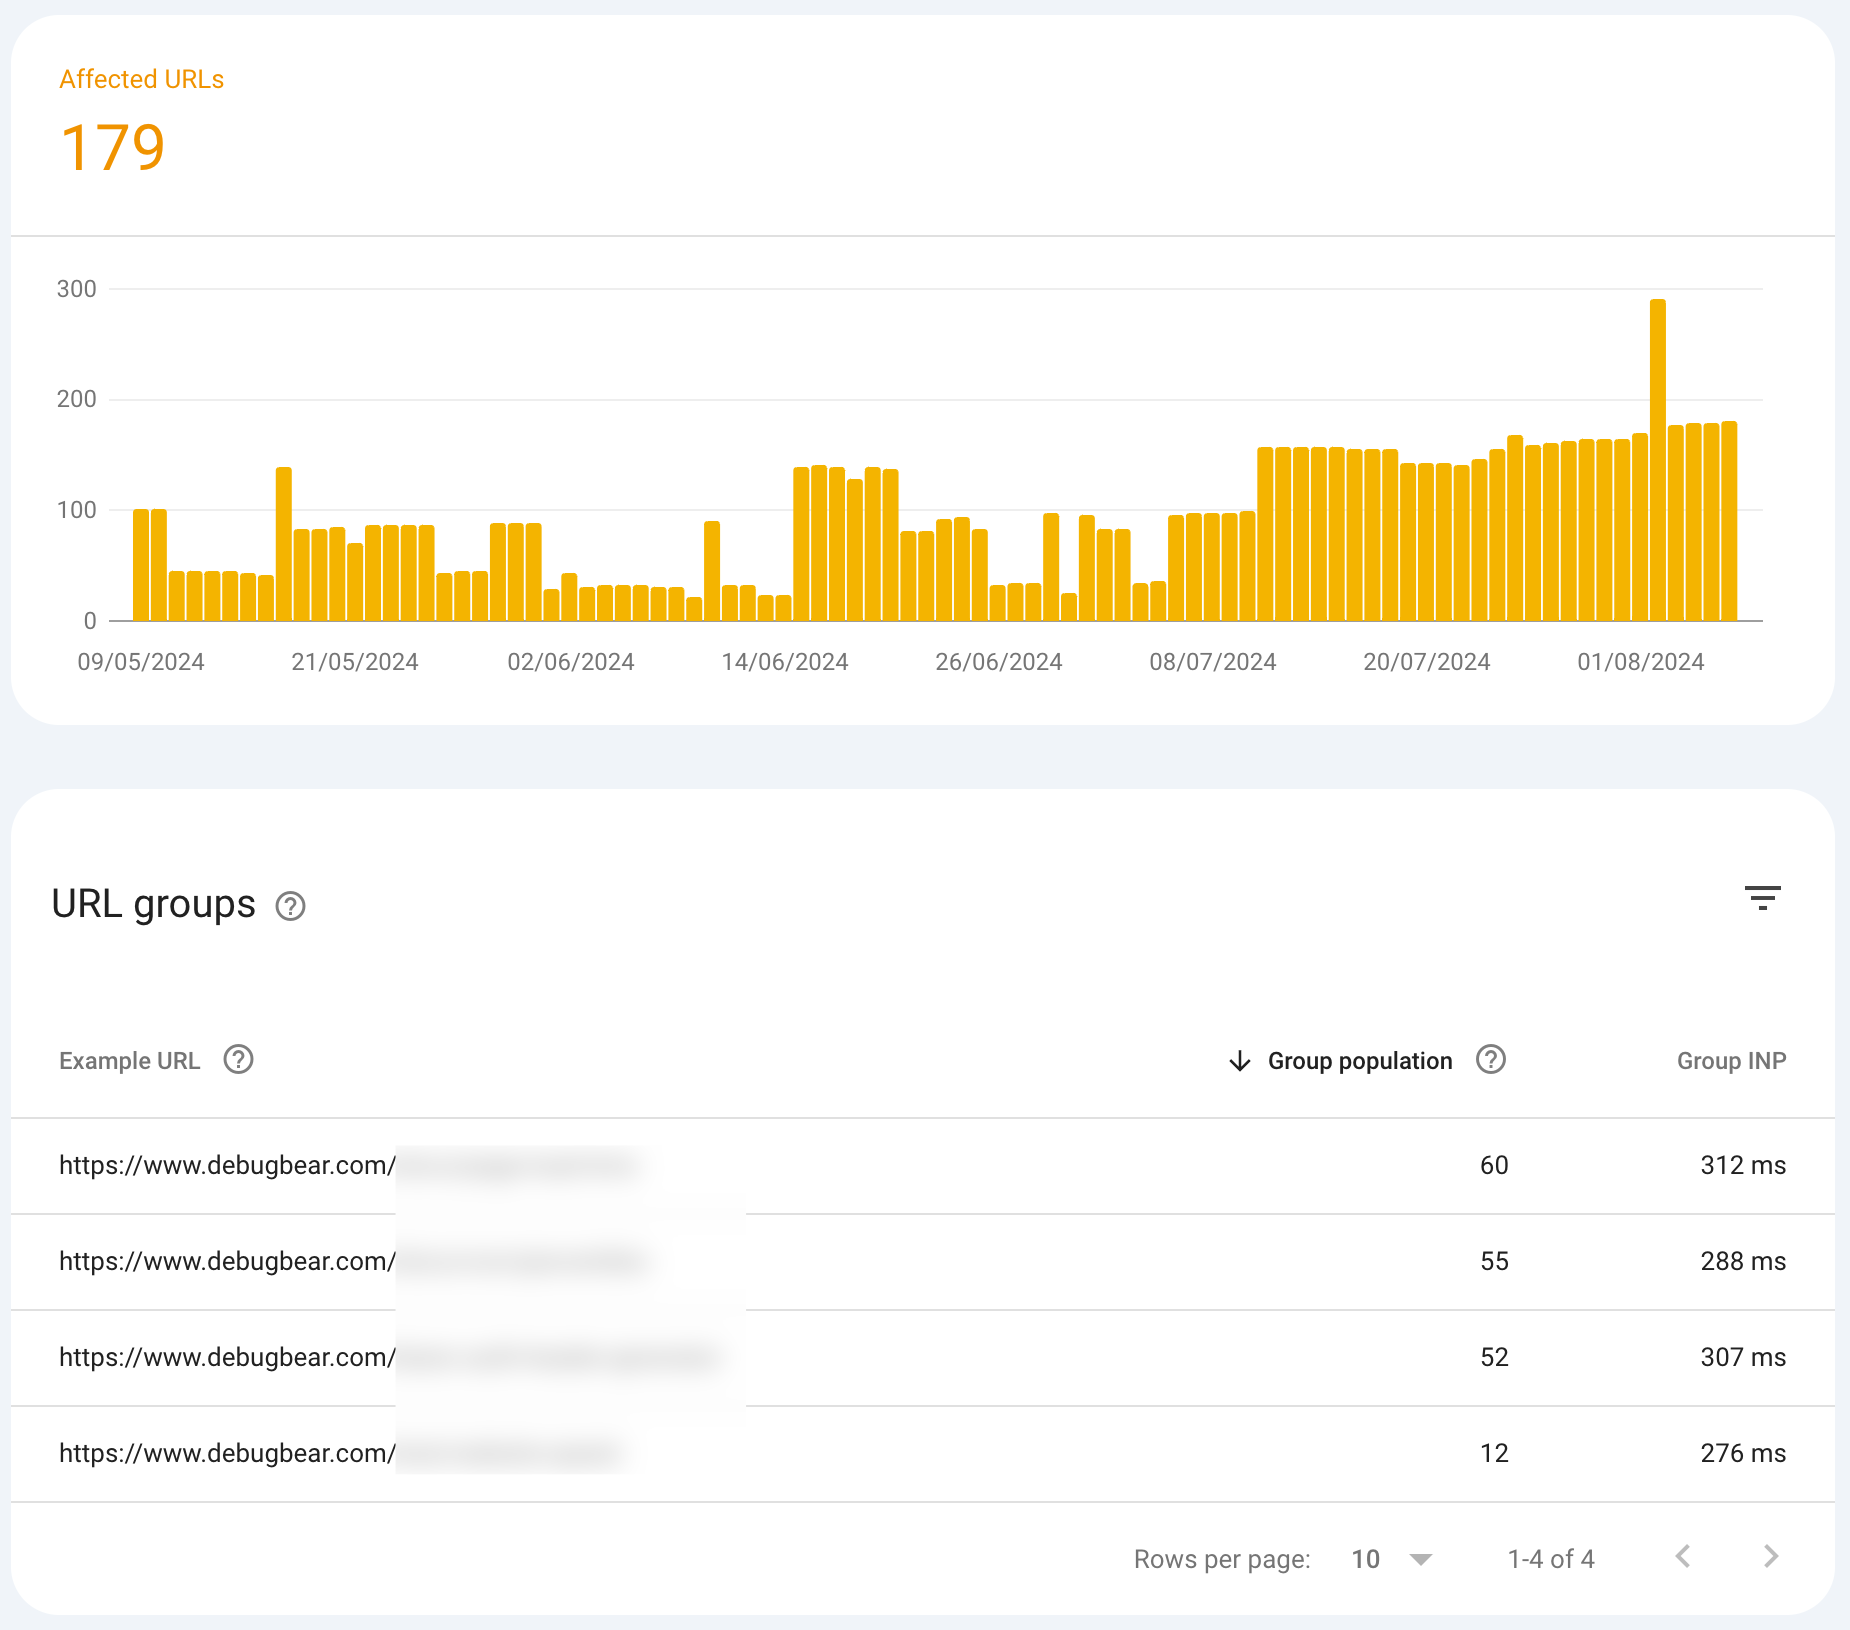
You can click on the issue that Google Search Console identified to see what page(s) the issue occurred on.
Test Core Web Vitals in Chrome DevTools
At some point in your performance debugging journey, you'll need to use browser DevTools and test and fix performance issues pertaining to Core Web Vitals.
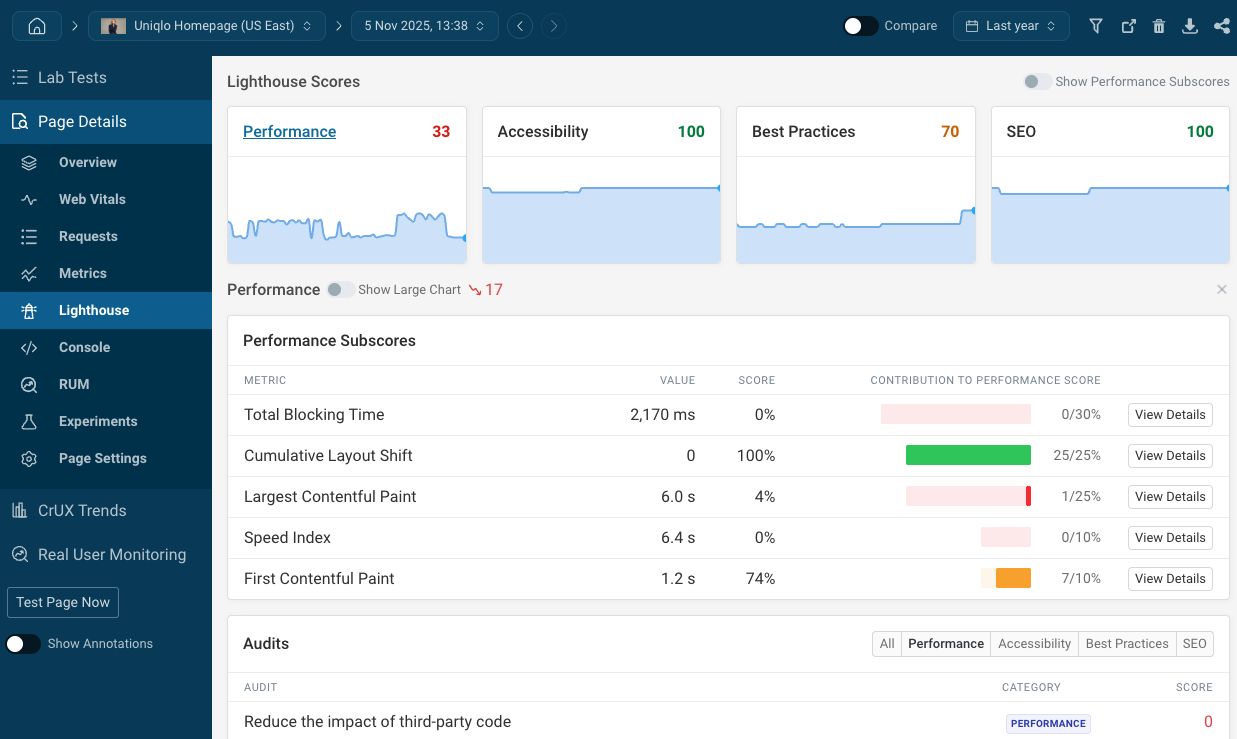
The Lighthouse Panel in DevTools offers a quick overview of your Core Web Vitals metrics.
-
Open Chrome DevTools (Ctrl + Shift + I on Windows, Cmd + Option + I on Mac) and navigate to the Lighthouse panel.
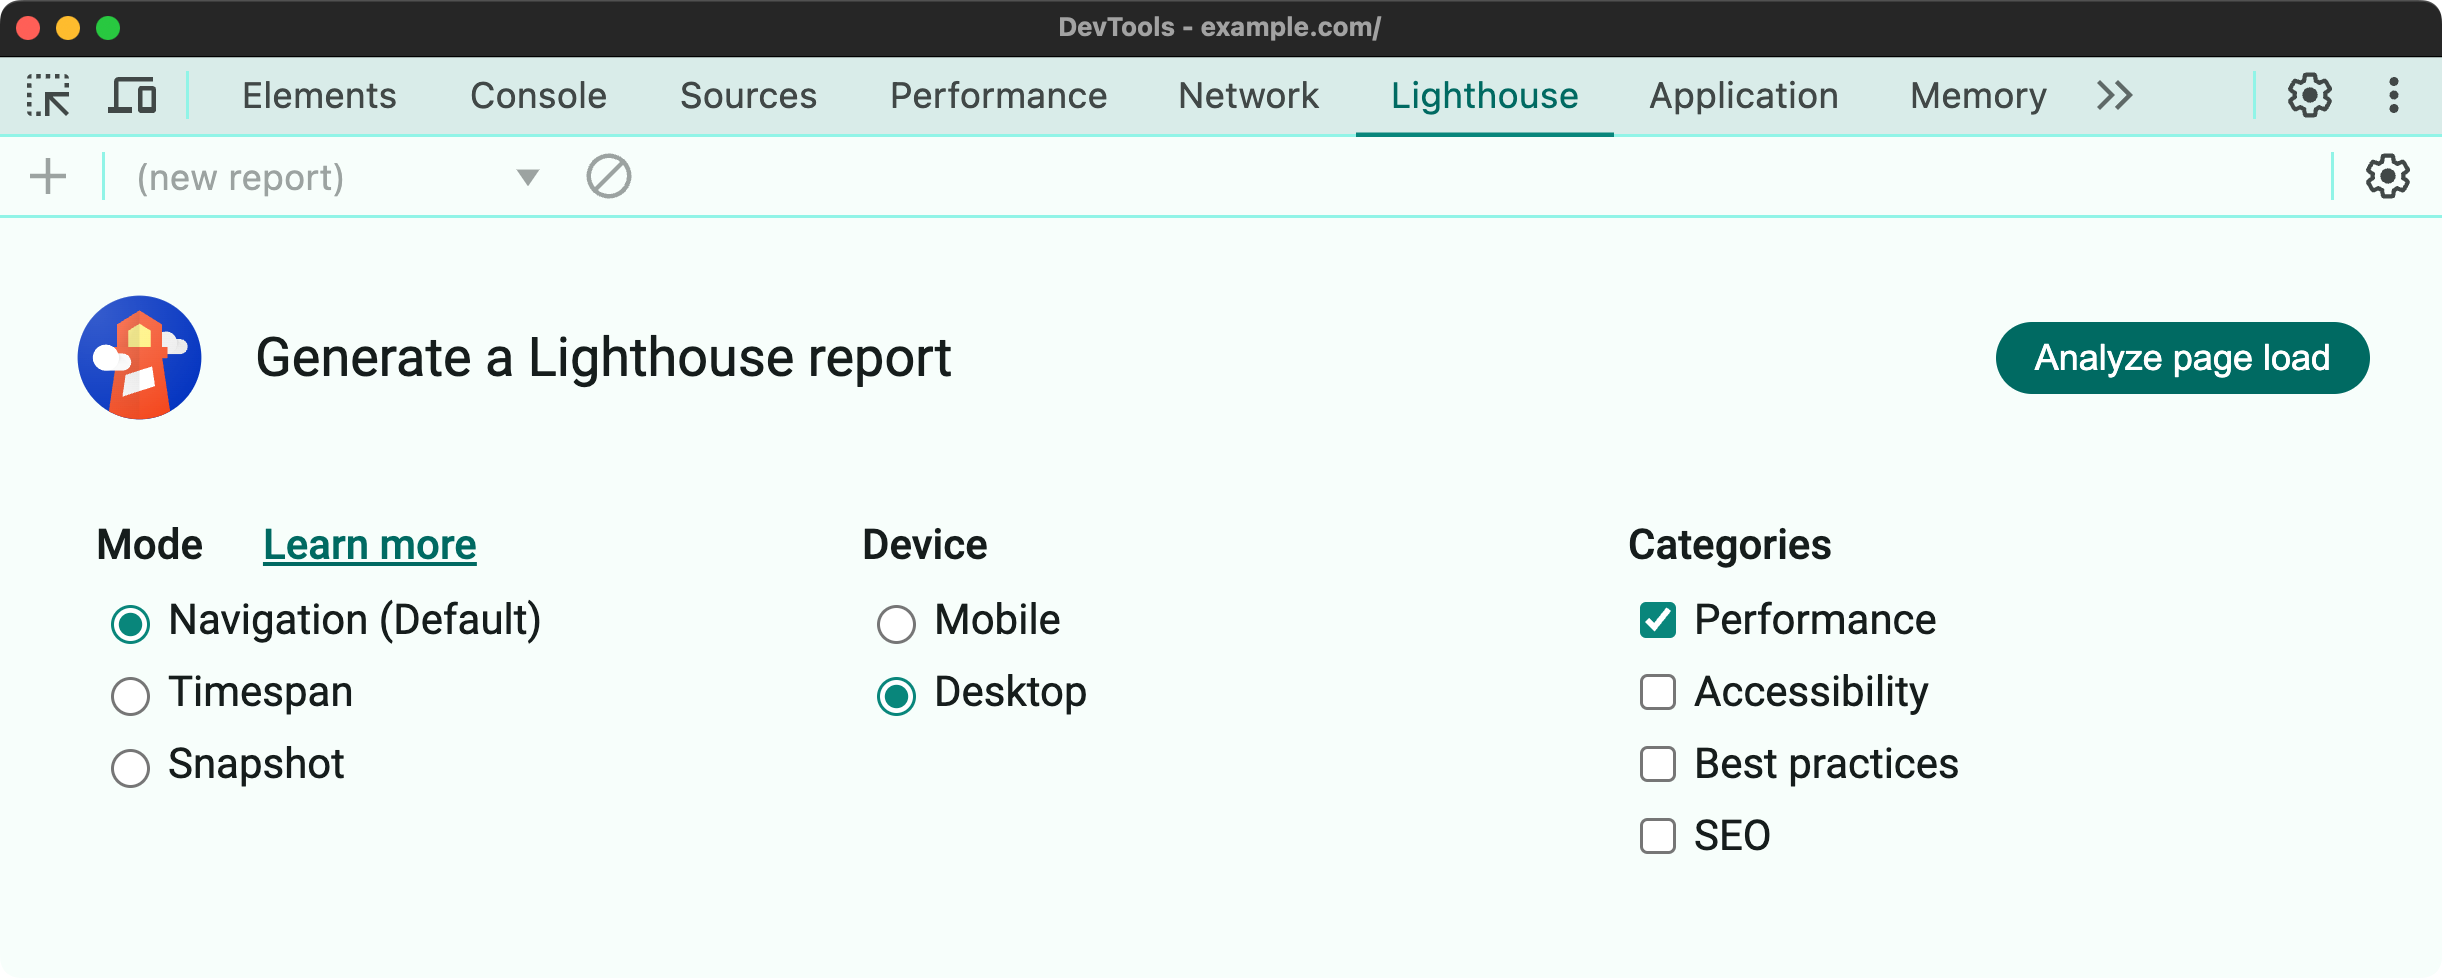
-
You only need to use the Performance category to test Core Web Vitals. Click the Analyze page load button to start the test.
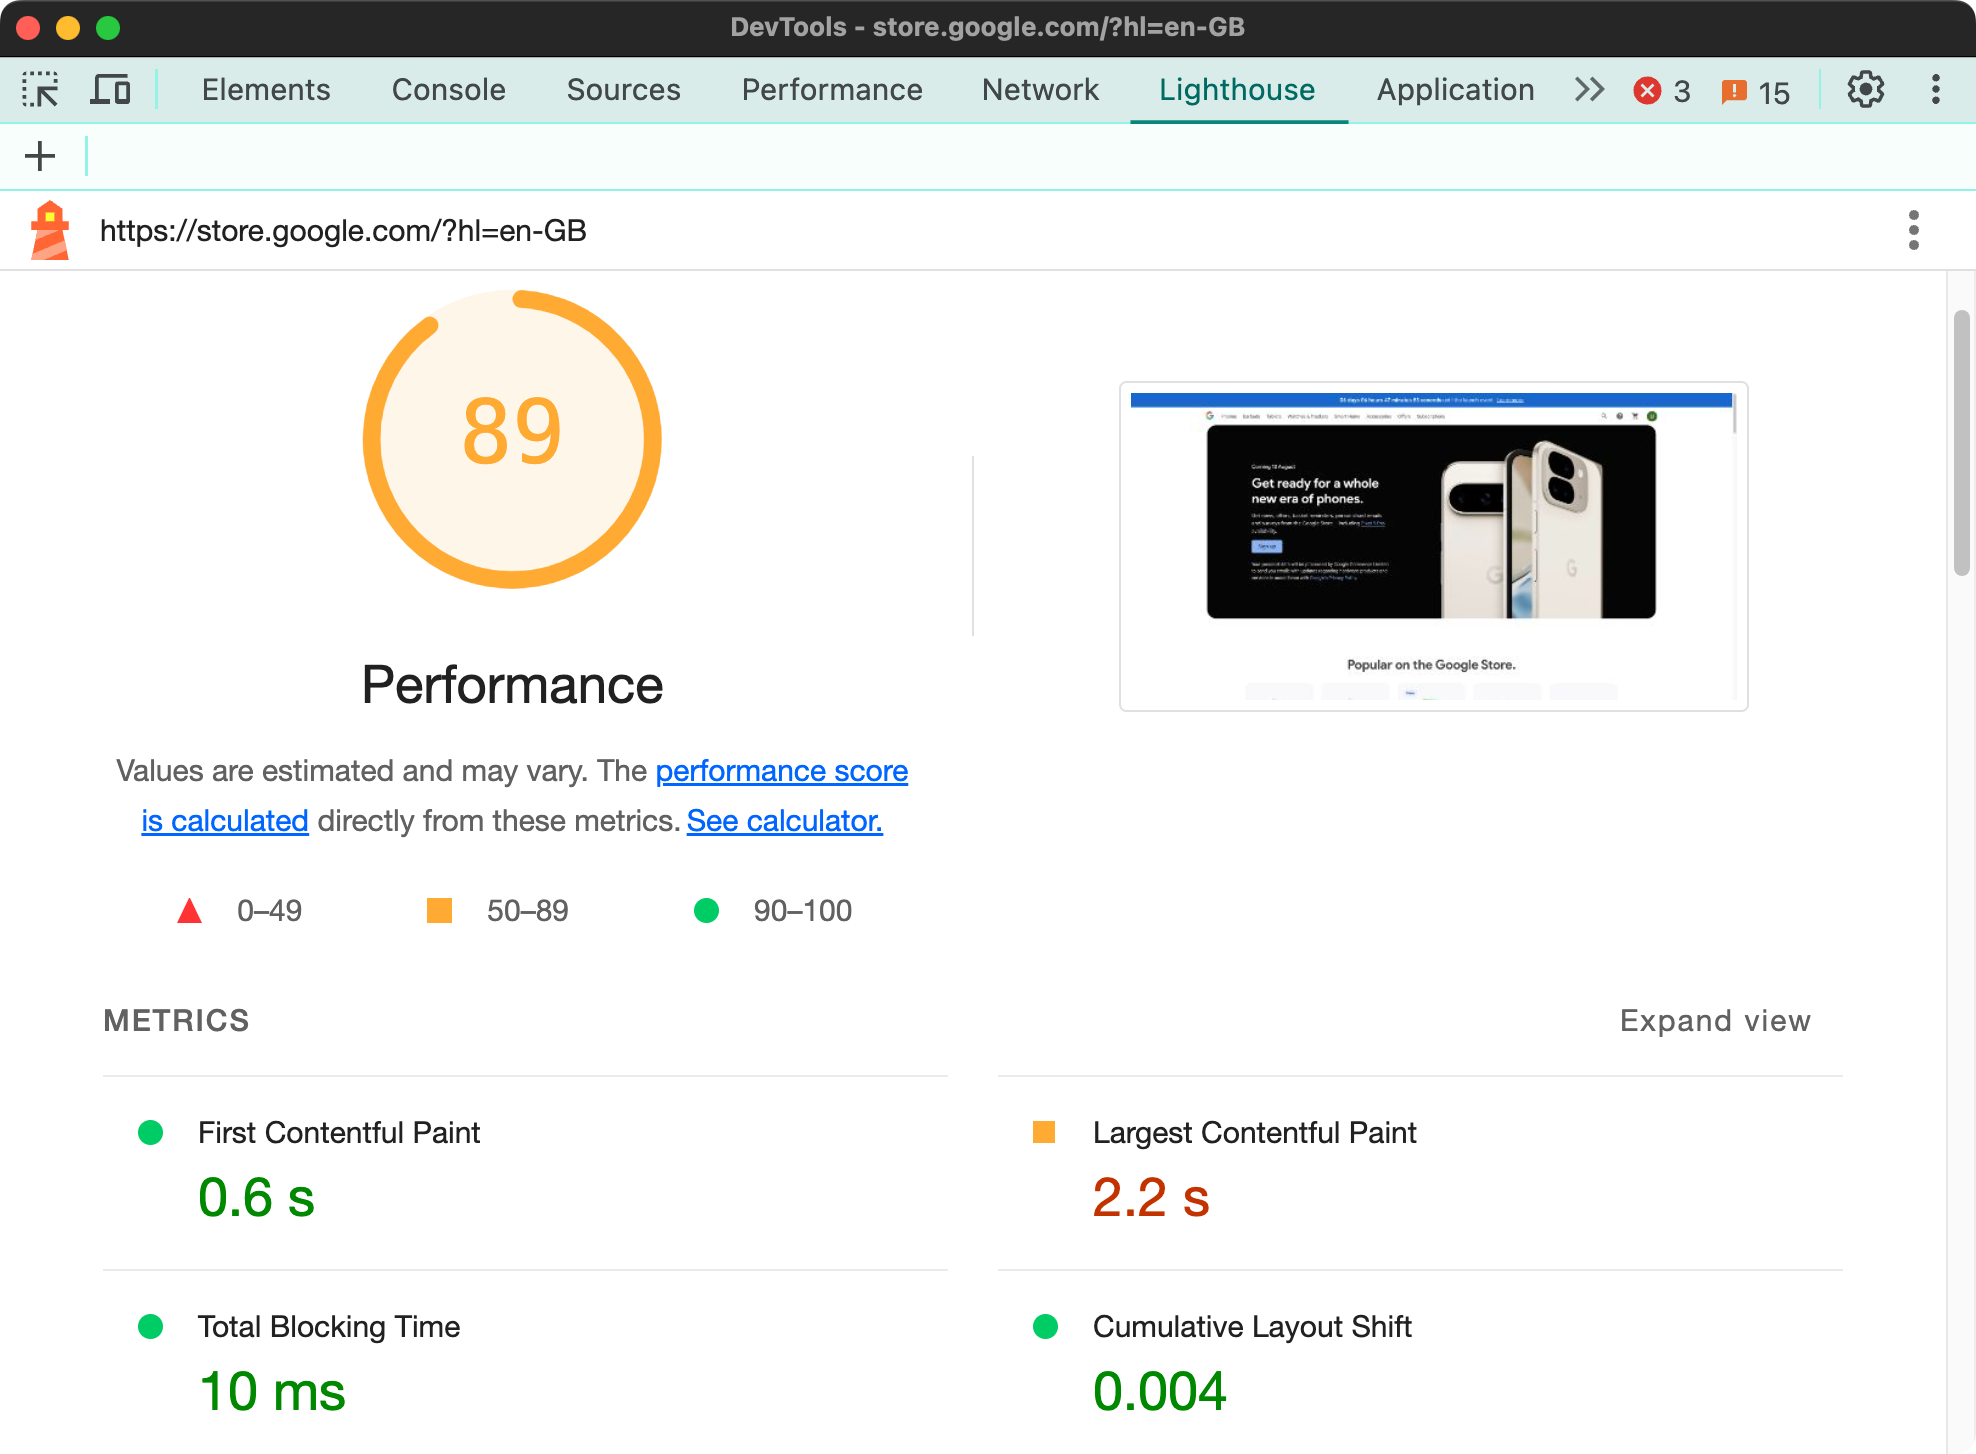
The Lighthouse report:
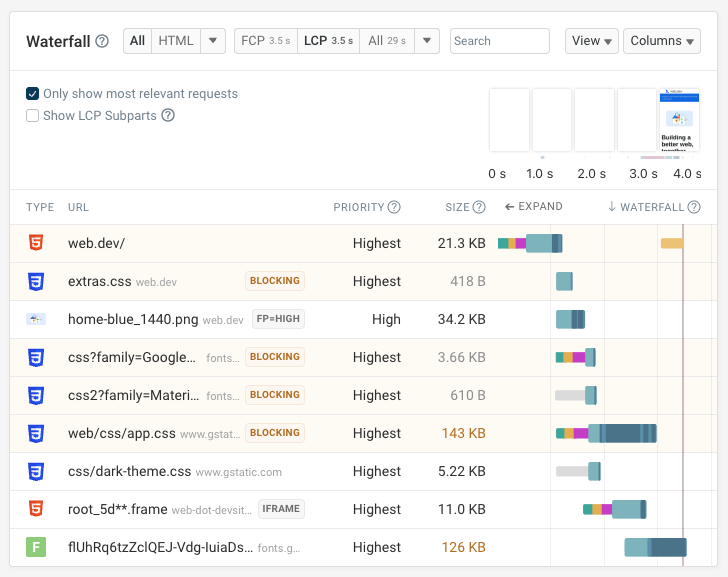
While the Lighthouse panel in Chrome DevTools is useful, at some point, you'll need to drill down into the performance issues that are affecting your Core Web Vitals metrics. You can do this from the Performance Panel:
- With DevTools open, navigate to the Performance Panel.
- Use the shortcut
Ctrl + Shift + Eon Windows orCmd + Option + Eon Mac to start recording a performance profile - the page automatically reloads.
An example of a performance profile in Chrome DevTools. Match the numbers on the screenshot with the explanations below the image.
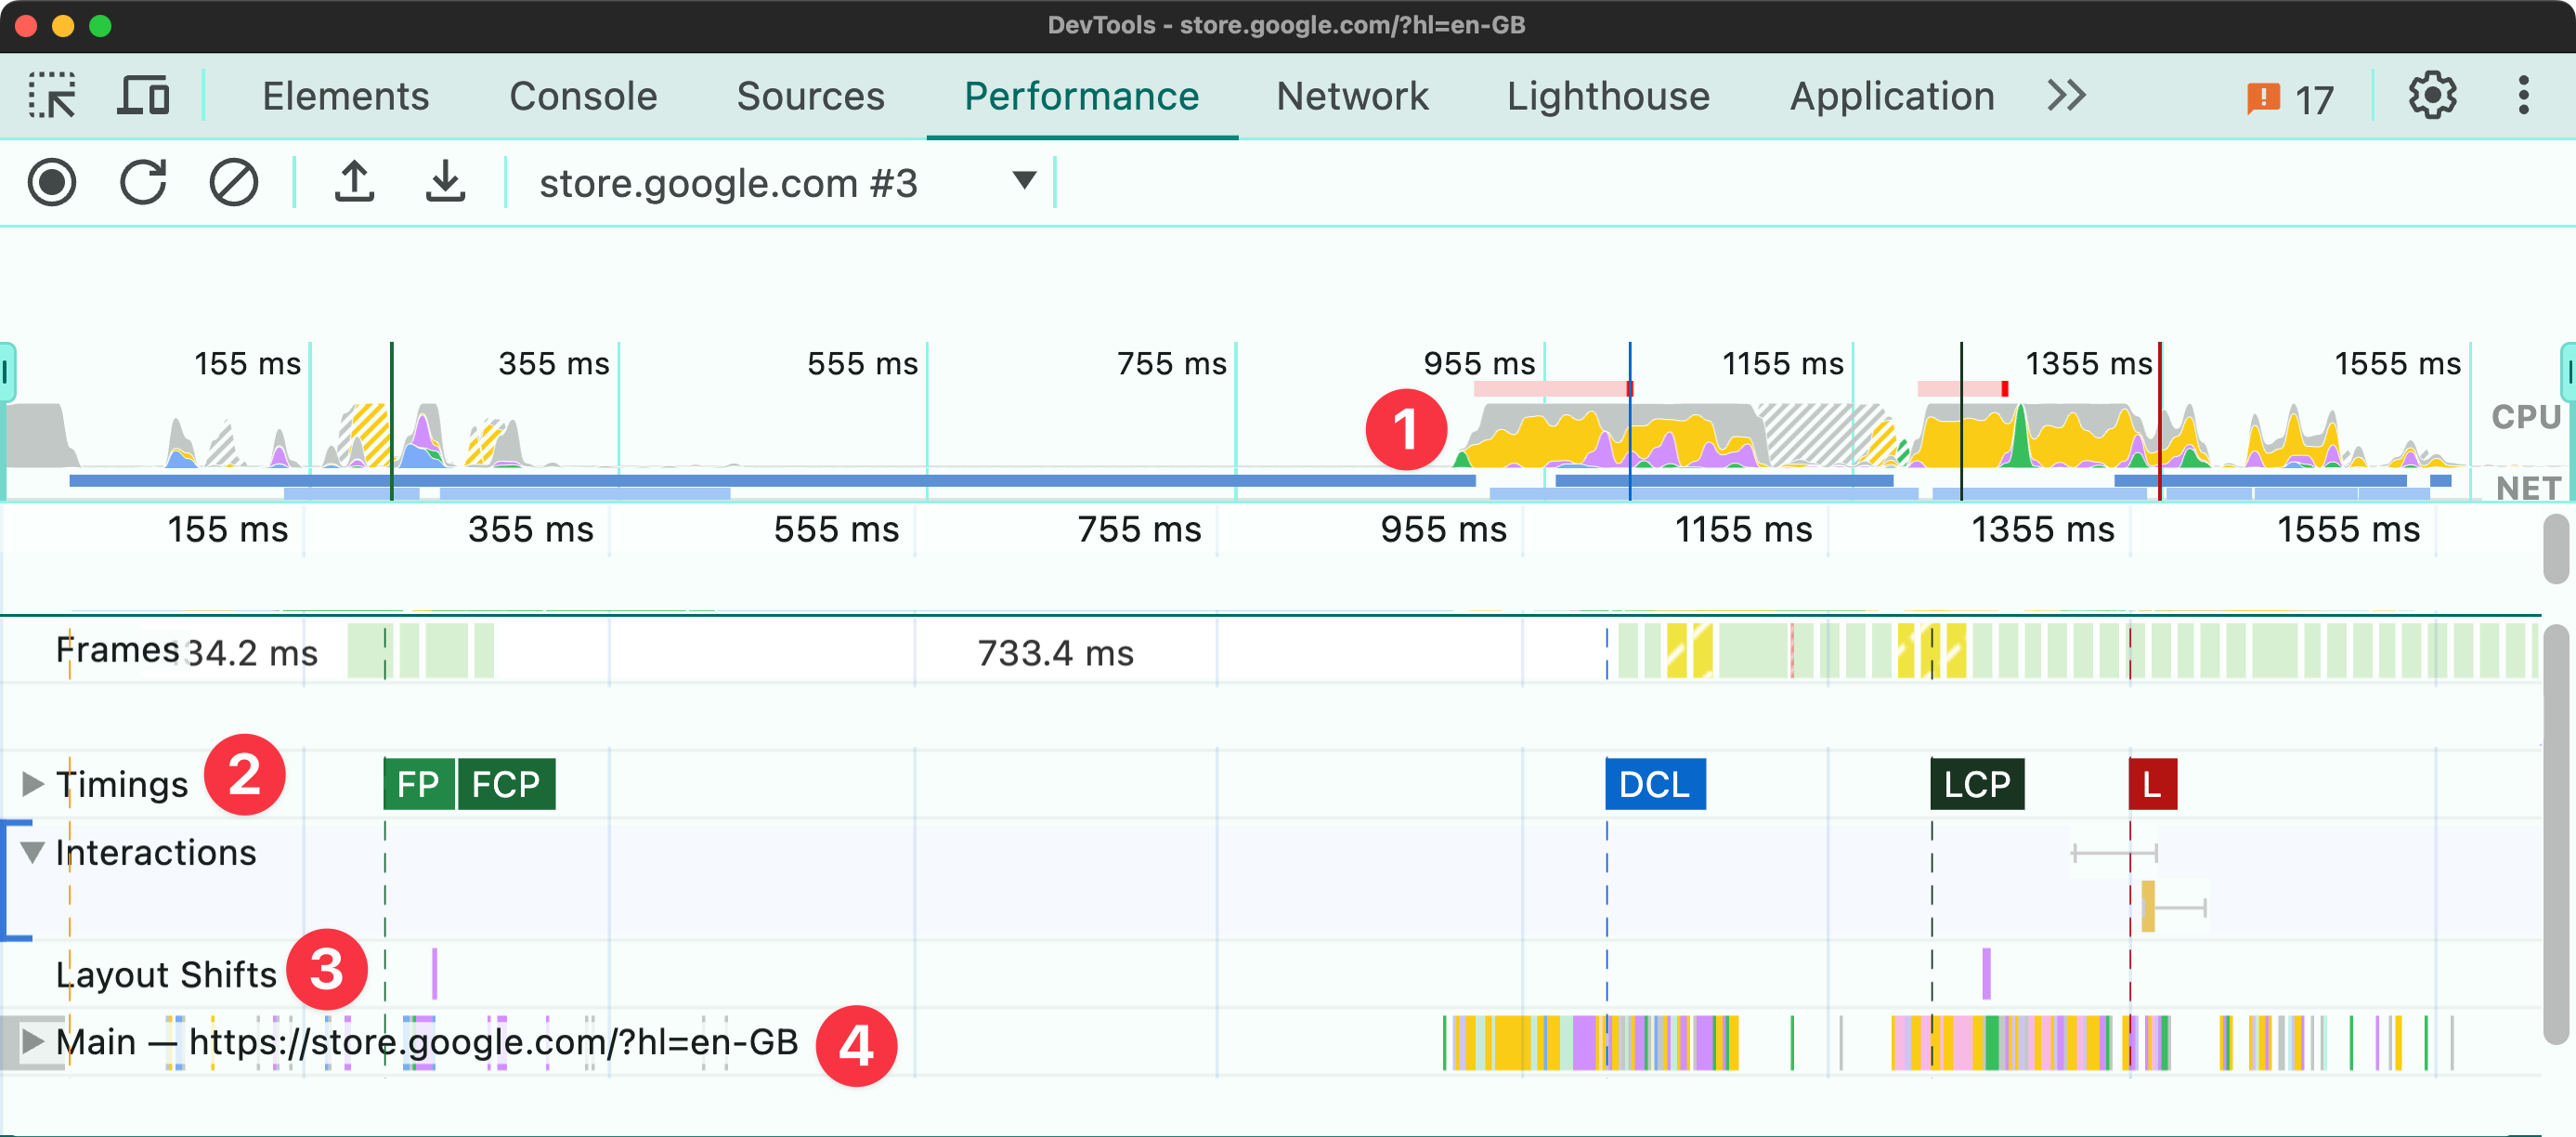
- This Overview shows how much activity is happening on the page. It's normal for there to be a lot of activity during page load, but you should aim to minimize it.
- The Timings track shows important rendering milestones like First Paint, First Contentful Paint, and Largest Contentful Paint.
- The Layout Shifts track shows Layout Shift events that happened during the recording.
- The Main track shows the main thread activity, including JavaScript execution and rendering. You can inspect heavy activity and see what's causing it.
While out of scope for this guide, the Interactions track shows user interactions and how long they took to process. This can help with optimizing the Interaction to Next Paint metric.
Understand the impact of Core Web Vitals
Poor user experience not only matters for your users but it's also one of Google's ranking signals. Learn how Core Web Vitals impact SEO performance and what data Google looks at.
How do Core Web Vitals impact SEO?
Google first started using Core Web Vitals as a ranking factor in June 2021. Initially this only affected mobile rankings, but in February 2022 the change was also rolled out to desktop searches.
Site owners who optimize the performance of their website will rank higher in Google.
The Core Web Vitals are part of the broader range of page experience signals Google uses, like being mobile-friendly and using a secure connection. These quality signals assess how good the user experience of your webpage is.
When do pages get an SEO boost due to Core Web Vitals?
You should see a gradual ranking boost as your metrics move toward the "Good" rating. Core Web Vitals are not a binary ranking factor!
Once all metrics are in the "Good" range, further improvements will no longer yield SEO benefits.
Even when making improvements within the "Poor" range, you could still see your pages rise in search result rankings if your competitors' pages are also slow.
What is a good Core Web Vitals score?
To get a "Good" rating from Google you need a Largest Contentful Paint under 2.5 seconds, an Interaction to Next Paint under 0.2 seconds, and a Cumulative Layout Shift below 0.1.
Google looks at the 75th percentile of experiences, meaning your ranking is determined by the slowest 25% of visitors. For example, to get a "Good" LCP rating the main page content must load within 2.5 seconds at least 75% of the time.
How does Google collect Core Web Vitals data?
Google collects metrics from real users on your website as part of the Chrome User Experience Report (CrUX). Data is collected from:
- Chrome users on desktop and Android
- Users who have opted into usage statistics reporting
- Users who are logged into their Google account
The page speed experienced by your actual users might be different from what you see in lab test results.
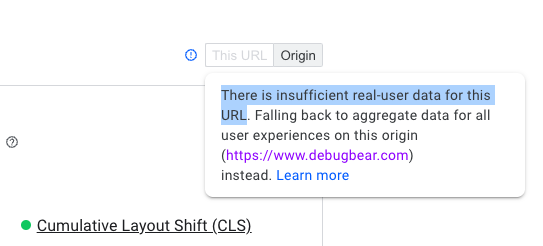
What does it mean when a page has insufficient real user data in PageSpeed Insights?
If a page doesn't get enough traffic, then Google doesn't have enough data to assess the real-world experience of your URL. For new websites, the entire domain may not have enough real user data yet.
Try testing a similar page with more visitors, or use the Lighthouse lab data Google also provides to optimize your website.
How to optimize Core Web Vitals
To improve the Core Web Vitals metrics, first run a page speed test to see which of the three metrics you need to optimize.
To optimize LCP, you'll need to review render-blocking resources on your website, for example critical CSS. Check if you can use modern image formats to reduce the download size of your page. If you use a library like React, server-side rendering will speed up your website.
To optimize CLS, check which page elements are moving around after the initial load. Often adding a CSS min-height to elements that change size helps reduce layout shift.
To optimize INP, use Chrome DevTools to collect a performance profile. Identify slow user interactions and optimize slow JavaScript code and other CPU tasks.
We've covered what you can do about a failed Core Web Vitals assessment in more depth in another article.
To learn more, read on or check out this video about how to optimize your Core Web Vitals.
Core Web Vitals debug data in the Chrome UX Report
We've already seen that Google CrUX data includes additional load time metrics like Time to First Byte and First Contentful Paint. But there are actually additional metrics that Google supports, even though not many tools surface them.
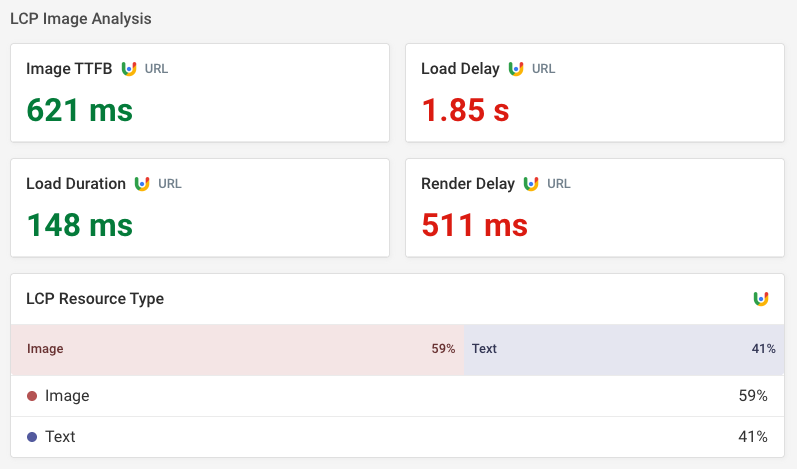
For example, if your LCP element is an image, you can get a breakdown of the LCP breakdown components. This tells you whether the image is loading slowly, isn't discovered quickly enough, or is not rendered immediately after loading.
You can also see what percentage of the time your LCP element is an image rather than text.
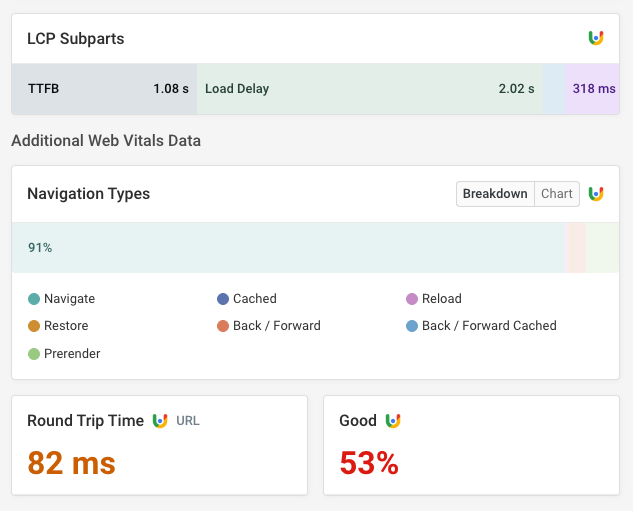
You can also learn more about your visitors.
The navigation types tell you how often users navigate backwards or forwards in the browser history, whether they reload the page, or if pages are prerendered (for example using speculation rules).
The network round trip time (RTT) tells you how fast the network connection of your visitors is. Your website speed depends on your website, your visitors, and your visitors' behavior on your site.
Continuously measure Core Web Vitals
DebugBear can test your website on a schedule, collect real user analytics, and keep track of Google's real-user metrics from the Chrome User Experience Report (CrUX).
You'll also get weekly reports plus instant alerts when there's a performance regression.
DebugBear provides comprehensive website performance monitoring to help you:
- Identify slow pages and visitor segments
- Diagnose Core Web Vitals issues
- Check the impact of optimizations and get alerted to regressions
In addition to measuring site performance, DebugBear also keeps track of the SEO and Accessibility scores generated by Google's Lighthouse tool.
Want to optimize the speed of your website? Start tracking Core Web Vitals today with a free 14-day trial.


Monitor Page Speed & Core Web Vitals
DebugBear monitoring includes:
- In-depth Page Speed Reports
- Automated Recommendations
- Real User Analytics Data