How To Fix The Largest Contentful Paint Element Audit
PageSpeed Insights and other web performance tools can detect when a website can't quickly display the Largest Contentful Paint element.
This article will explain what the Largest Contentful Paint element is, how to interpret the data in this performance audit, and what you can do to improve page speed issues related to the LCP element.
What is the Largest Contentful Paint element?
The Largest Contentful Paint (LCP) element is the biggest single UI element on a web page. There are different types of LCP element, for example images, text, or a video frame.
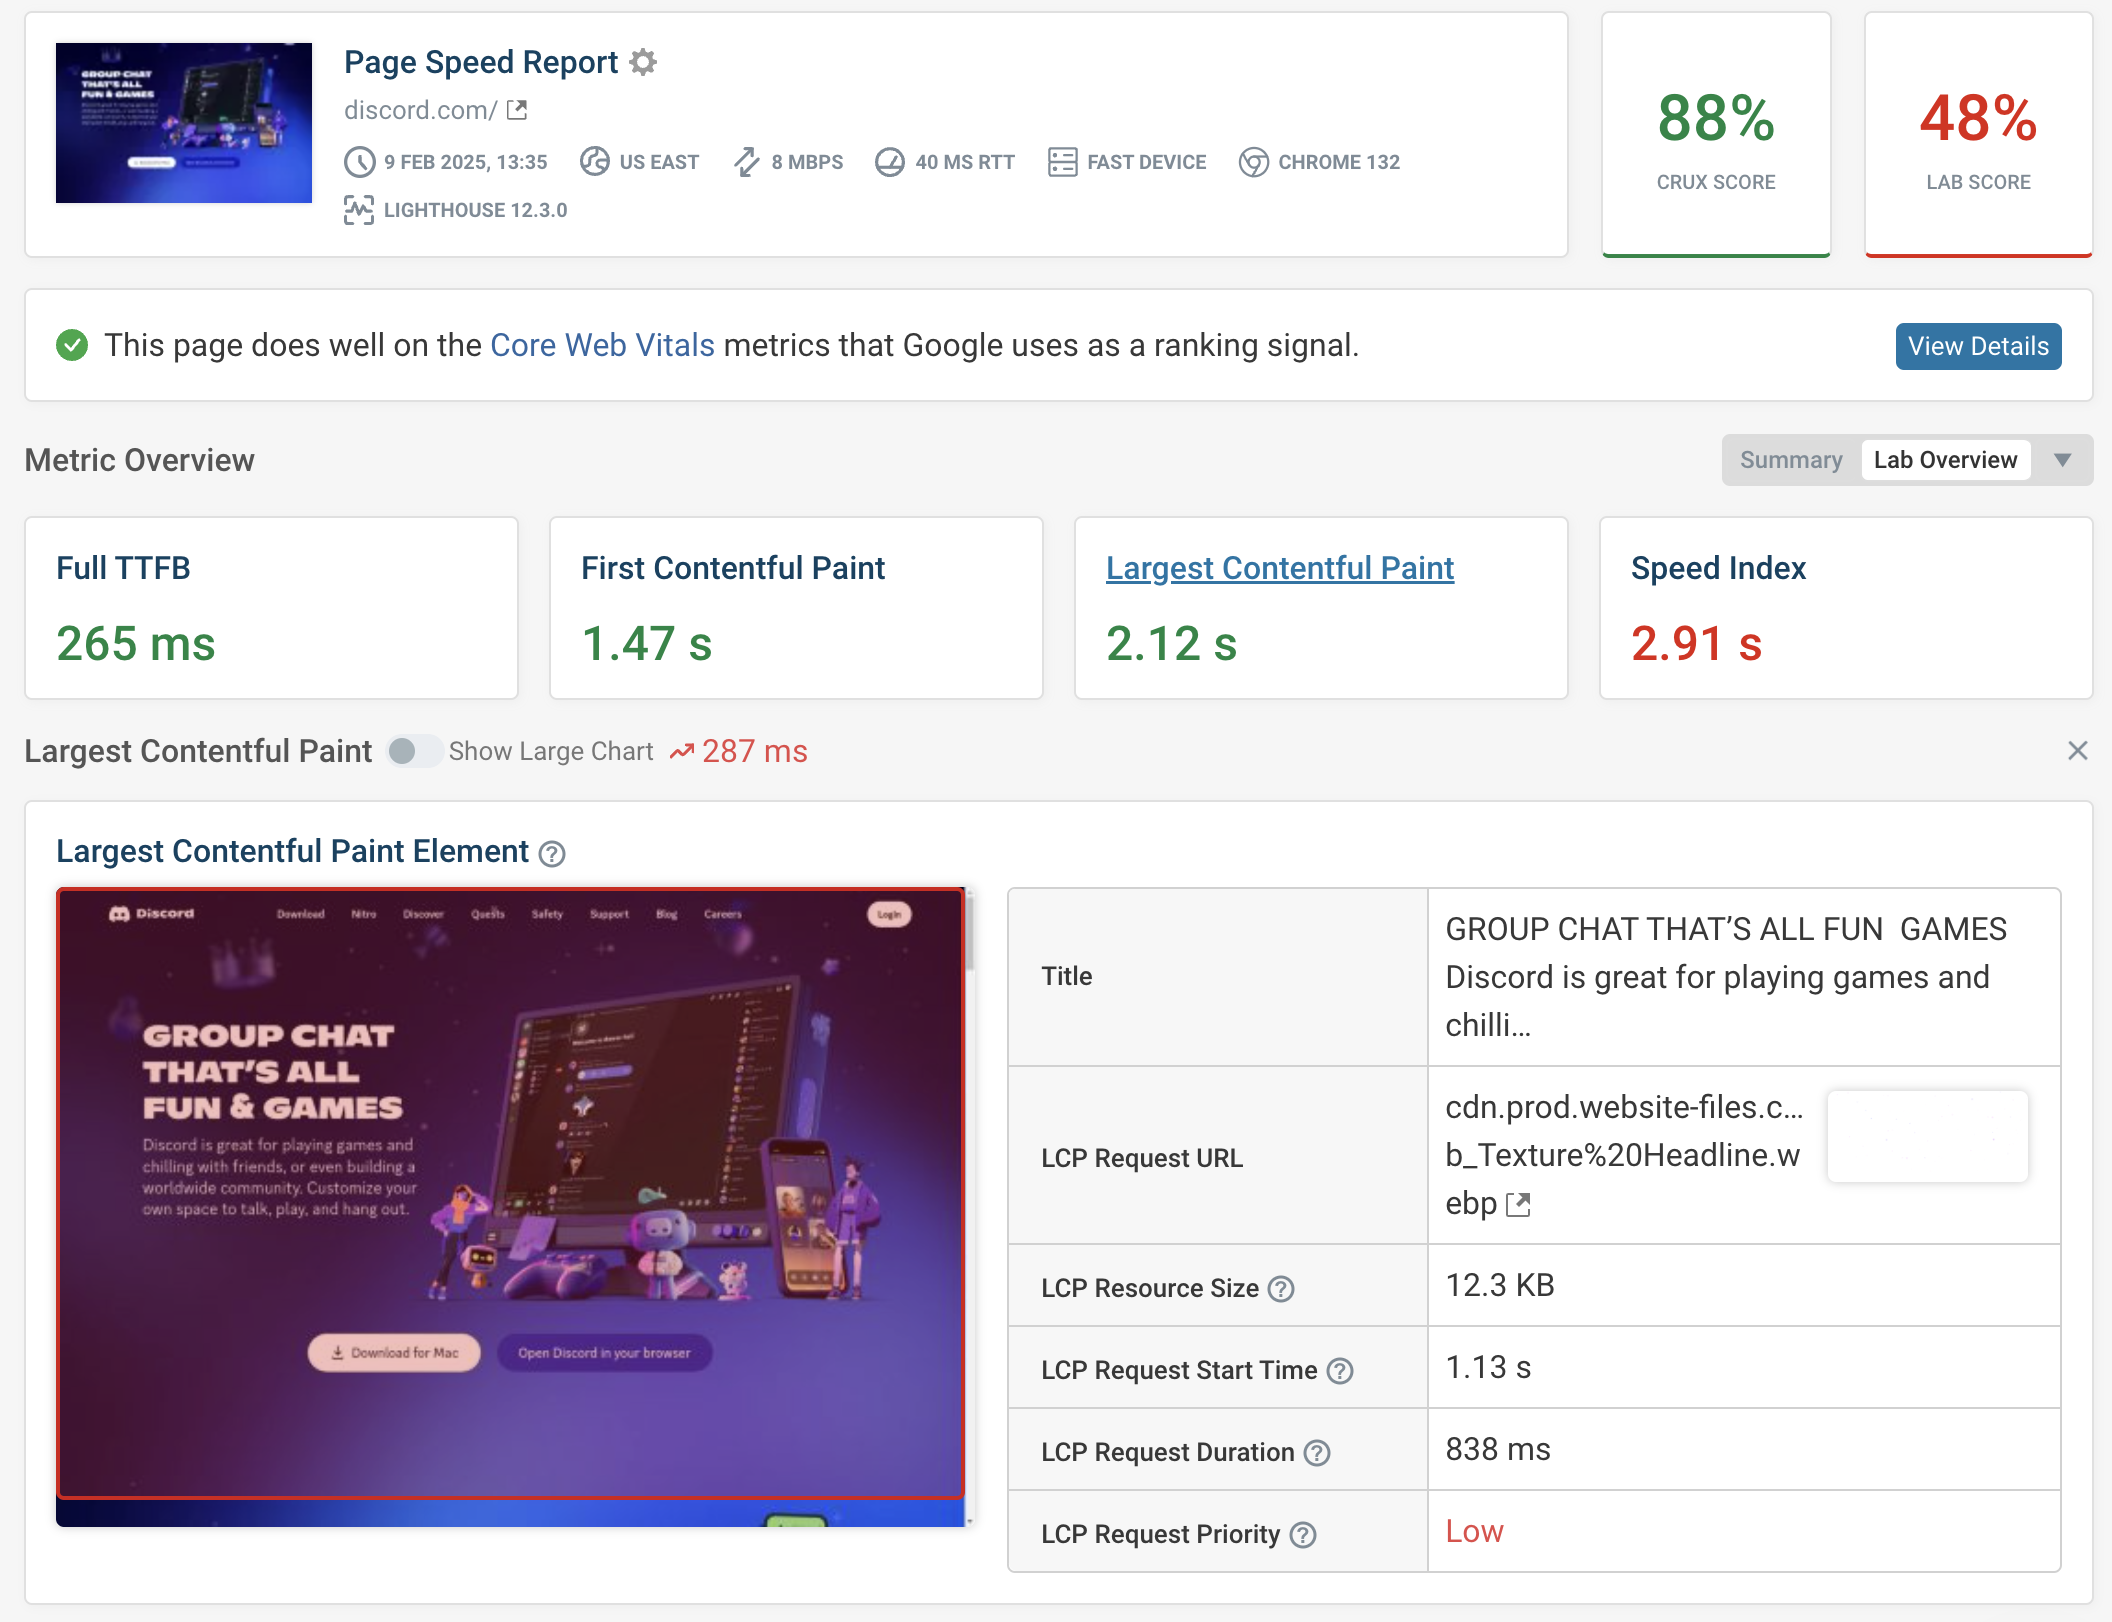
You can see an example from DebugBear's website speed test. In this case the LCP element is an image. It's larger than the other images on the page, or any individual paragraph of text on the page.
The LCP element is used to measure the Largest Contentful Paint metric. LCP is one way to measure page speed.
You can see a rendering filmstrip of a website below. The page starts out blank and then content gradually appears, thanks to progressive rendering.
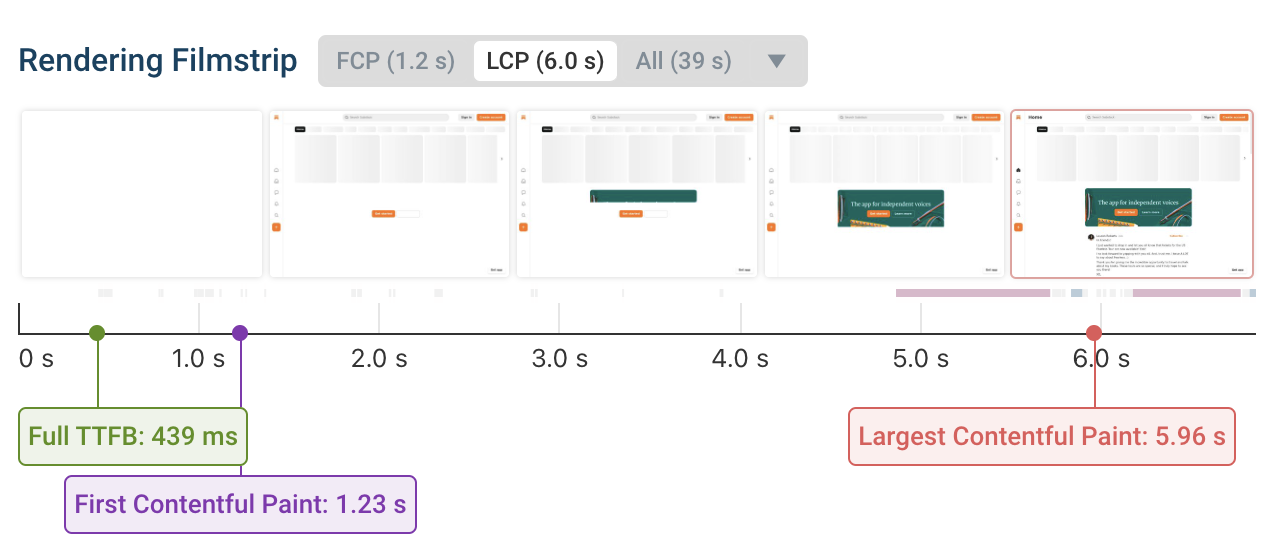
You can see that the LCP rendering milestone is marked after 5.96 seconds, when the Largest Contentful Paint element appears.
The Largest Contentful Paint is one of Google's three Core Web Vitals metrics that impact SEO rankings.
How to check the LCP element in Lighthouse and PageSpeed Insights
PageSpeed Insights and many other website performance tools are built on top of Google's Lighthouse project.
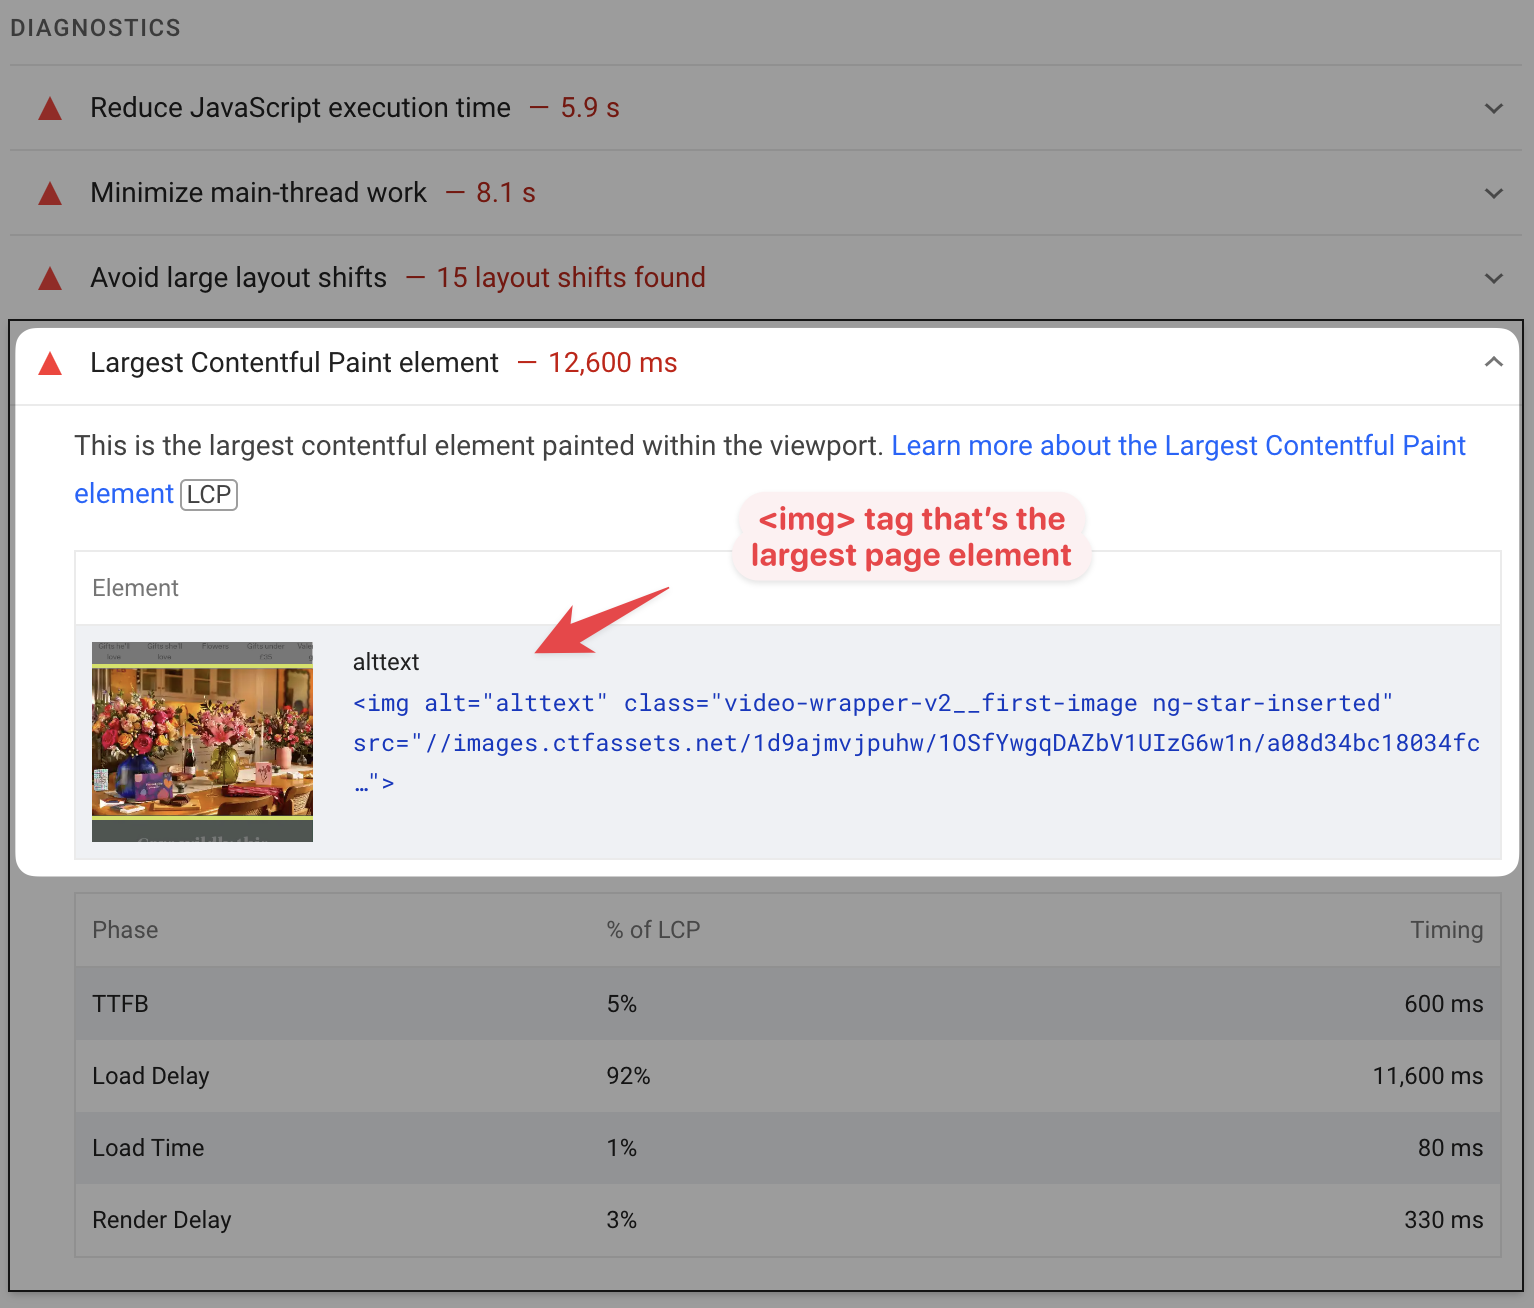
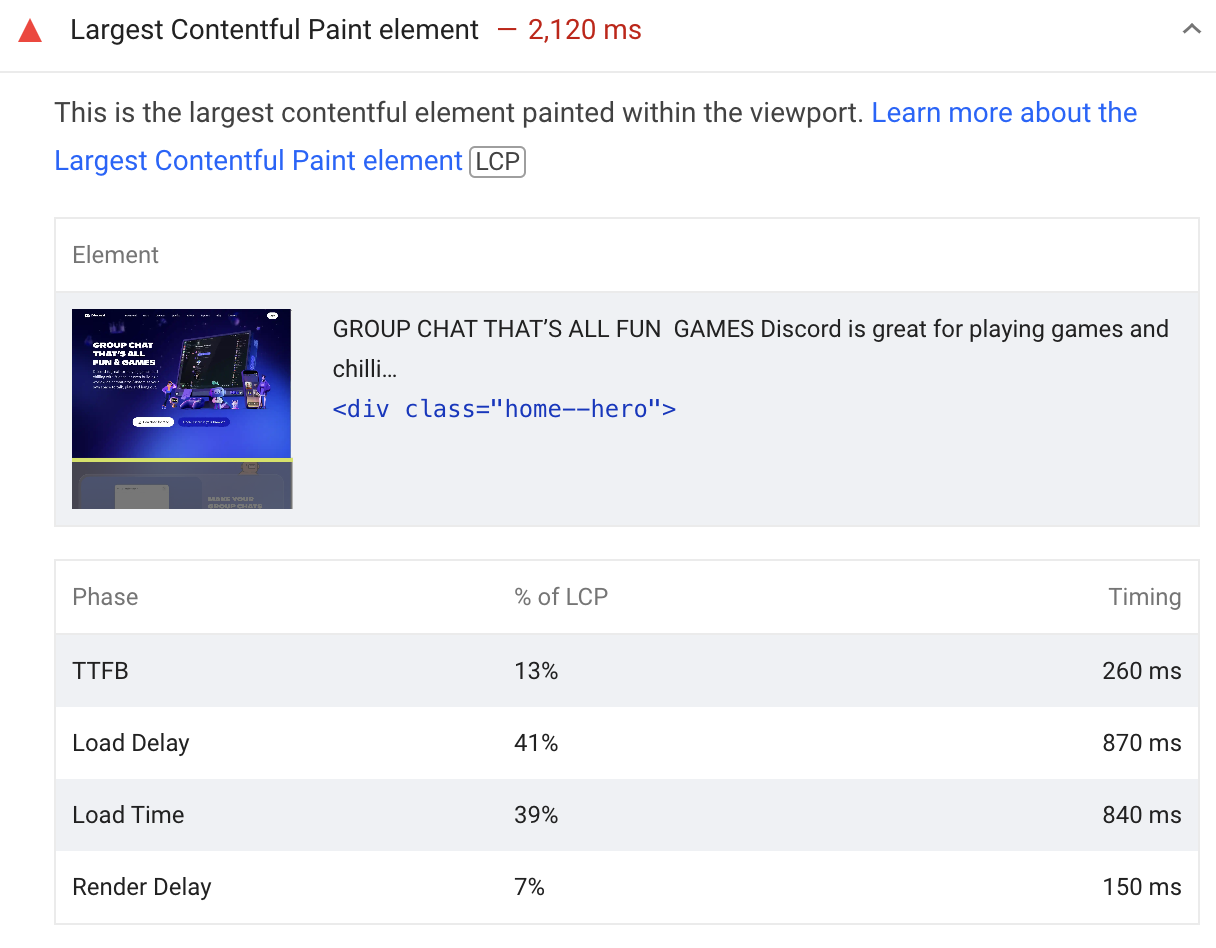
The Lighthouse performance section includes a "Largest Contentful Paint element" audit that shows you what the largest page element is. It includes:
- A screenshot showing the page element
- The element text content or
alttext for images - The HTML code for the element
Click on the element screenshot to expand it and see more context!
How to check the Largest Contentful Paint element in DebugBear
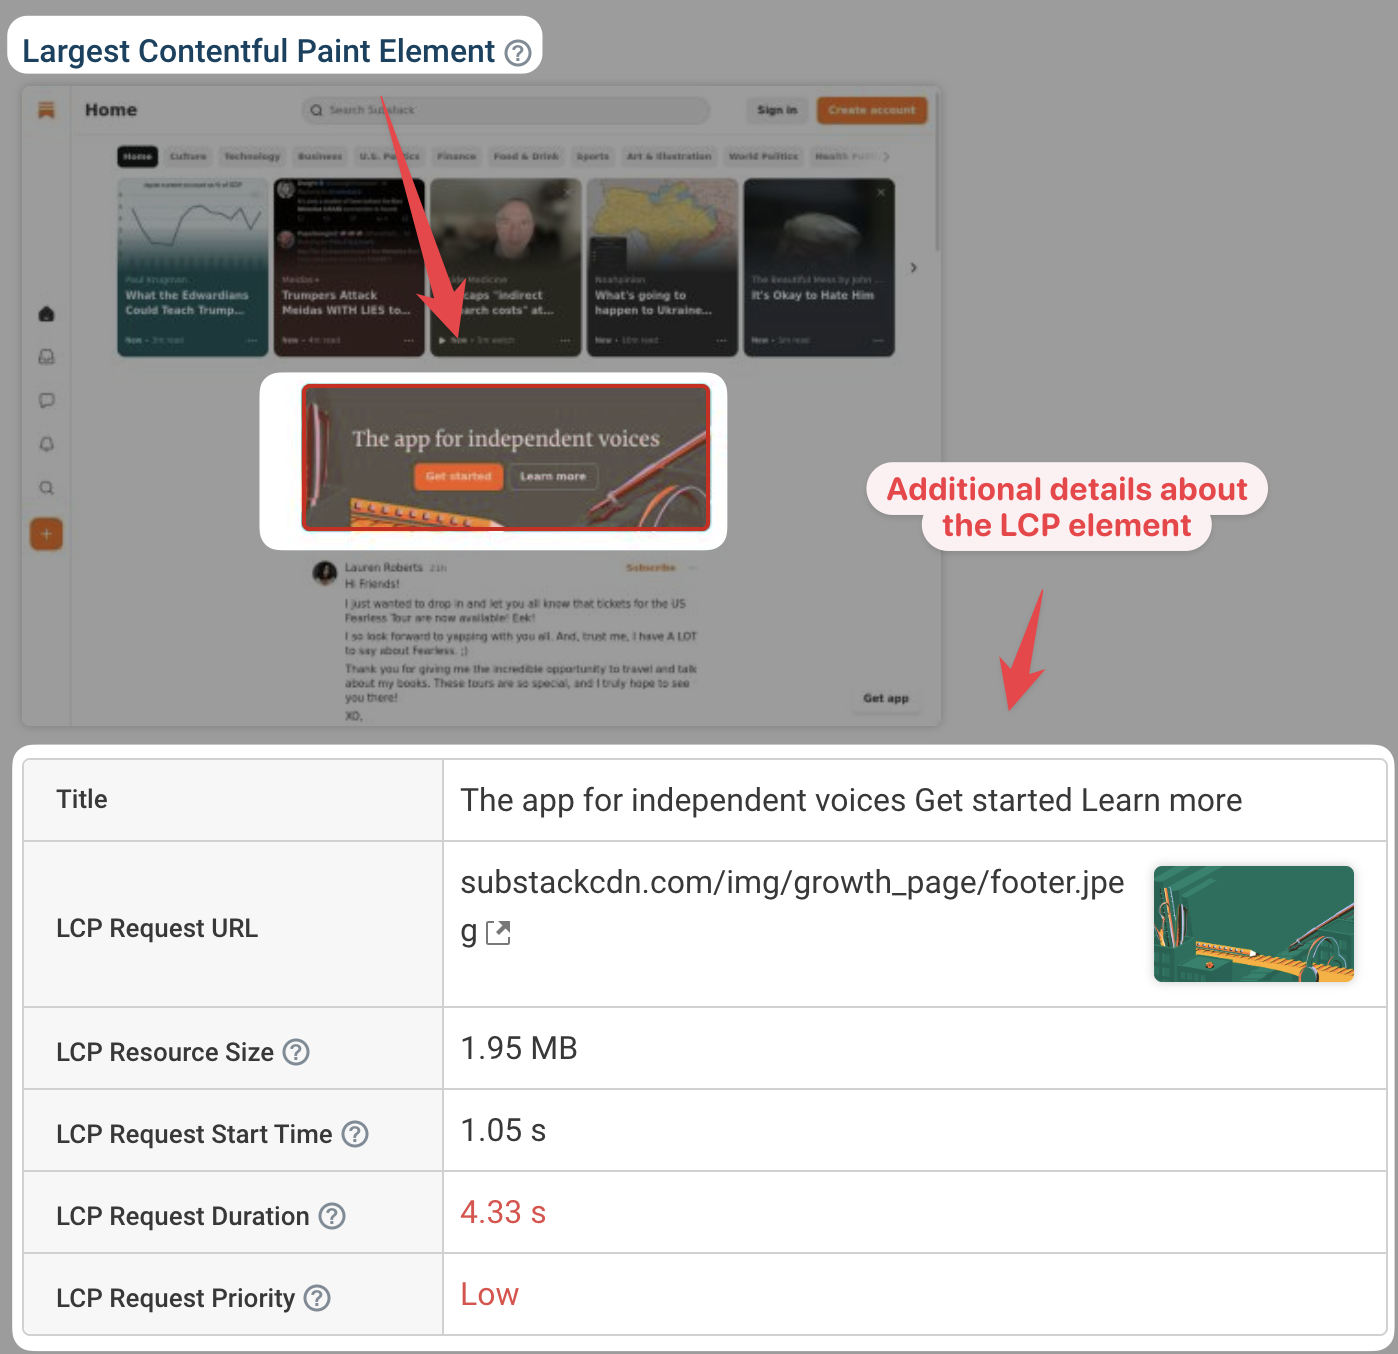
When testing your website with DebugBear you can view the LCP element by clicking on the Largest Contentful Paint metric title in your test result.
You'll also see additional data in the metric details to help you debug how long it takes to display the LCP element content.
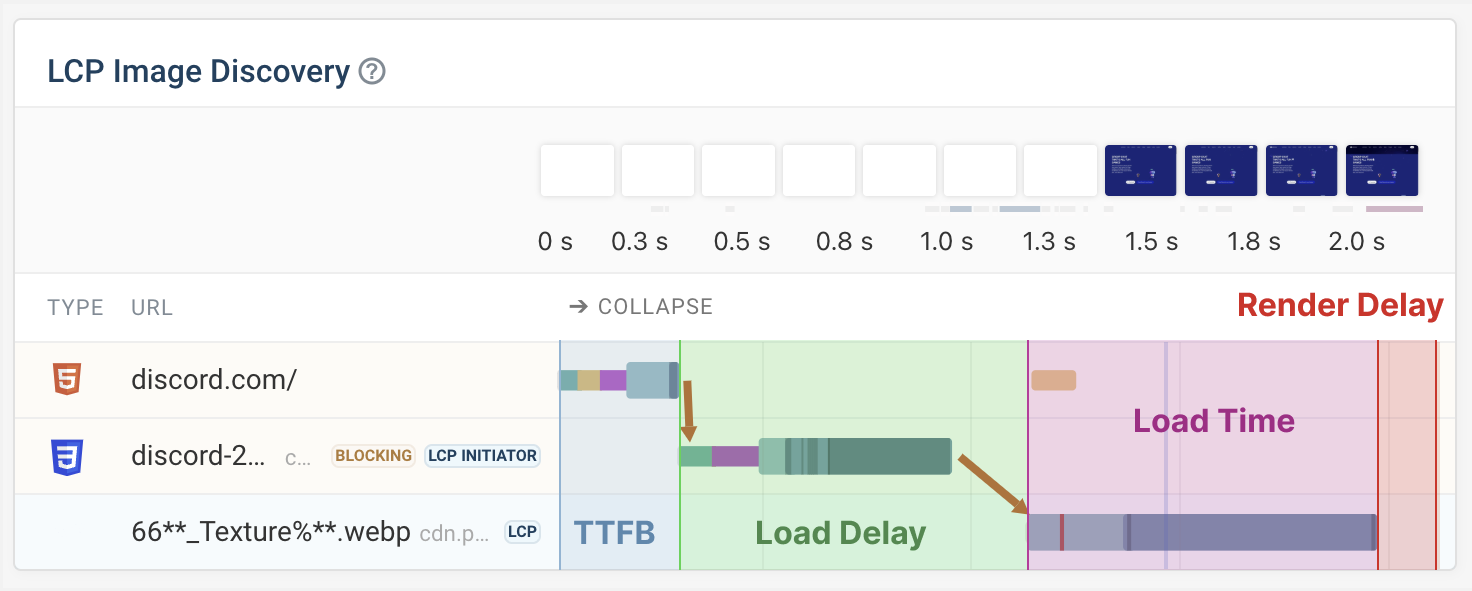
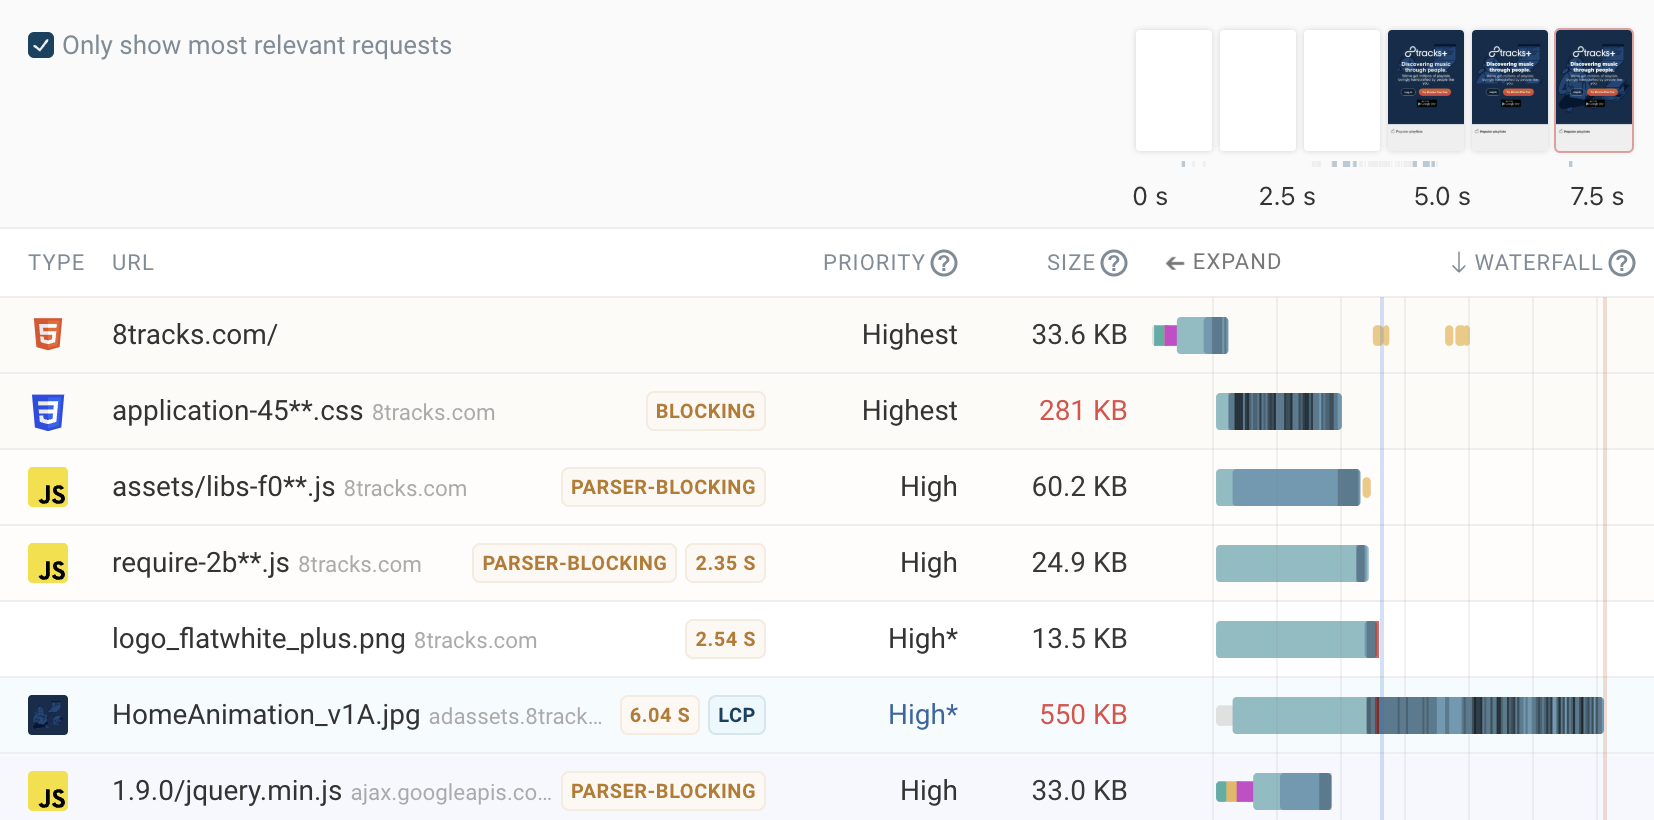
For example, you get a filtered request waterfall view showing you what sequence of network requests causes the LCP element image to load.
In the example below the LCP is caused by a background image that only loads once a CSS stylesheet has finished loading. Preloading background images is one way to fix this kind of page speed issue.
Interpreting the LCP element audit
The Largest Contentful Paint element audit in Lighthouse doesn't only tell you what type of content is responsible for the LCP. It also provides a breakdown of the LCP score into three LCP subparts:
- Time to First Byte: time to load the HTML document
- Load Delay: time before an LCP image loads
- Load Time: time to load an LCP image
- Render Delay: delay before image or text is displayed
Let's look at these components based on two real-world examples.
Images
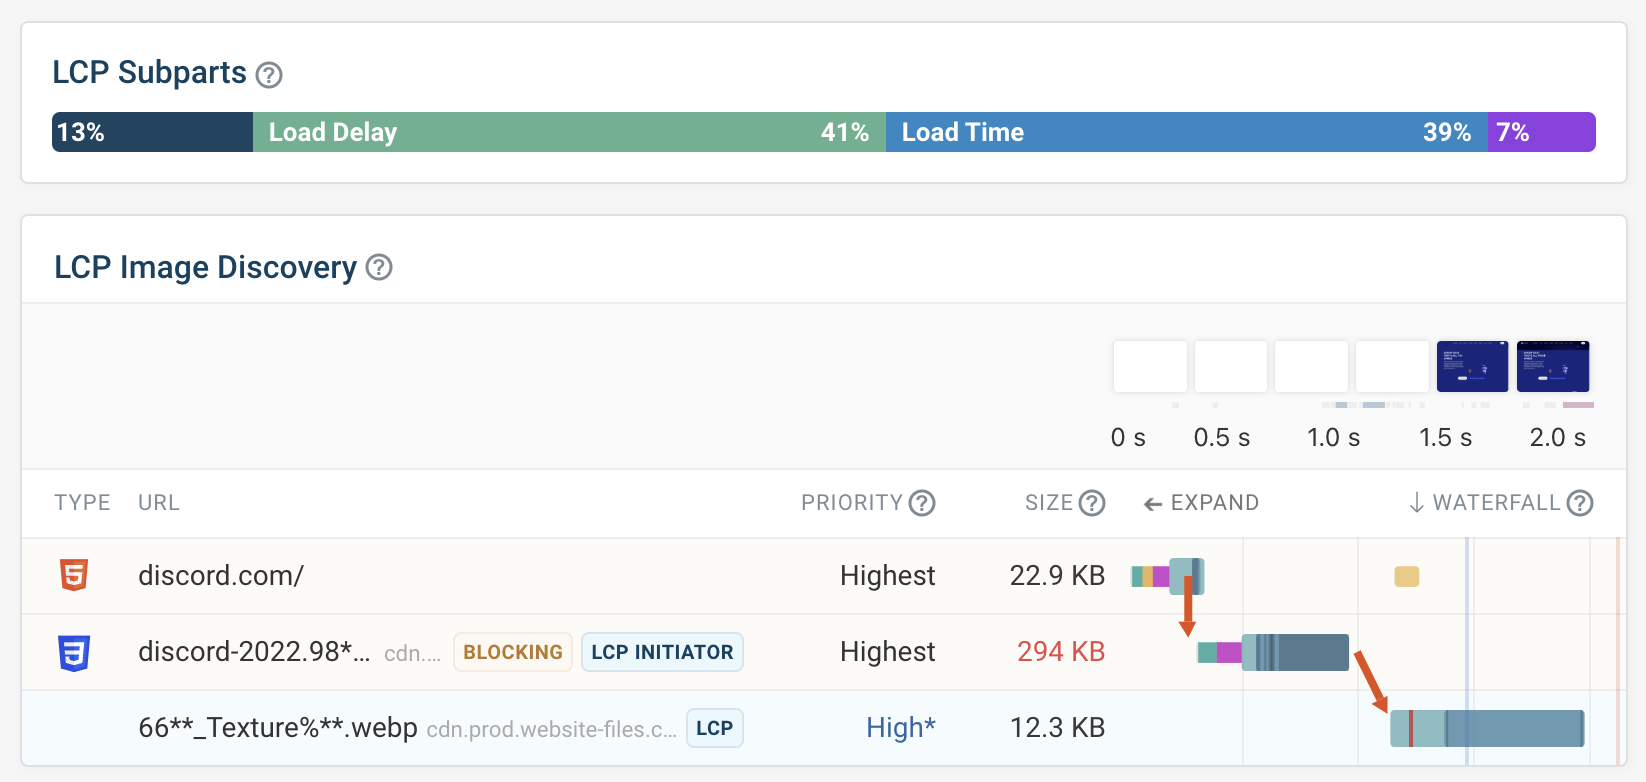
First, let's investigate the background image LCP element from earlier a bit more.
We can see that the TTFB score is low, suggesting that the backend server has a good server response time. The render delay component is also low, suggesting that the image shows up quickly once it's loaded.
However, the element has high load delay and load time components.
Why is the load delay component so high? Because, as we saw before, the loading of the background image is triggered by a CSS file referencing the image.
Before the image itself is loaded, this stylesheet needs to finish loading and then the page starts to render. During rendering the browser realizes it will need to load the background image to fully render the page.
The Load Time is spent downloading the image itself.
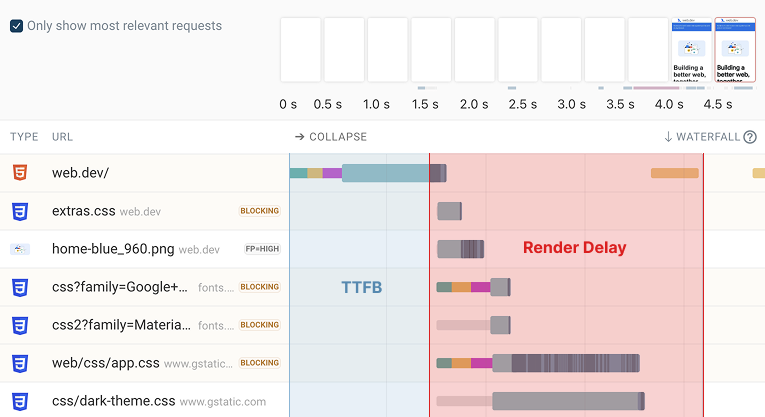
Text elements
Next, let's look at a website where the LCP element is an HTML <div> tag.
We can see that the Load Delay and Load Time components are zero. That makes sense, because no image needs to be downloaded here.
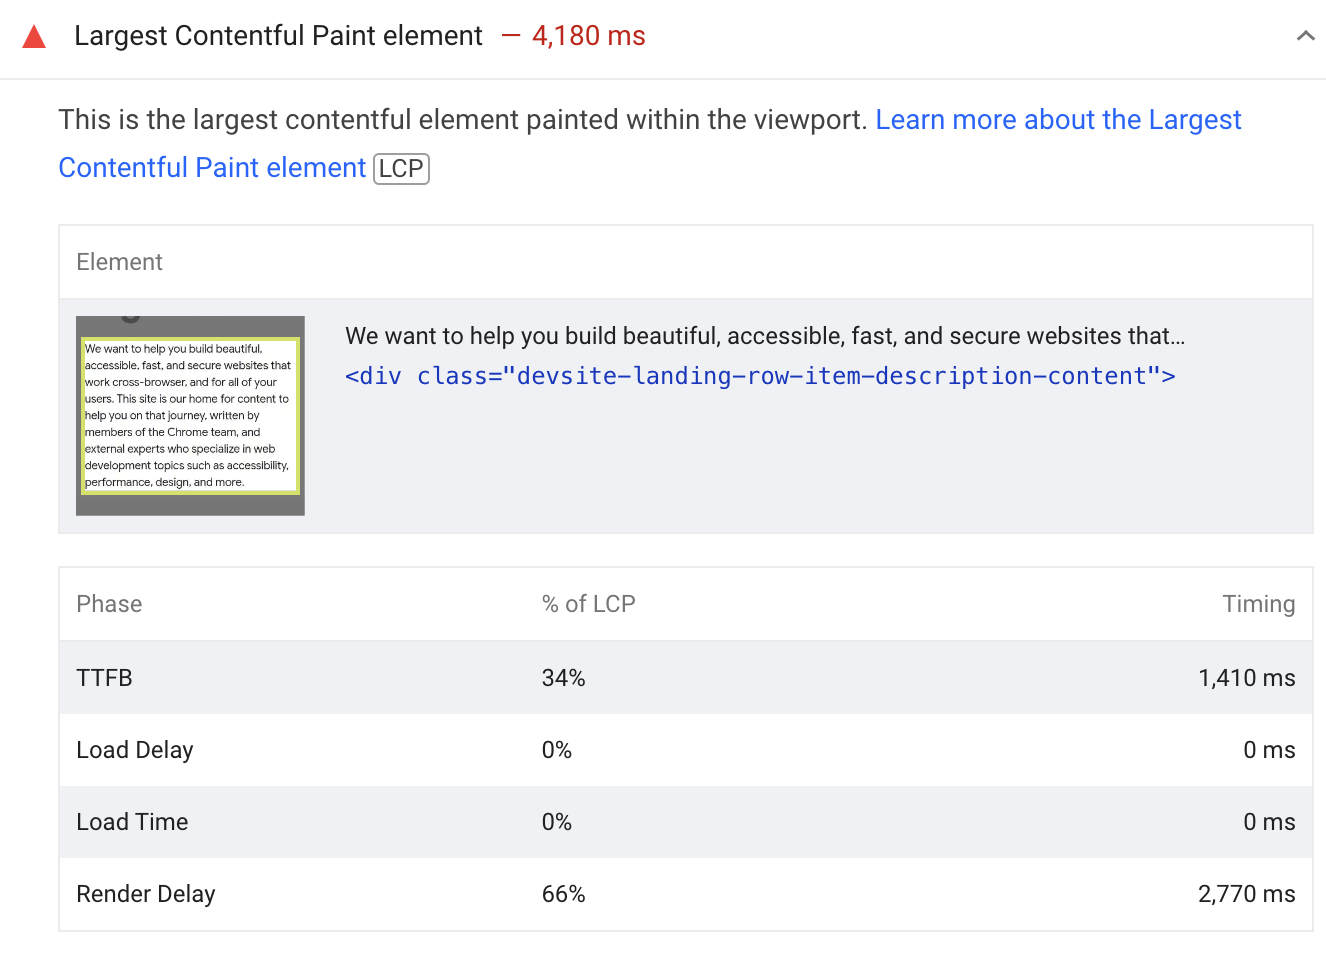
Instead the LCP load time for text elements is caused purely by the server response time and render delay that follows it.
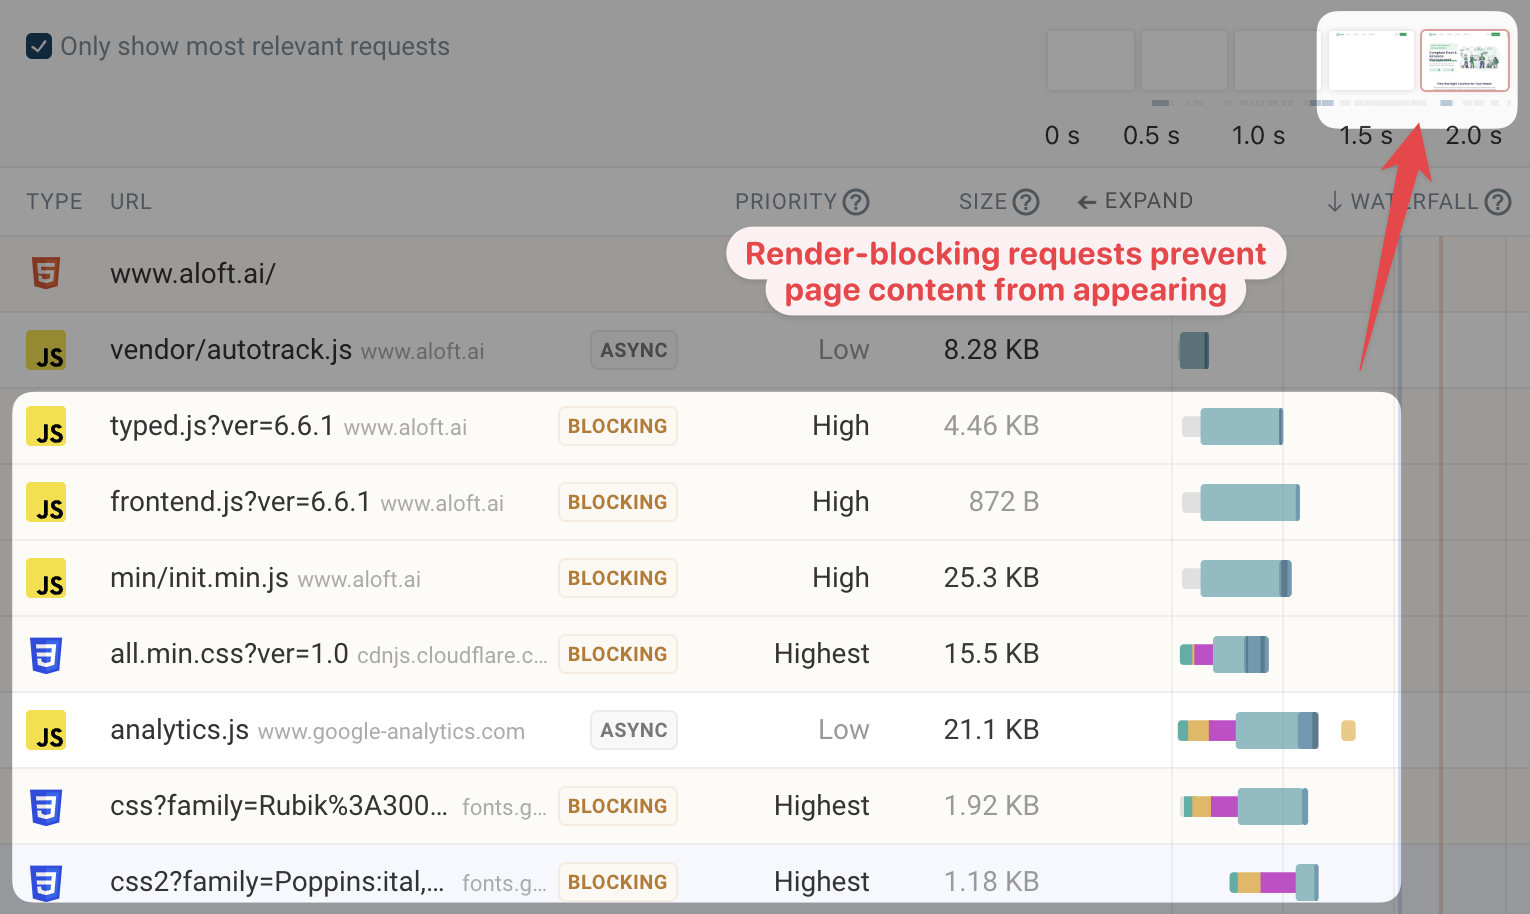
What can delay rendering? In this case it's render-blocking CSS stylesheets. No content can appear on the page until after these resources have finished downloading.
We can see that app.css in particular is a relatively large file that is taking some time to download. Optimizing this file, for example by reducing unused CSS, would be a good way to speed up the LCP on this page.
Get a deeper understanding of LCP elements
If you'd like to learn more about the Largest Contentful Paint metric and how different browsers identify the LCP on a page, check out this video!
How to fix the Largest Contentful Paint element audit
Overall the advice for fixing the LCP element audit matches the advice for fixing LCP issues in general. We've already seen two examples of what causes poor LCP and what you can do to fix it.
The strategies to fix poor LCP element scores depend on what LCP subpart contributes the most to the total LCP time.
Reduce server response time
If your website server takes a long time to start serving HTML to the browser then the browser can't display any content in that time.
You can address this issue in two ways:
- Fix your application server performance, for example by reducing database queries or by optimizing your JavaScript code
- Use a Content Delivery network to cache responses
Load LCP images with high priority
Browsers assign a priority to every resource they identify as necessary to load a page. LCP images should be high-priority.
Here's an example where that's not the case. The LCP image uses lazy loading, which tells the browser not to load the image until it has entered the viewport. In practice that means the page first needs to finish rendering before the browser realizes that this is an important resource!
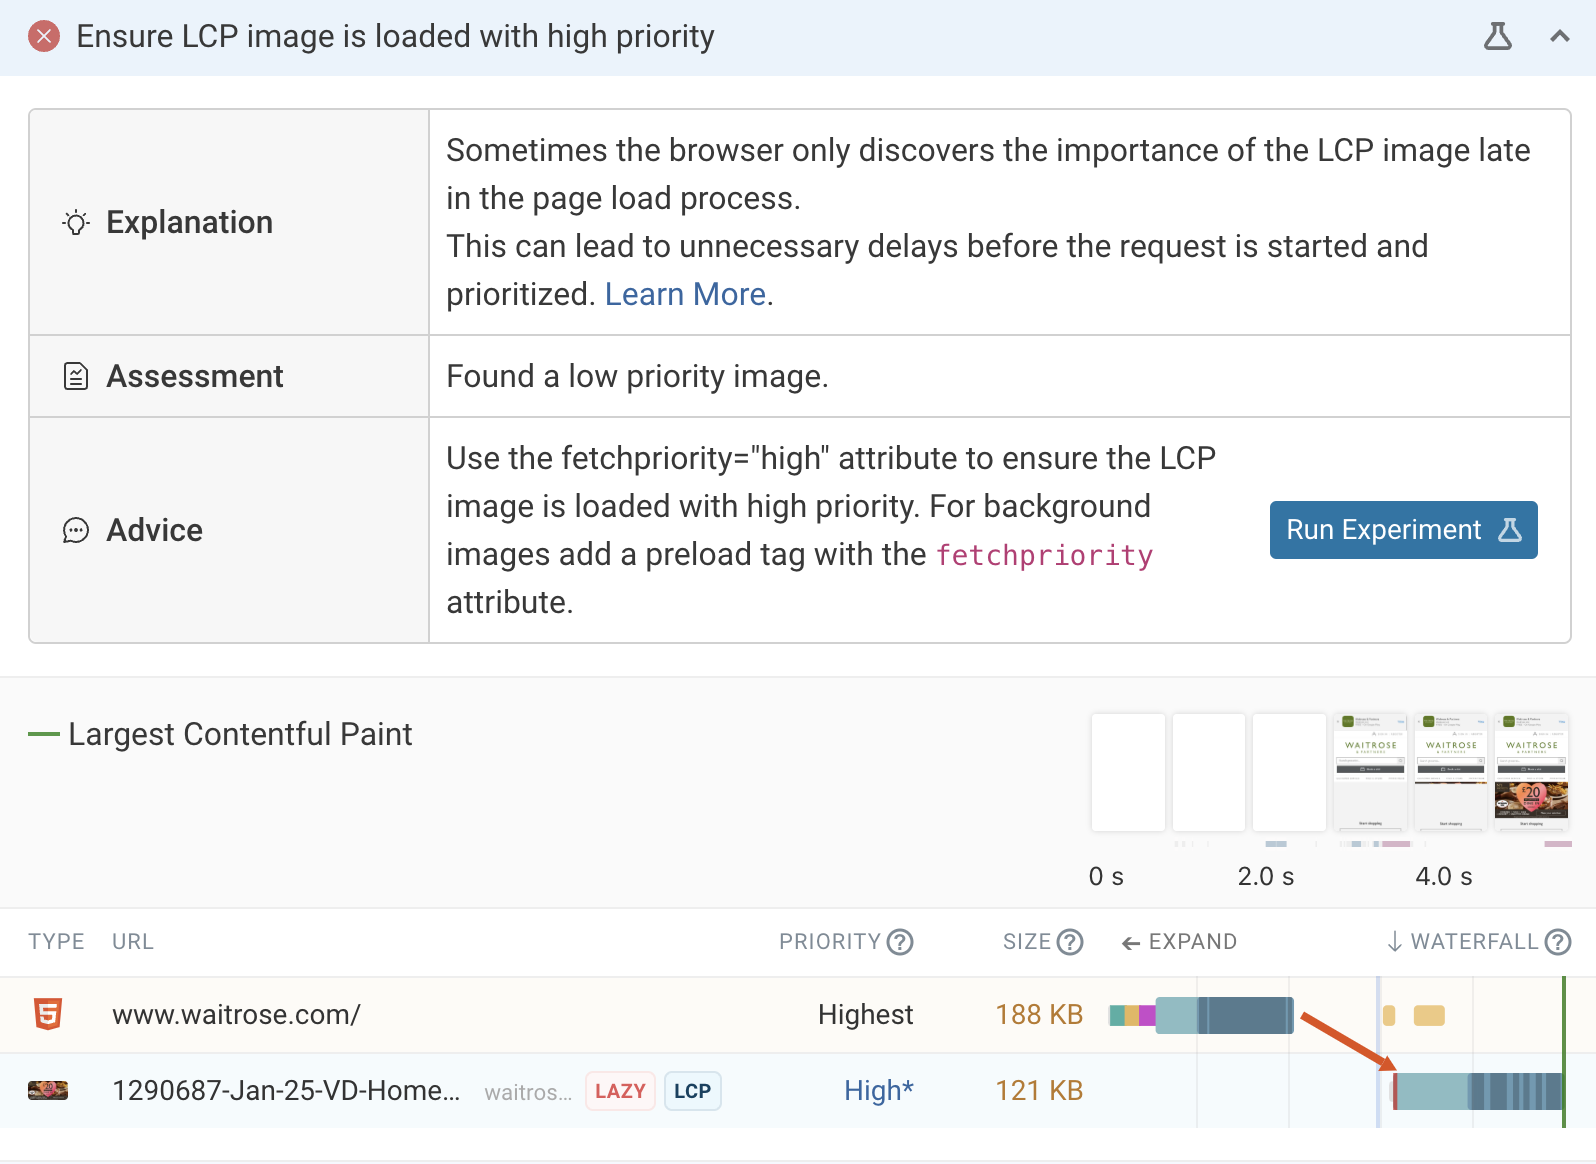
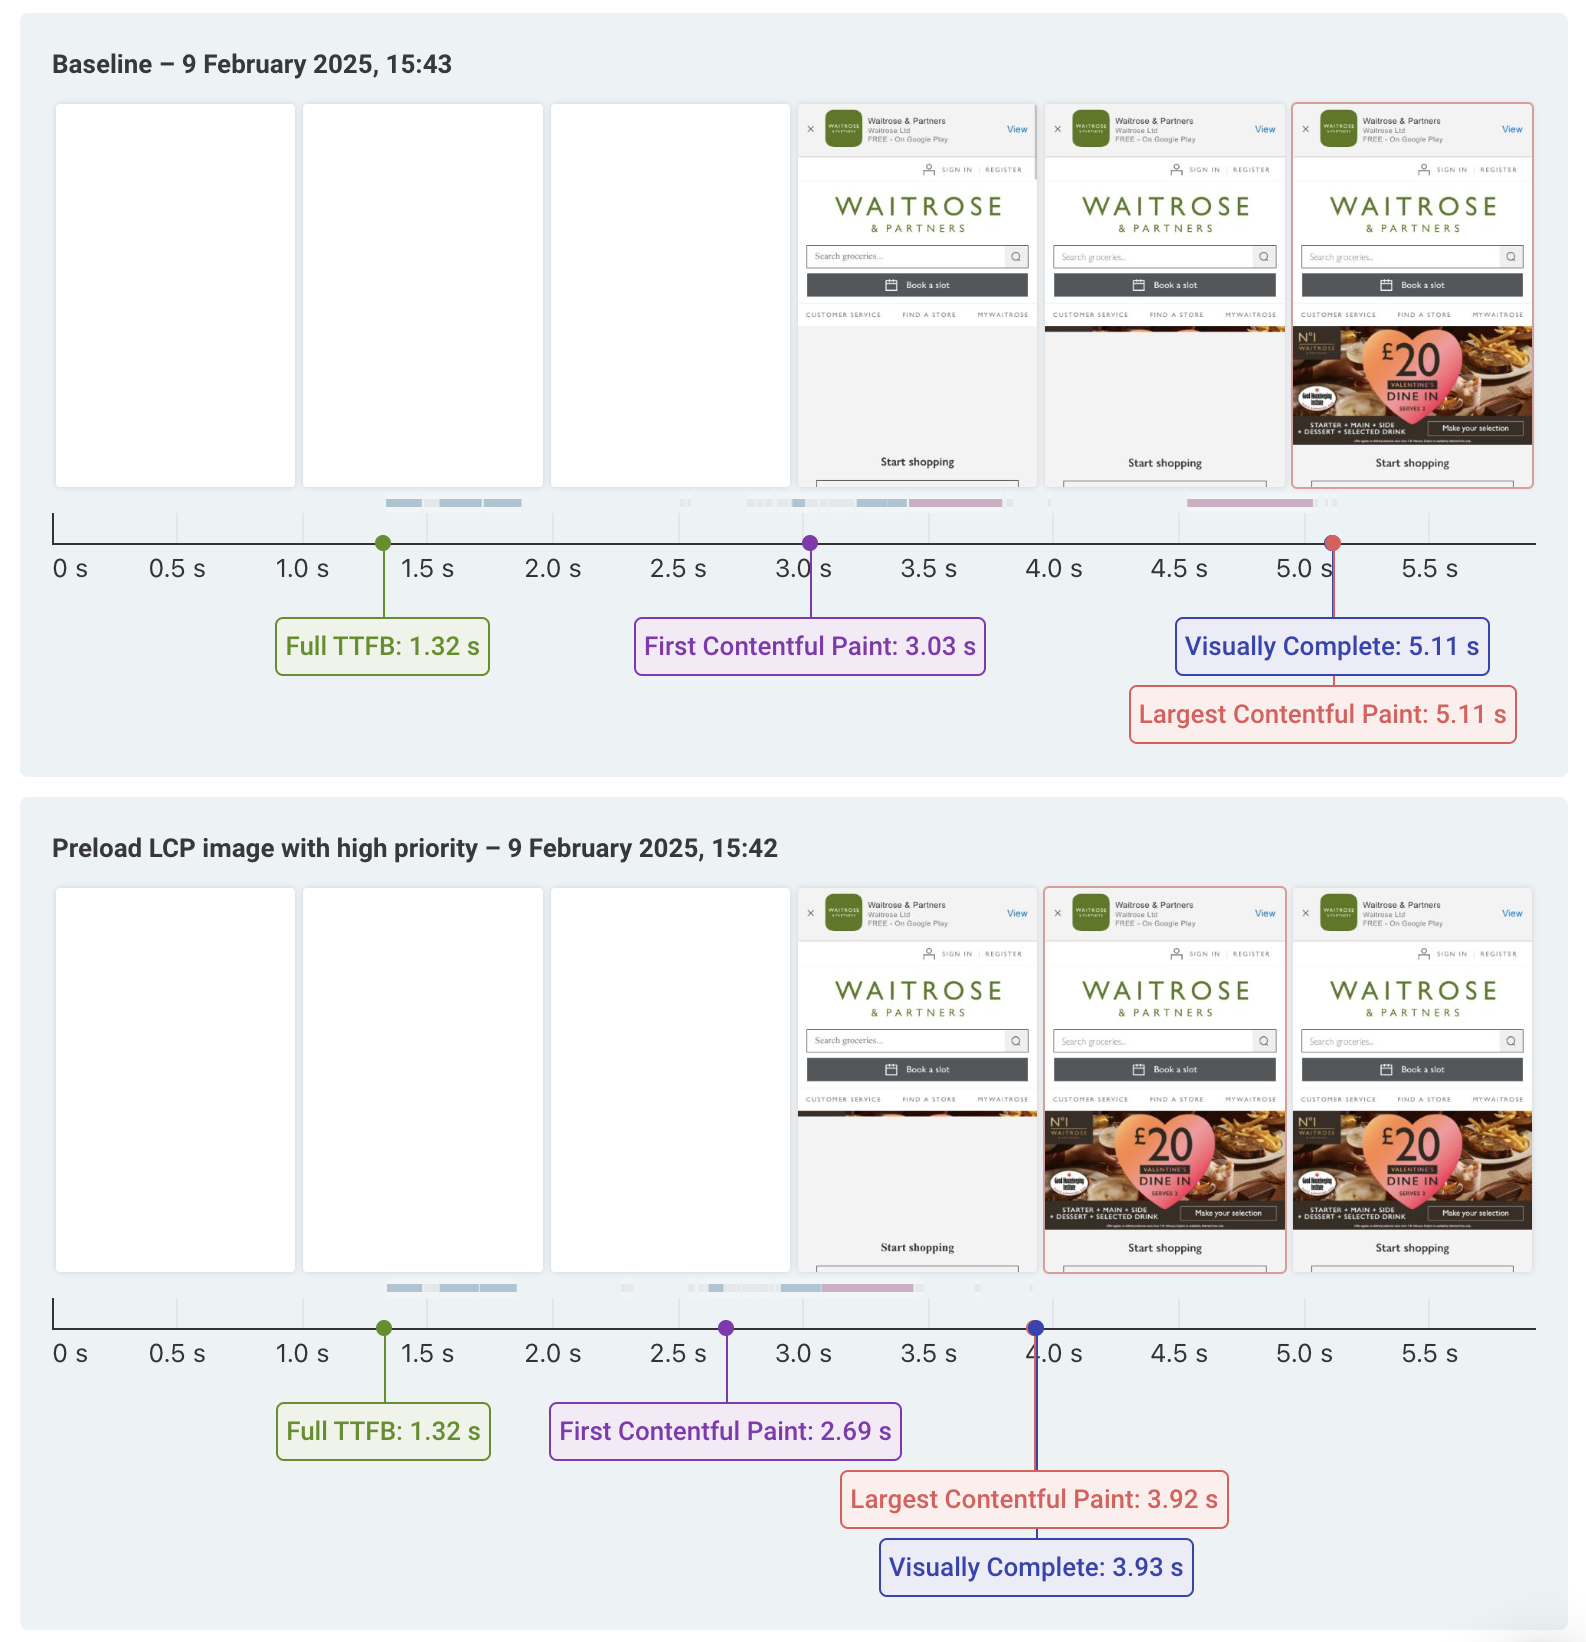
We can click Run Experiment to try out one fix for this issue, preloading the LCP image. We can see that the LCP has gone down significantly after changing the image priority.
Instead of preloading the image we could also simply remove the loading="lazy" attribute and instead add fetchpriority="high".
Use modern image formats
If images are taking a long time to download, using next-gen image formats like WebP and AVIF can reduce file size and download time.
You can see an example test result with a long image load time here. The image is over 500 kilobytes large and takes a long time to download on a mobile connection.
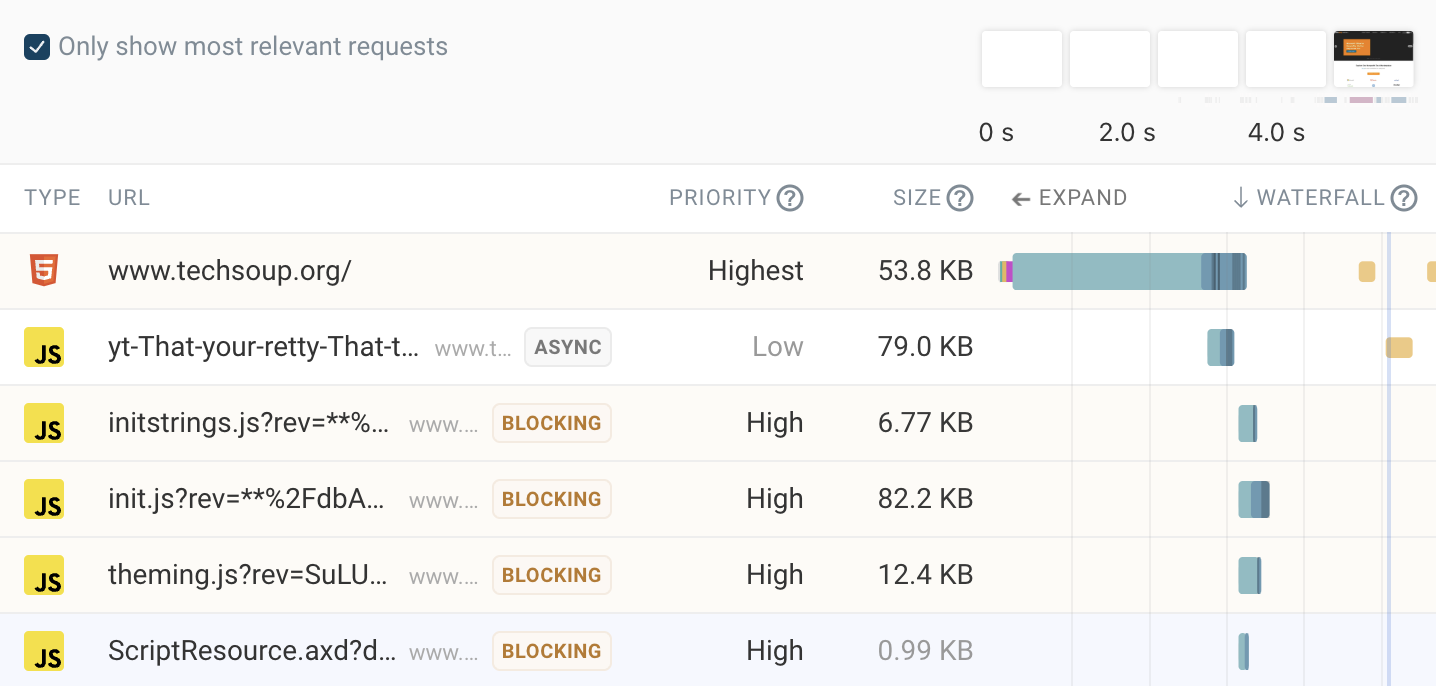
Reduce render-blocking requests
Having slow-loading render-blocking stylesheets and scripts on your website will cause a high amount of render delay.
You can use the defer and async HTML attributes to ensure these requests happen in the background without holding back the page load.
Get an LCP element breakdown for real users
Even for the same page the LCP element often varies based on device size, login status, or whether someone has accepted cookies or not.
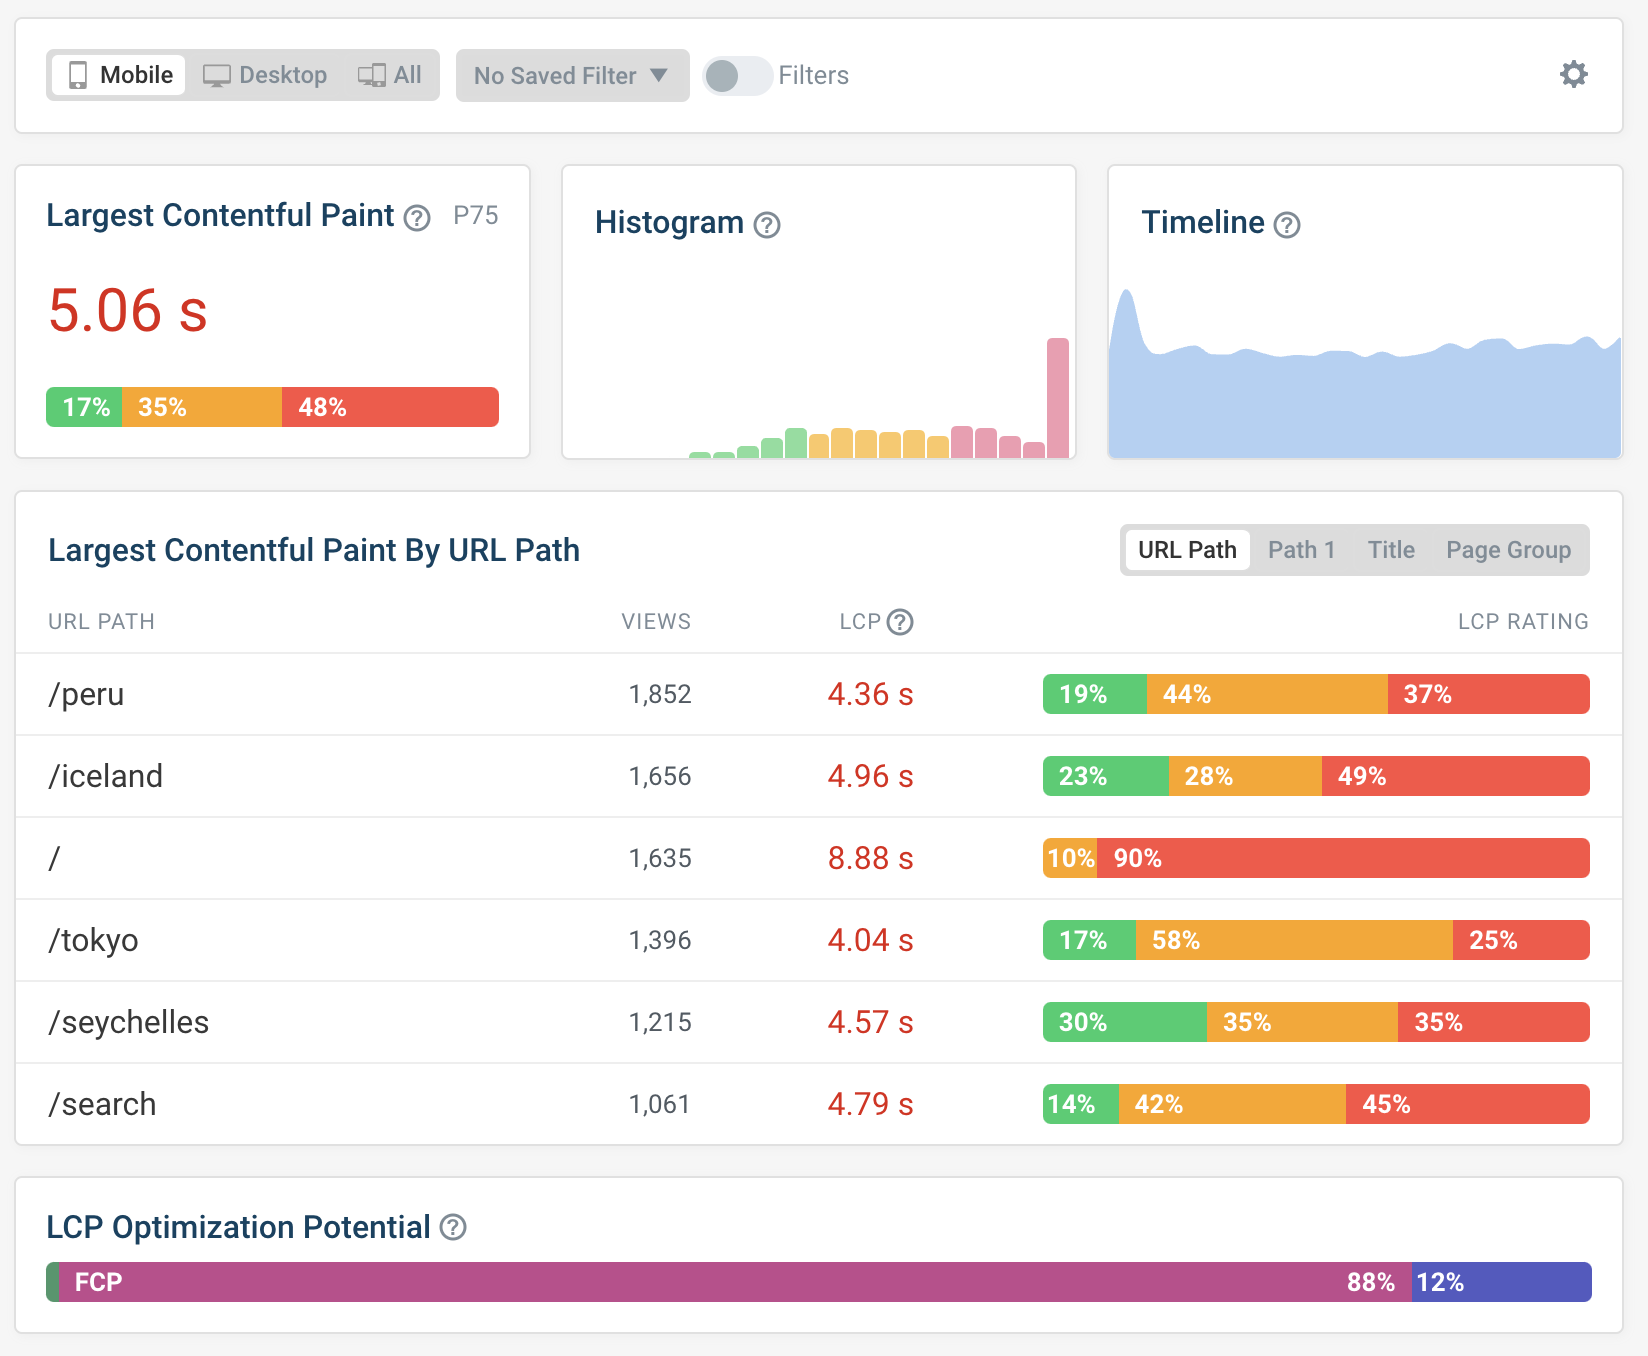
Real-user monitoring can help you see how often different page components are the Largest Contentful Paint element and how that impacts LCP scores.
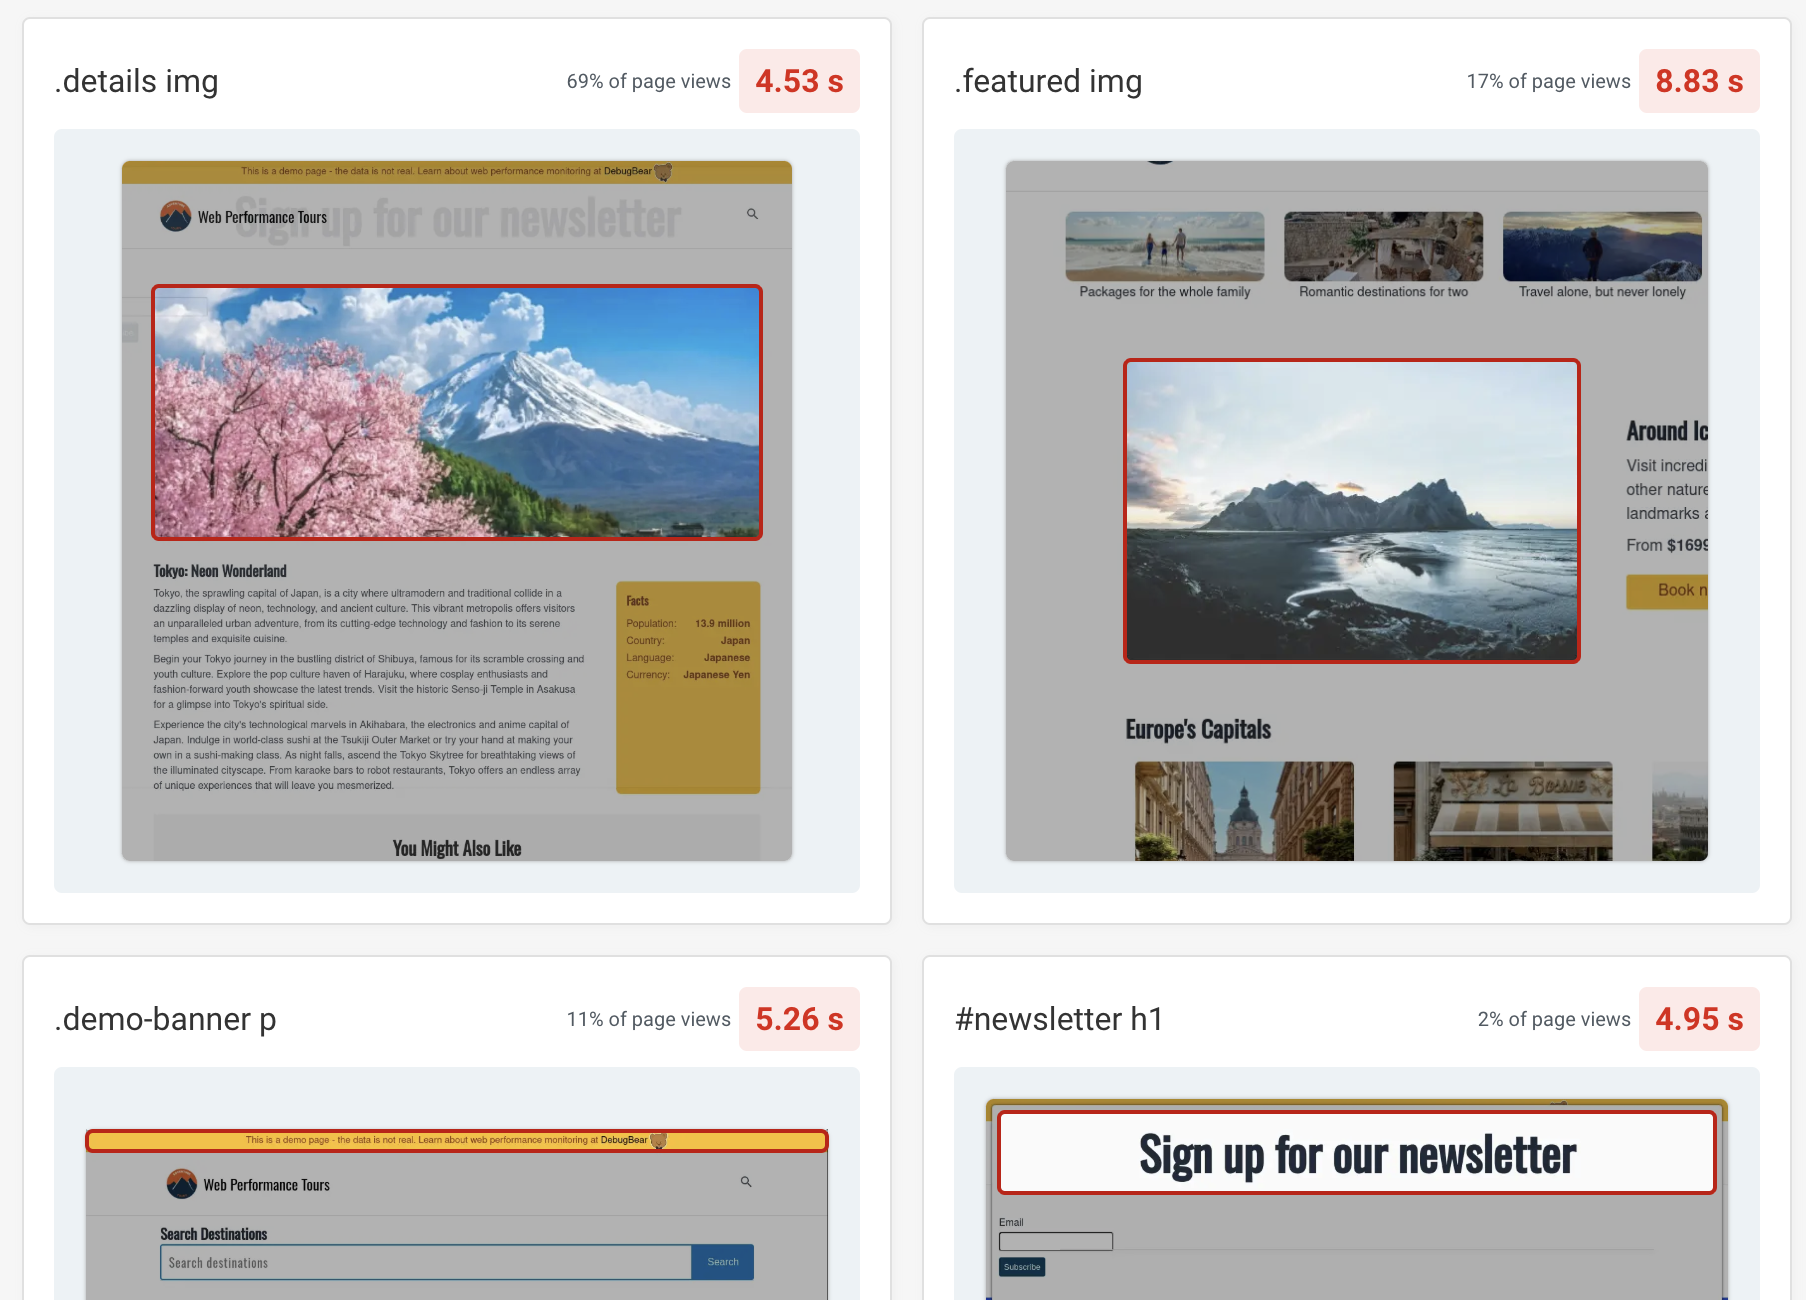
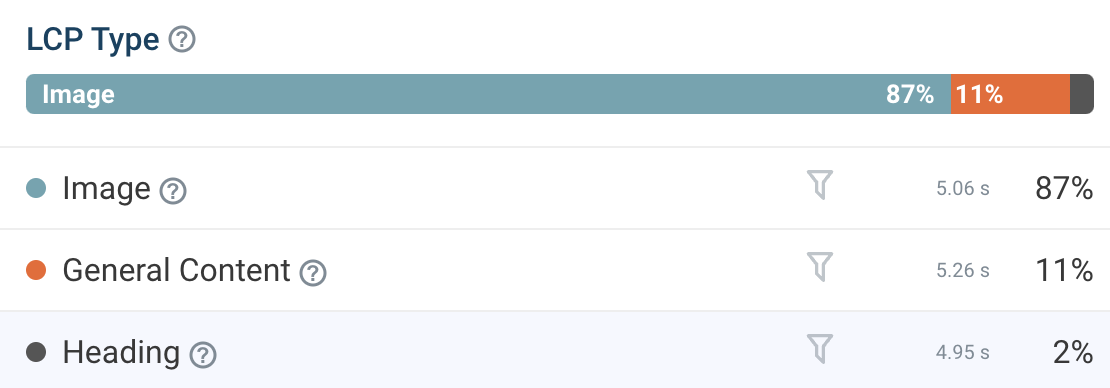
You can also get a high-level breakdown of LCP element types on your website. For example, images and headings are often the largest page element.
You can then filter by each category to investigate in more detail.
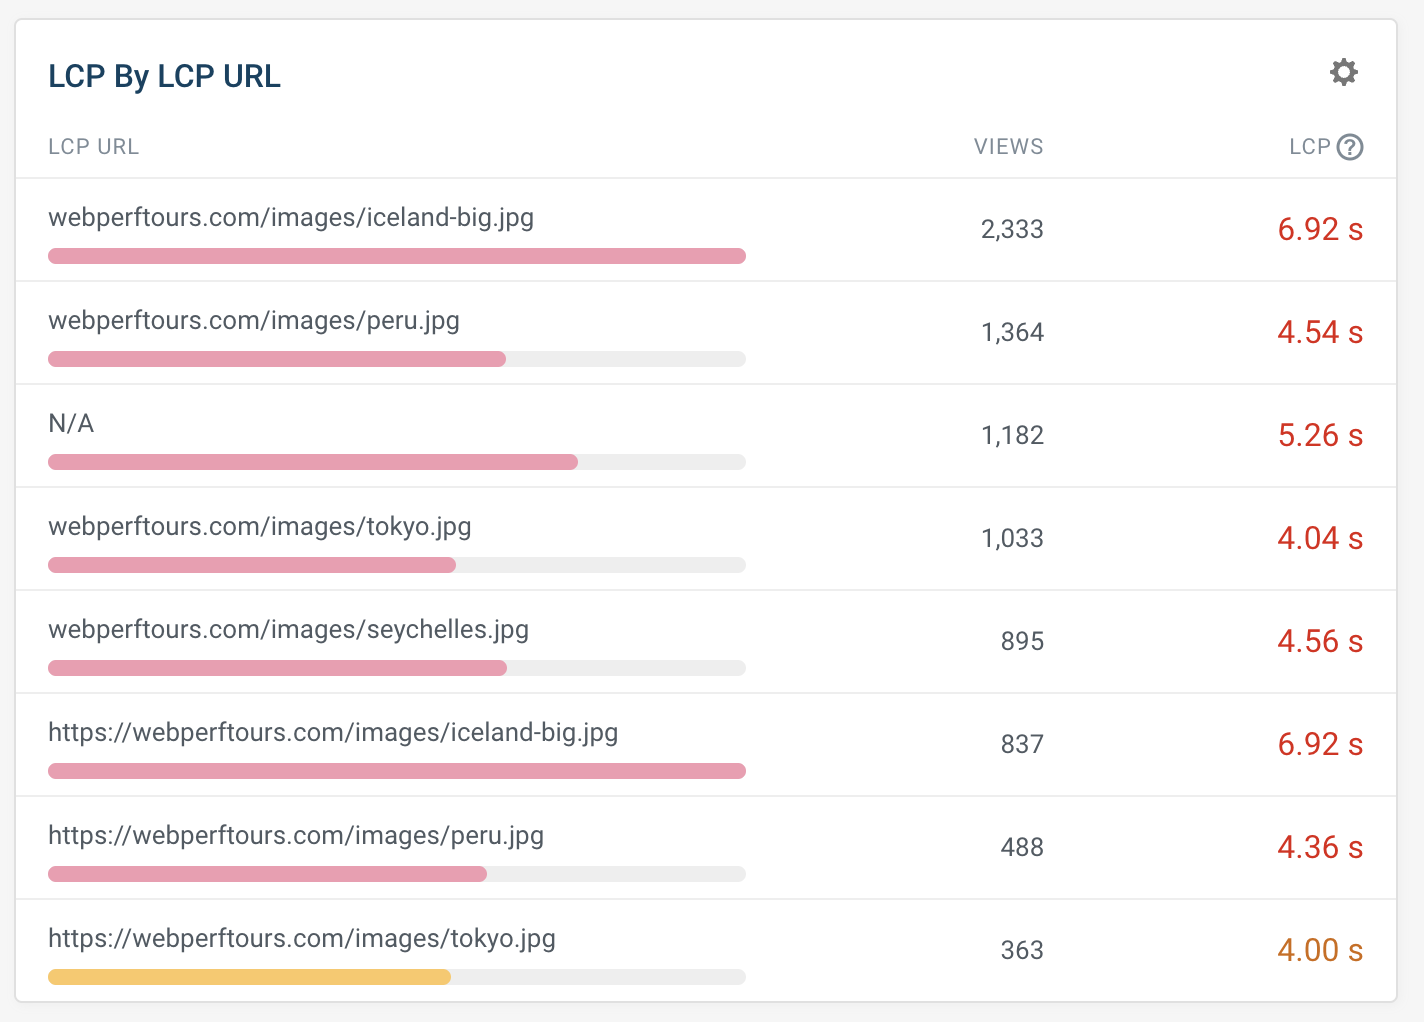
Breaking data down by LCP image URL helps you see whether particular images are causing problems on a page.
You can then optimize the images that cause problems most frequently.
Monitor LCP element scores
DebugBear is a Core Web Vitals monitoring tool that makes it easy to keep track of your LCP score and other web vitals metrics.
Simply add your page URL to start running scheduled page speed tests on your website. Each test result includes a full Lighthouse report as well as additional debug details like the request waterfall and custom recommendations.
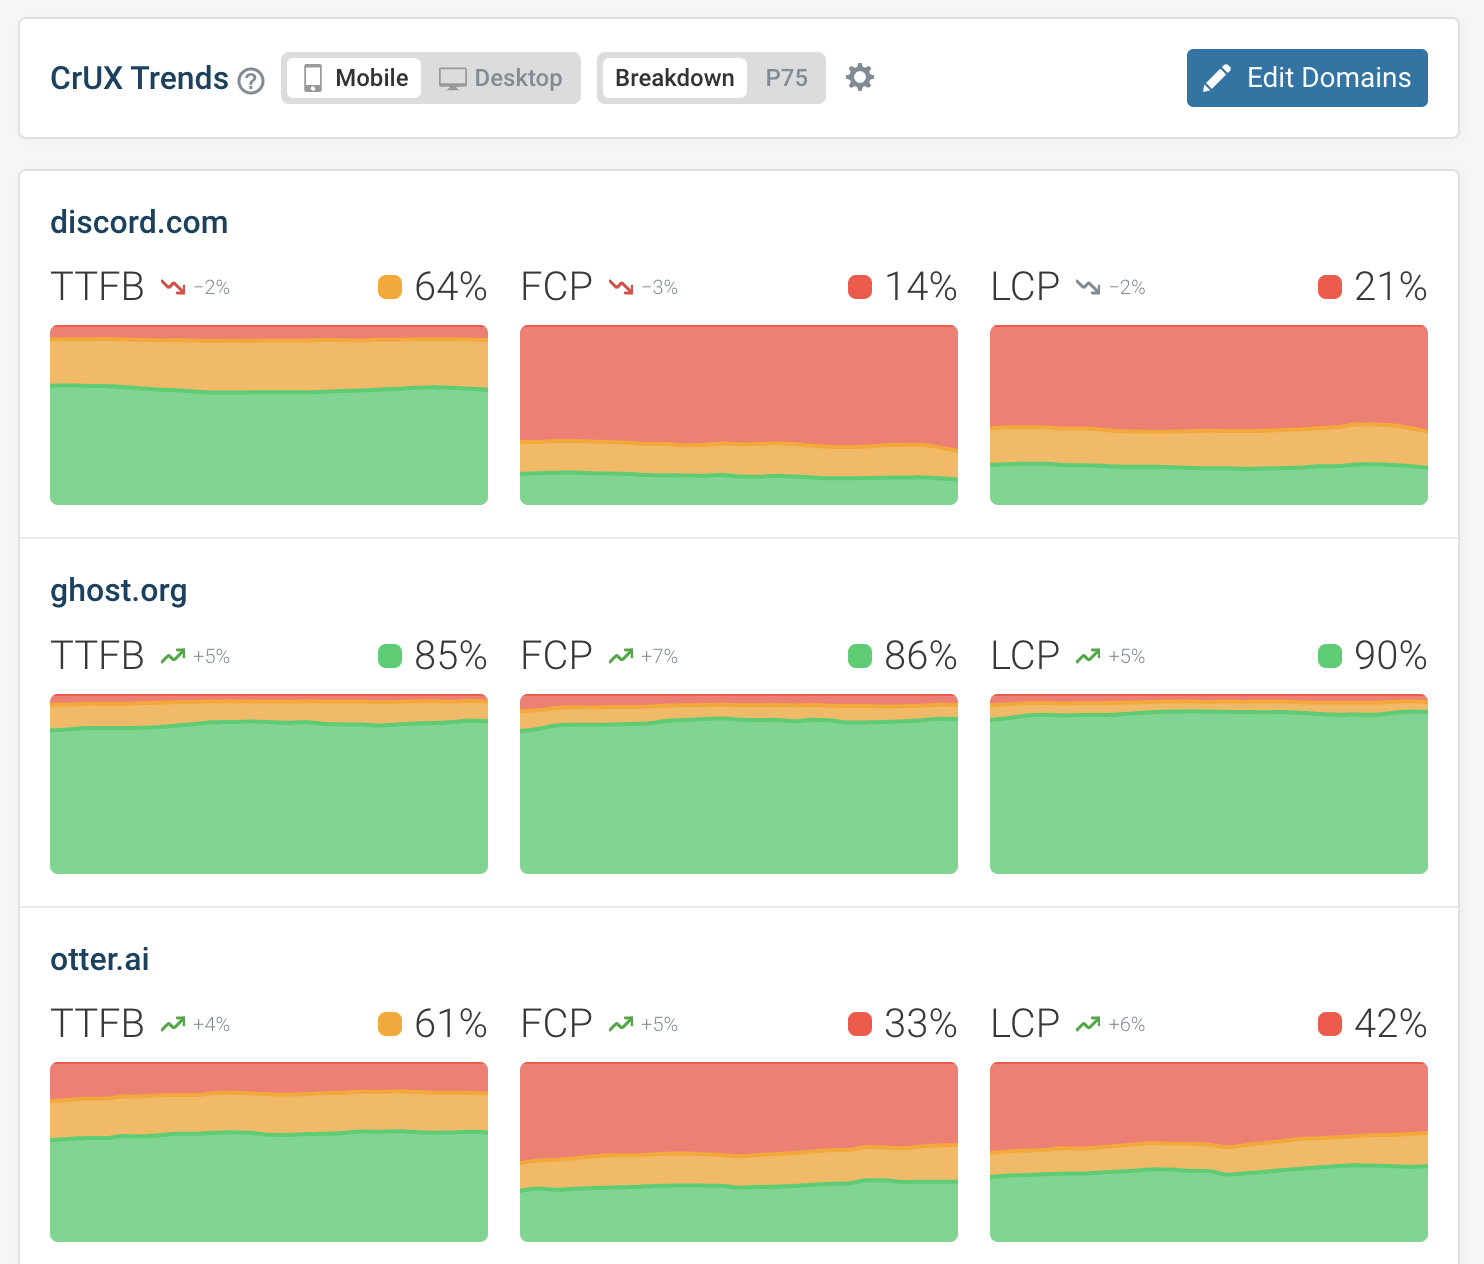
The Chrome User Experience Report (CrUX) is what Google uses for ranking signal data. This data is collected by Google from real Chrome users who've opted into data collection.
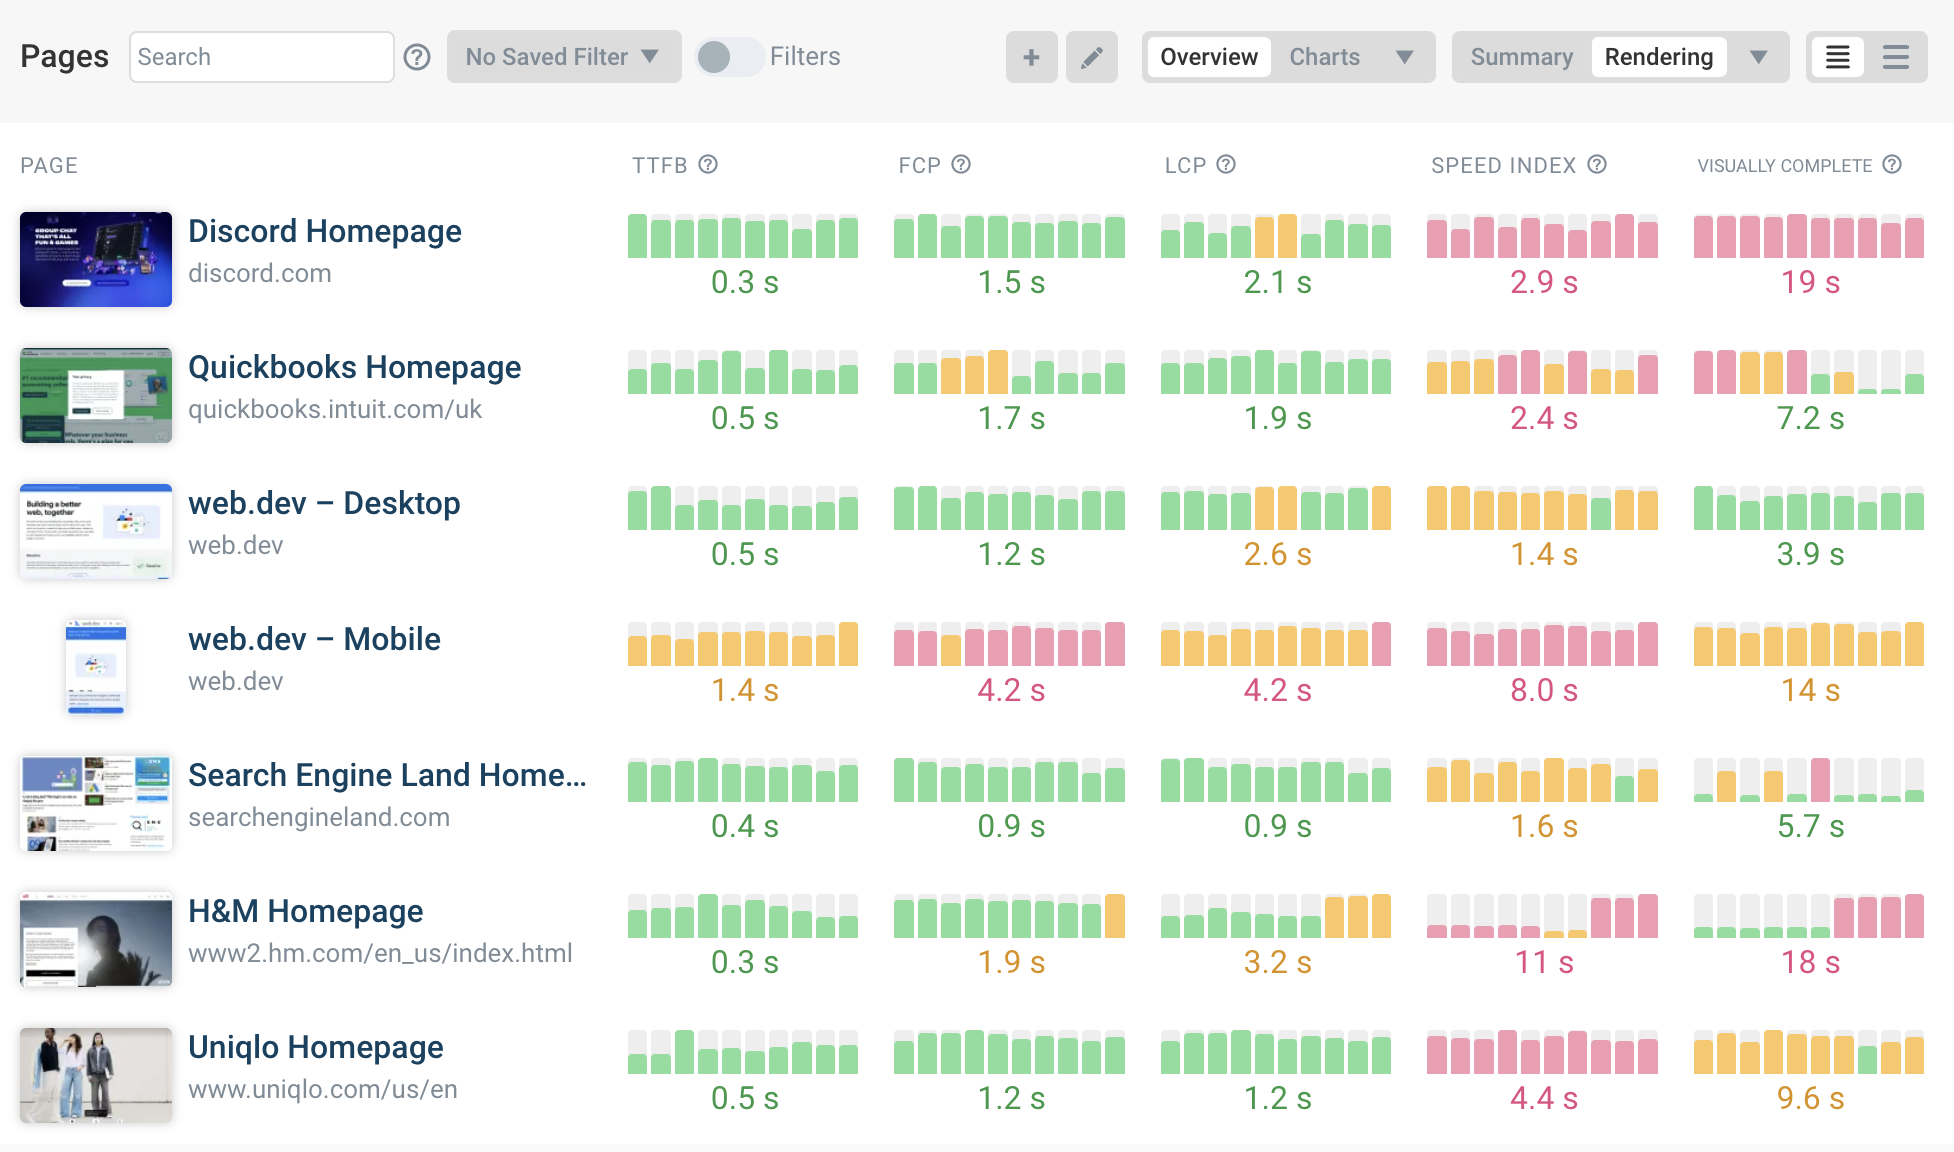
DebugBear lets you track these scores and benchmark your website against competitors. See how you're stacking up in your industry and whether your site and competitor performance are getting better or worse.
Real user analytics gives you an overall breakdown of your website and allows you to identify slow pages or issues impacting many visitors.
In addition to tracking Largest Contentful Paint scores, DebugBear also reports data for Cumulative Layout Shift, Interaction to Next Paint, and other web performance metrics.
Review each RUM page view to identify what caused poor performance, whether device and network speed played a role, and what requests were made when loading the page.


Monitor Page Speed & Core Web Vitals
DebugBear monitoring includes:
- In-depth Page Speed Reports
- Automated Recommendations
- Real User Analytics Data