

How The Independent makes their website fast and optimizes Core Web Vitals

The Independent is one of the largest news websites in the UK.
We talked to their Head of Engineering, Mandip Ahdan, to learn more about why performance matters to them and how they use DebugBear to monitor it.
Why does page speed matter for your company?
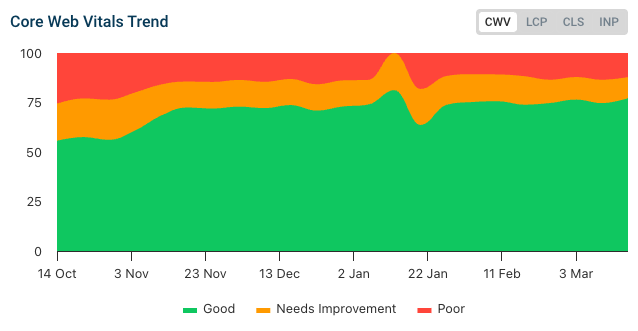
It's super important to us. When I first joined, our page speed was about 12 and a half to 14 seconds. For a business that's news, we wanna be loading a lot faster.
So we made it our goal to improve performance and our page speed has now improved massively.
Performance is key for us. If we are behind other publishers, then we are not gonna be ranked as high in our live blogs and all that sort of stuff.
What's the role of the Core Web Vitals metrics for you?
When the Core Web Vitals were introduced, Google put another bullet in the gun for us.
We realized that we had to pay attention to LCP, FCP, and CLS, and it was quite important for us to then work on those items. So that when Google did officially start ranking people based on these metrics, we weren't penalized.
We made a lot of changes around the way we display ads and other components that are loaded in, because we have a lot of third-party vendors on our site.
What caused you to look for a page speed monitoring solution?
There are a lot of tools out there as you know, the most common one being Lighthouse. And then you have WebPageTest, Yellow Lab, ... and we used a lot of them, even a few Chrome extensions.
A lot of them did scans above the fold, which didn't really help us. We also tried the CrUX data, but it doesn't show us what's the cause of things. It just gives us data that we're not performing right.
It took a while to find the right tool. We heard about DebugBear from one of our suppliers. So we tried DebugBear and it's been an eye opener for us and has really shown us what's causing the issues that we are having on our site.
How do you use DebugBear to improve Core Web Vitals?
Before we were using Chrome a lot and Lighthouse would give us a report and tell us we've got a great score! But then at the top it says field data and we're not doing well.
The real user monitoring data in DebugBear made a big difference. We can go into any of the three Core Web Vitals and get a breakdown of what is causing the issue and how many visitors are impacted.
We also see the page element that's causing the problem, which we didn't get from Lighthouse or WebPageTest.
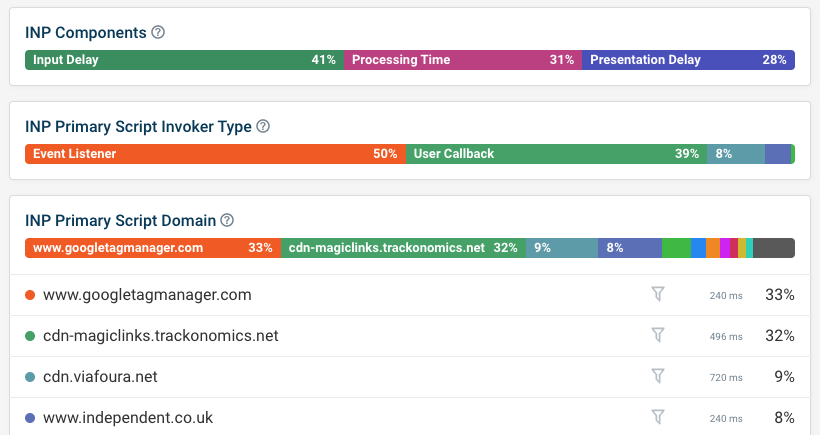
How did DebugBear help you improve your Interaction to Next Paint scores?
INP is probably the most difficult of all the Core Web Vitals. We have a lot of third-party code and you don't always know if it's an issue on our end or their end that's slowing things down.
DebugBear helped us a lot to discover what's going on and where interaction delays are coming from.
How do you use DebugBear for monitoring?
I do daily checks to see how things are going over the past 24 hours, to see if there's any change or any problems that have appeared.
We also run some synthetic Lighthouse tests to make sure key pages are running smoothly.
I also recently set up the Slack integration to get alerted to JavaScript and API errors. The devs and I can monitor those and be on top of it right away when there are changes.
What are the main benefits you've seen from using DebugBear?
Using Debug Bear has helped us make improvements around INP primarily, making sure that we are doing more work around optimizing our JavaScript.
We released something called Bulletin recently, and we used DebugBear to make sure that's optimized. And we've seen that the Core Web Vitals are consistently green across the Bulletin section.
Anything else you'd like to mention about the product?
It's nice to see that you've been doing updates, for example adding the table with the timeline for each page view.
The Optimize tab is great to help us find out what we can do to improve specific metrics.
You are using an old browser that is not supported anymore. You can continue using the site, but some things might not work as expected.