Get more data to debug slow real user experience, correlate page speed with bounce rate, configure RUM page groups and domains, and compare test results more easily.
Better RUM debug data
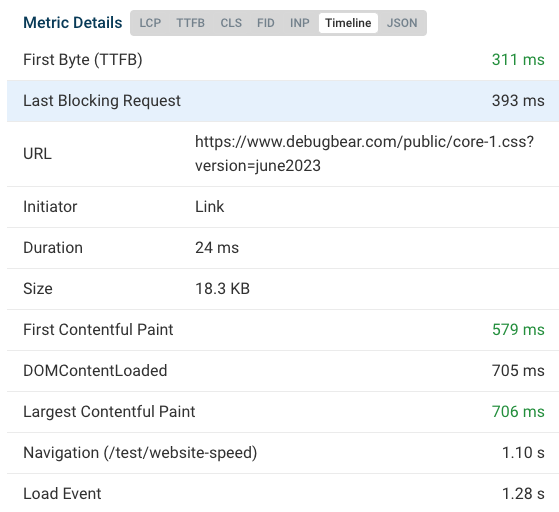
We now keep track of debug metrics like DOMContentLoaded and the load event. In addition to that we show what render-blocking script took the longest to load.

RUM bounce rate correlation
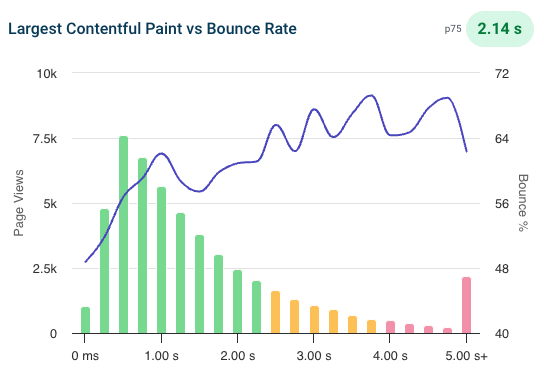
See how page load time correlates with bounce rate.

More RUM customization
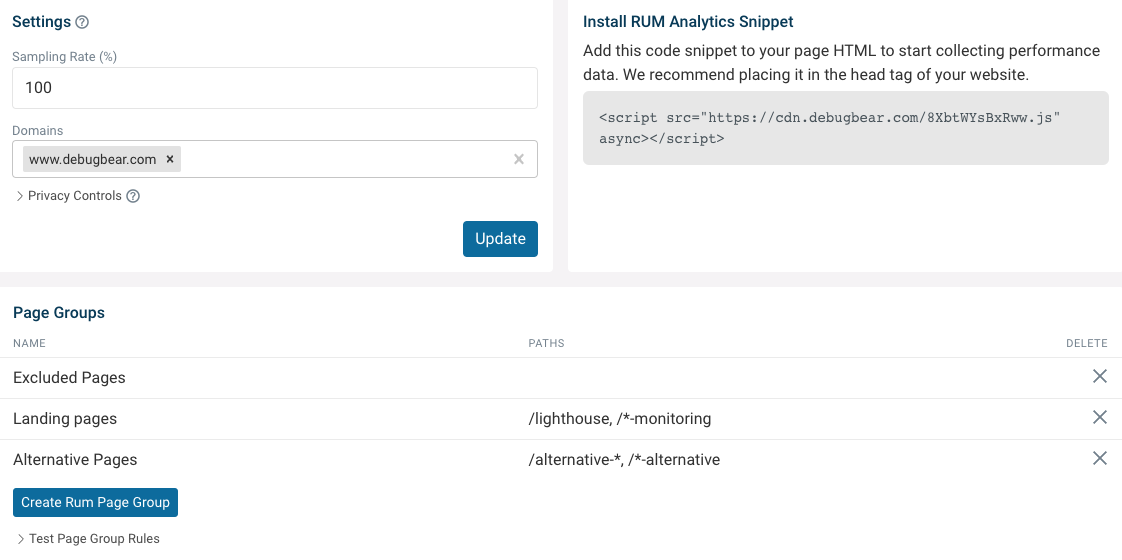
Set up page groups for analysis, limit data collection to specific domains, and configure privacy settings to control what data gets saved.

Compare tests and pages more easily
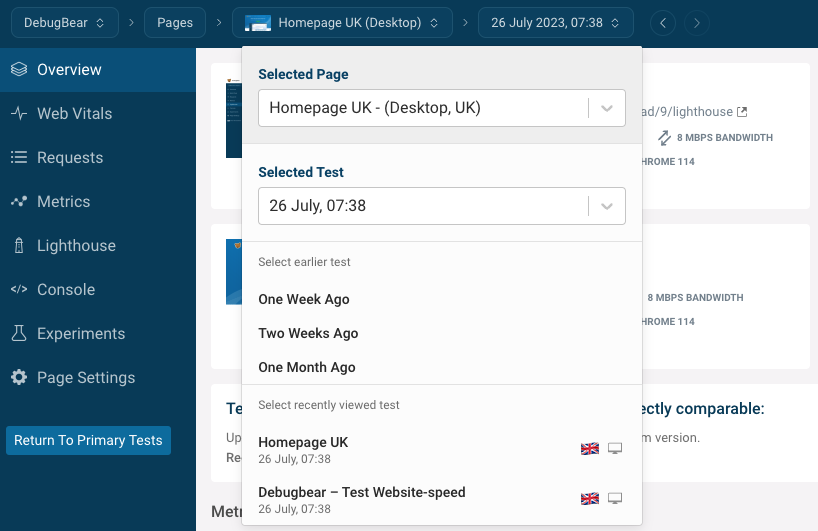
We've updated the test selection UI to make it easier to compare different test results.

New articles
- The Ultimate Guide To Responsive Images On The Web – find out how responsive images can make your website faster
- Working With Percentiles: What Do p50, p75, And p90 Mean? – learn how to work with percentiles in a Core Web Vitals and page speed context