Improved data to debug layout shifts and other web performance problems.
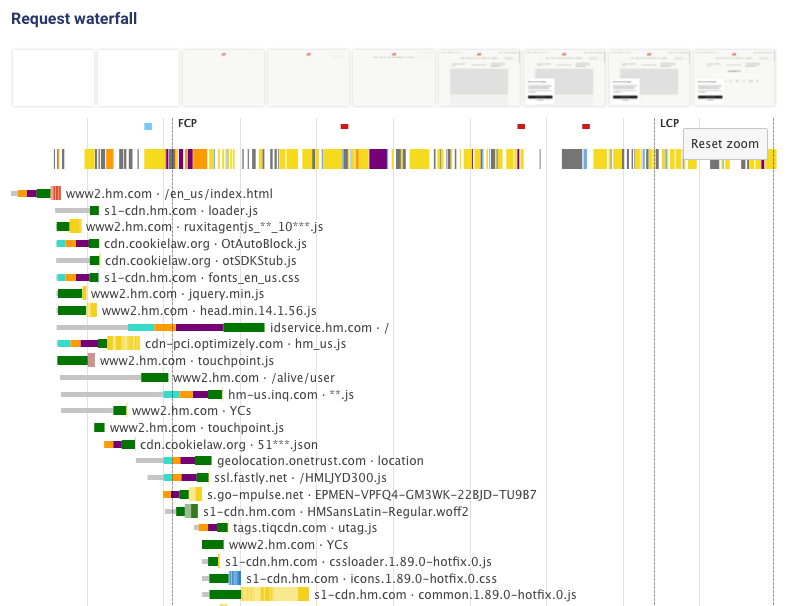
Improved timeline
The DebugBear timeline now shows user timings, layout shifts, as well as when chunks for each request are received. Plus you can select a time range and zoom in!

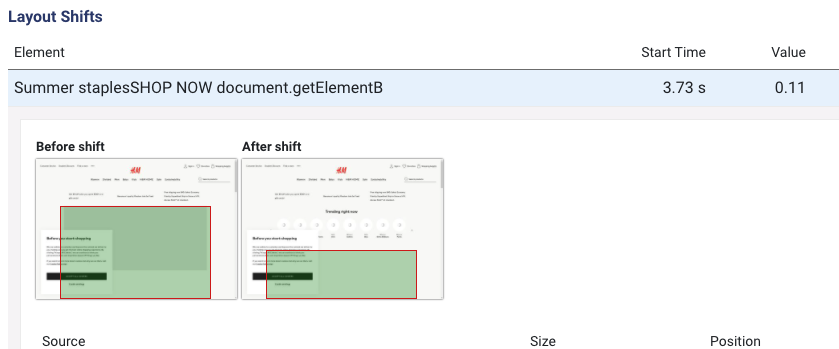
Layout Shifts table
The Performance tab now includes a list of all layout shifts, letting you see exactly what caused a change to your Cumulative Layout Shift metric.

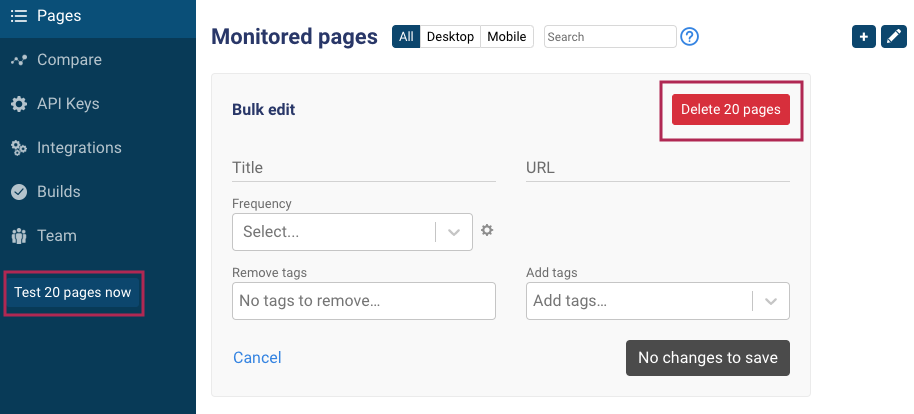
Delete tests and trigger pages in bulk
You can now trigger ad-hoc tests for all pages in your project, or a bunch of pages you no longer need in one go.

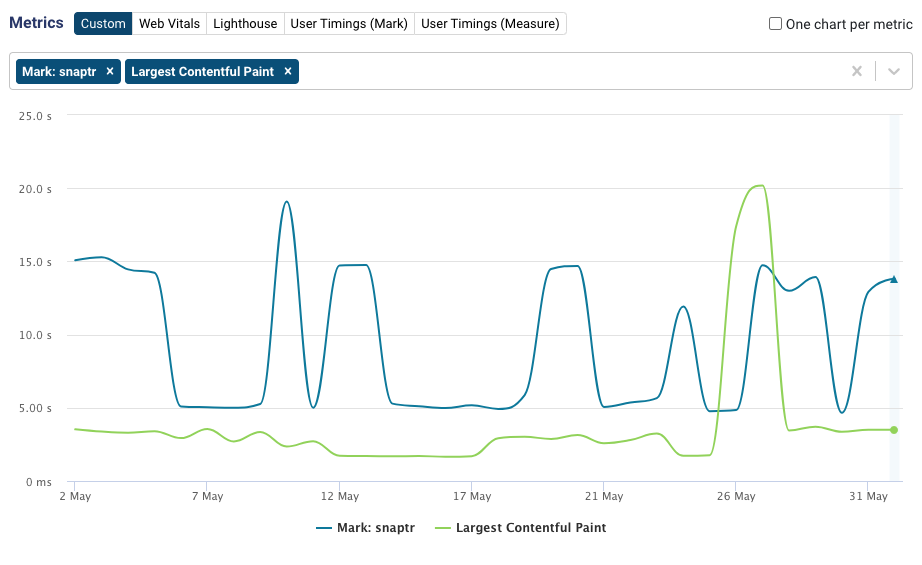
Create custom metric charts
Create charts combining any number of metrics in the Performance tab.

Disable default wait
On some pages the CPU and network never become fully quiet. As a result the Lighthouse test ends up timing out.
To test these pages you can now disable the default Lighthouse wait and instead use your own custom condition, for example an element that exists in the DOM.

New blog posts
Profiling site speed with the Chrome DevTools Performance tab – an in-depth look at how to interpret the performance data in Chrome DevTools
Optimizing page performance by lazy loading images – case study showing how to use the loading="lazy" attribute to improve performance.