
Chrome DevTools has supported network throttling for a long time. So far, this always applied to all requests. But now Chrome Canary offers an option to apply throttling to specific requests or domains.
How to enable request-specific throttling
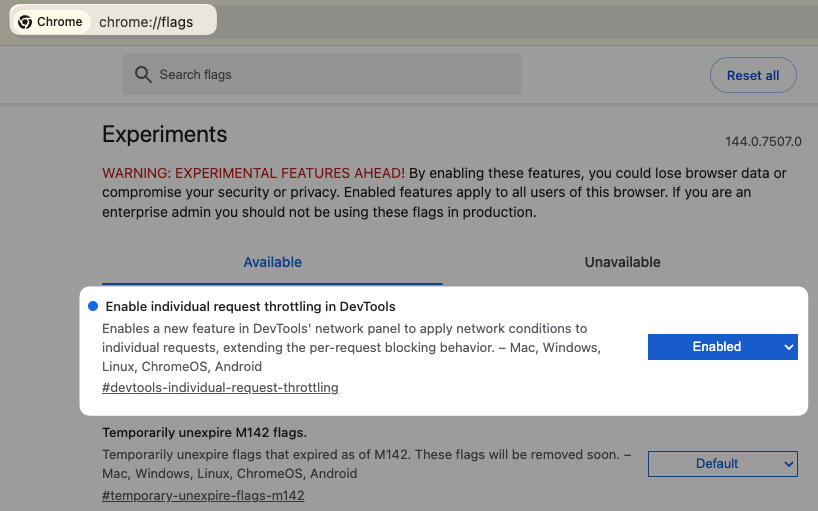
To throttle a specific request you currently need to install the nightly Chrome Canary build and then toggle Enable individual request throttling in DevTools on the chrome://flags page.
Throttling a specific request in Chrome Canary
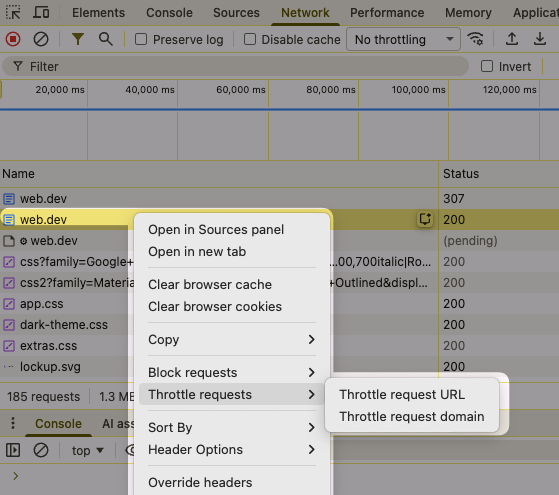
To apply a delay to a request, open Chrome's developer tools and look for the resource in the Network panel.
Then:
- Right-click the request
- Select Throttle requests
- Select Throttle request URL
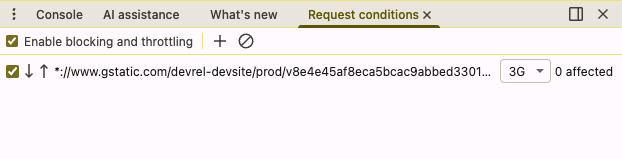
Chrome then shows the Request conditions tab showing the request matching pattern and the type of throttling that's applied. Here Chrome is simulating a 3G connection when loading this specific resource.
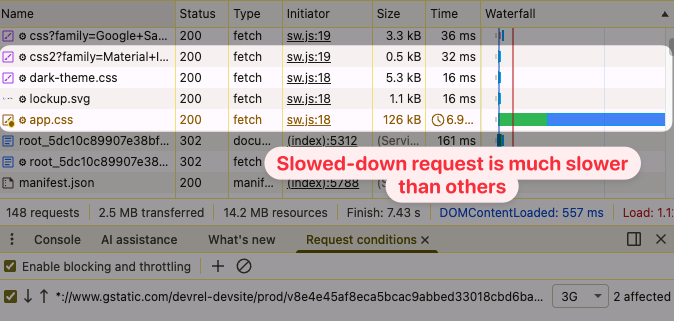
When reloading the page we can now see that this specific request takes a long time, while all other requests are still as fast as before.
How to delay a request by a fixed number of milliseconds
If you want to test what a website looks like before a specific request has finished it can be useful to delay the resource by a few seconds. Let's try delaying the web fonts on the Parcelforce website.
First let's pick one font file and throttle the request. Then we can edit the request URL pattern to *://*/*.woff so that it matches all Woff fonts.
We can then open the throttling speed dropdown and click Add.
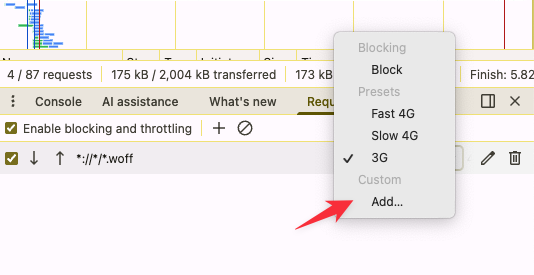
This takes us to the DevTools throttling settings where we can add a new network throttling profile.
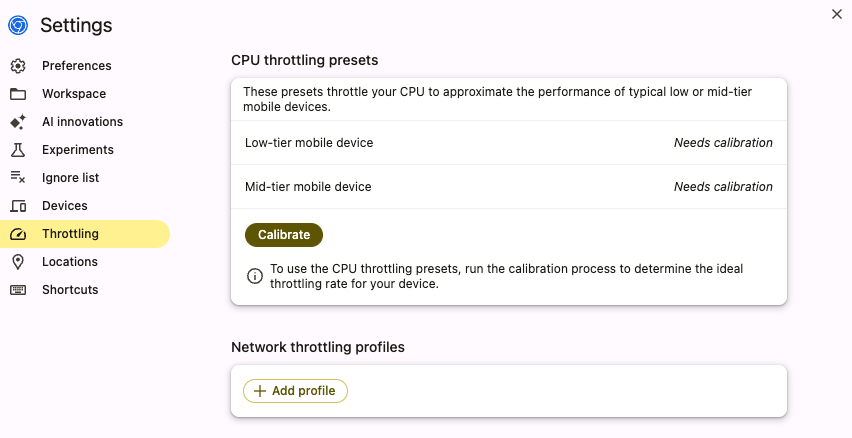
We can then configure what aspects of the network connection we'd like to throttle.
In this case we want to add a two-second delay, so we enter 2000 milliseconds in the Latency box.

Now when reloading the page it first renders with a fallback font. After two seconds the web font files load and the browser swaps the default fonts out for the custom fonts.
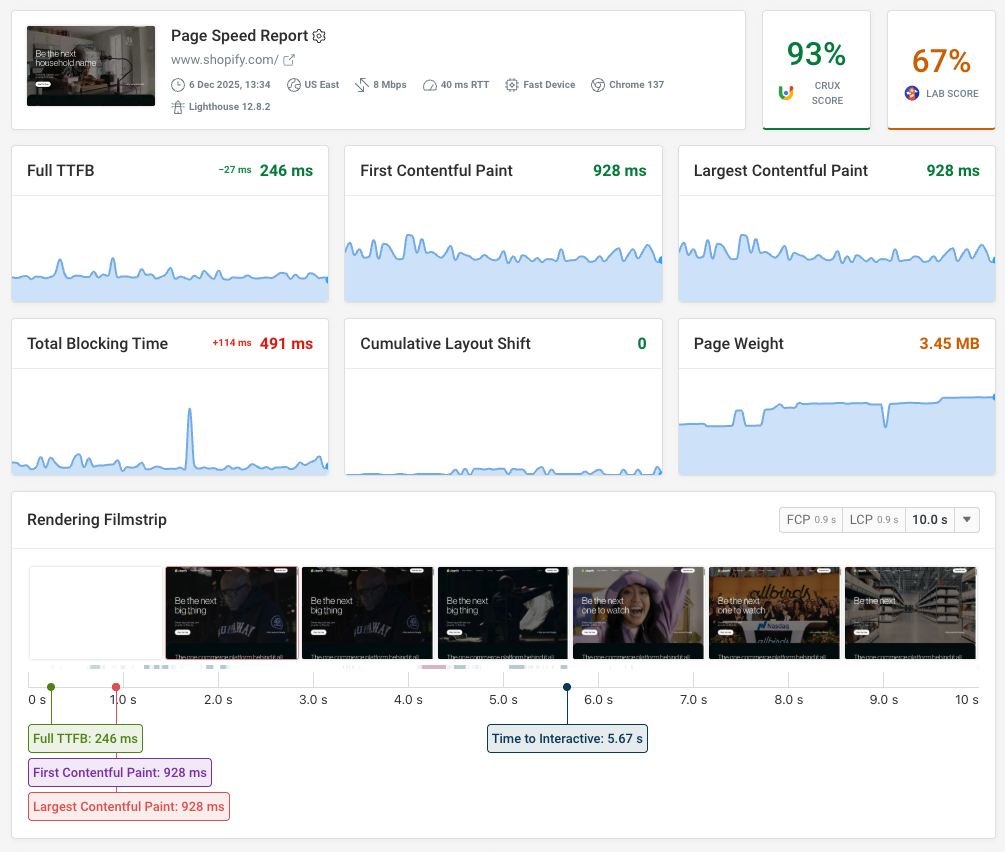
Collect in-depth web performance data
DebugBear tracks your website performance over time and provides in-depth performance recommendations.
Choose a specific network speed for your test runs, measure Google Core Web Vitals, and get alerted when there's a regression.
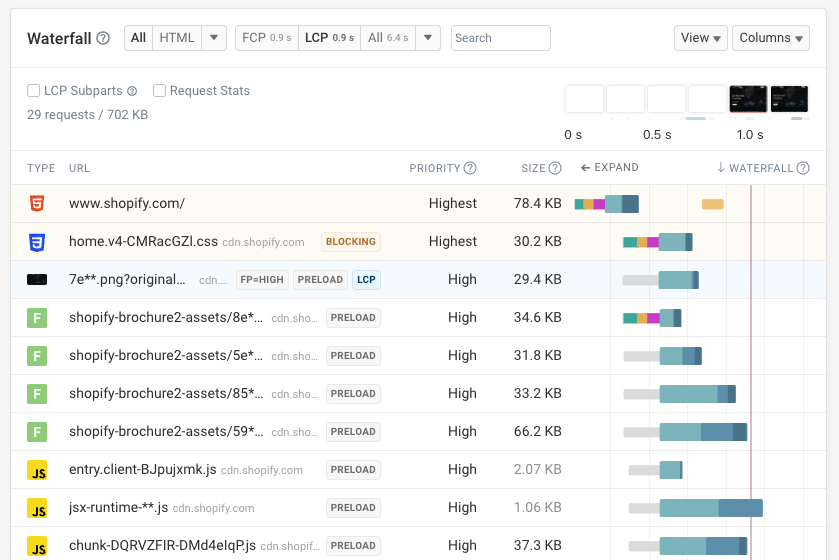
The request waterfall shows you when the browser requests different resources and how long they take to load.
Your bandwidth and latency settings impact how long it takes to establish server connections and download each resource.


Monitor Page Speed & Core Web Vitals
DebugBear monitoring includes:
- In-depth Page Speed Reports
- Automated Recommendations
- Real User Analytics Data