
The developer tools in Chrome let you inspect website content, view what files are loaded when visiting a page, generate detailed performance reports, and more.
This tutorial provides an introduction to Chrome DevTools and then takes a look at some more advanced features.
What is Chrome DevTools?
Google's Chrome browser includes a set of tools that's aimed primarily at web developers called Chrome DevTools. These tools provide a wide range of functionality, helping developers to:
- Inspect page behavior and fix bugs
- View errors reported by the page
- Measure page speed and find optimizations
- Simulate device size or touch interactions
Prefer Safari? Check out our guide to Safari's developer tool.
How to open Chrome DevTools
One easy way to open Chrome's developer tools is to follow these two steps:
- Right-click on the page
- Select Inspect in the menu
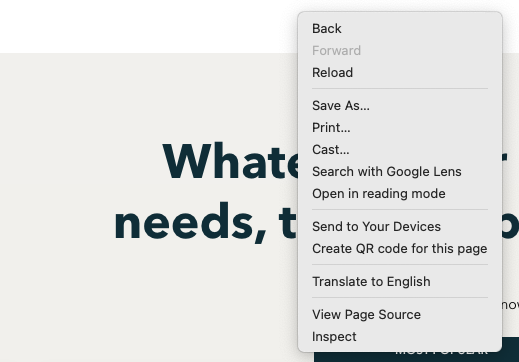
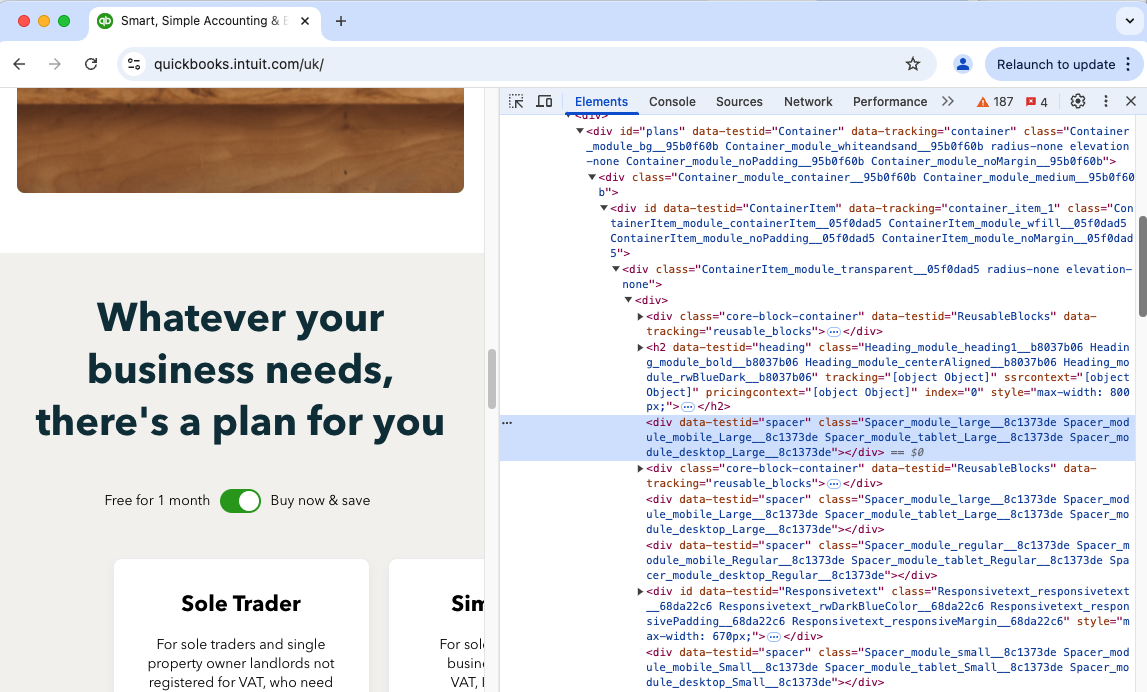
Chrome will then show a sidebar for the current page, showing tabs like Elements, Console, Sources, Network, and more.
Many websites are complex and Chrome shows a lot of information about them. If you're just exploring, consider starting with a relatively simple website. Otherwise, focus on specific questions you're trying to answer and what information you need to answer those questions.
Opening developer tools with the F12 keyboard shortcut
You can also open the DevTools using keyboard shortcuts:
- On Windows/Linux:
F12 - On Mac:
Fn+F12
Dock to bottom and undocking
Since DevTools displays a lot of data, it can sometimes be useful to undock it from the inspected page or dock DevTools to the bottom of the screen.
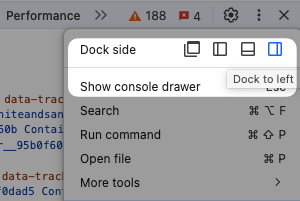
To change the docking side, you can click the three dots on the top right of DevTools and then select where you want to view the DevTools.
Elements tab: inspect the page
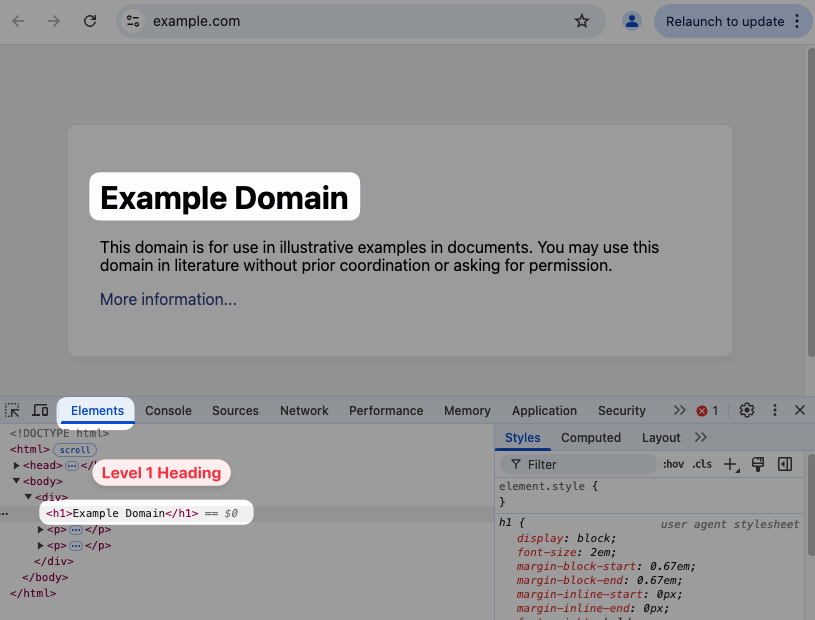
The Elements panel shows you the individual UI components that make up the website. Let's look at example.com to try this out on a simple website.
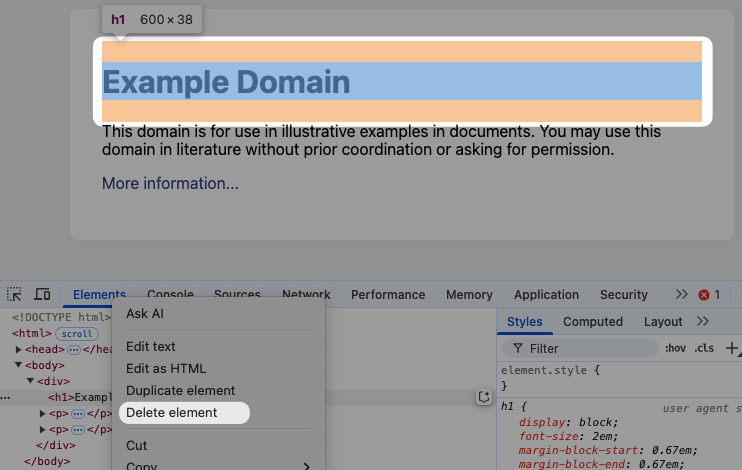
If we right-click the Example Domain heading and then click Inspect, we can view this particular page element in the Elements view.
We can see that it is an H1 element, the primary heading for content on the page.
The computer language used for website components is HTML, and the nested version of it that's shown in the Elements panel is called the Document Object Model (DOM).
Editing page content
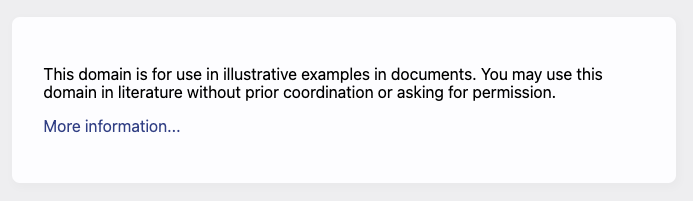
One handy feature of the Elements tab is that you can edit the elements that are displayed on the page. For example, if we right-click on the H1 element, we can click Delete element to remove it from the page.
Now we just see the description below the heading. On Windows, you can use Ctrl + Z to undo the change, or Cmd + Z on a Mac.
Changes you make on the page won't impact anyone else. Reload the page to reset it to the version of the website as it was published.
You can also edit text and other content on the page by right-clicking an element and selecting Edit as Text or Edit as HTML.
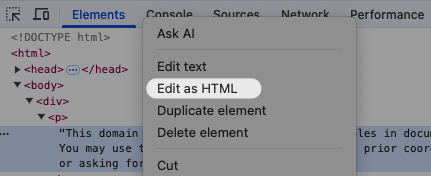
Let's edit the p element as HTML, insert the code below, and then click on another UI component in the Element tree.
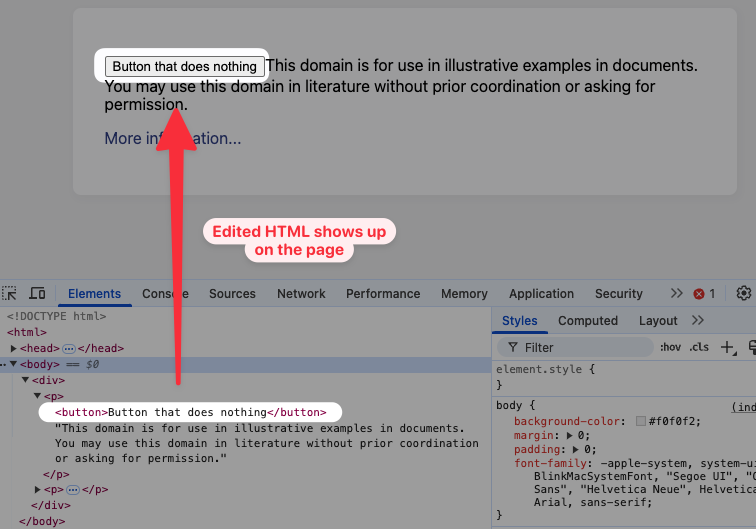
<button>Button that does nothing</button>
Now this button element appears on the page.
Editing element styling
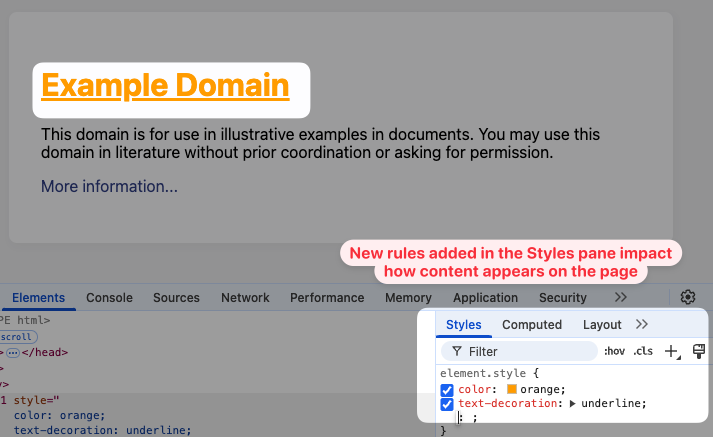
Websites consist of HTML content and CSS stylesheets that determine how that content appears. We can edit styles directly in the DevTools elements panel as well.
Select the h1 element and then open the Styles pane to the side or below of the element tree. Click between the two brackets following element.style. Then type in these styles:
color: orange;
text-decoration: underline;
After entering these CSS styles we can see that the way the heading is displayed has changed.
Network tab: view resources loaded by the page
The network panel tells you what files are downloaded by the page. Many websites consist of hundreds of separate resources, like stylesheets, images, JavaScript code, or fonts.
Each row shows one resource that's been requested by Chrome while loading the page.
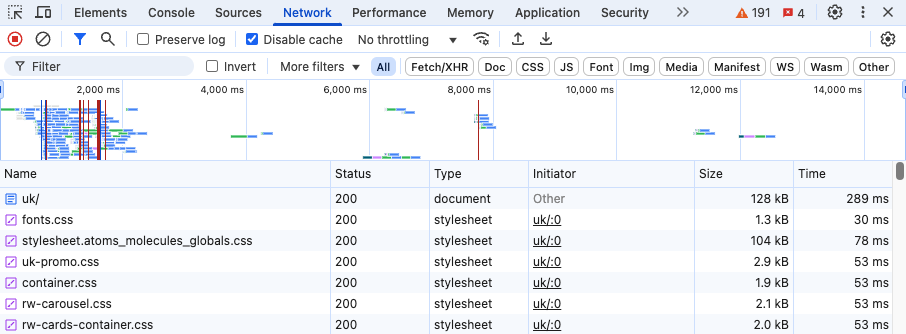
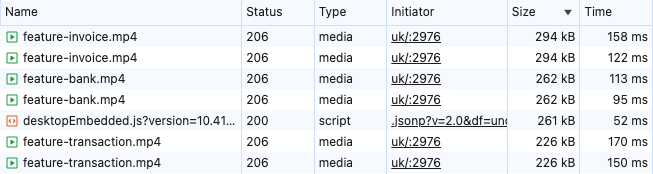
You can click on each of the column headers to sort the list of requests, for example by file size. Larger files take longer to download.
Viewing request details
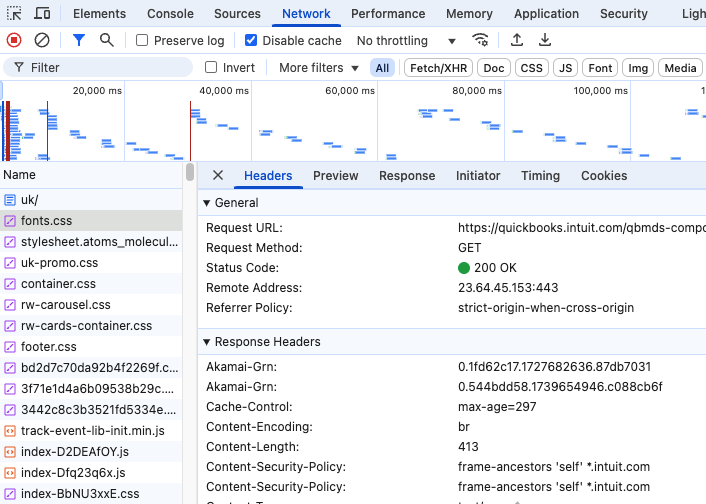
If you click on a particular request you can see more detailed information on it, for example the full URL or HTTP headers.
You can also see the server response, why the request was made (the Initiator), or how much time was spent on different aspects of the request.
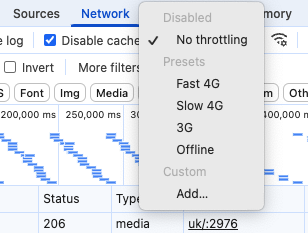
Throttling the network
You can also throttle the network connection by clicking on the No throttling dropdown, selecting a slower connection, and reloading the page. Click on Disable Cache to disable the browser cache and simulate a fresh visit.
If you're testing the page on a fast computer with a good internet connection, you can use the network throttling to see how a visitor on a slower connection would experience the website.
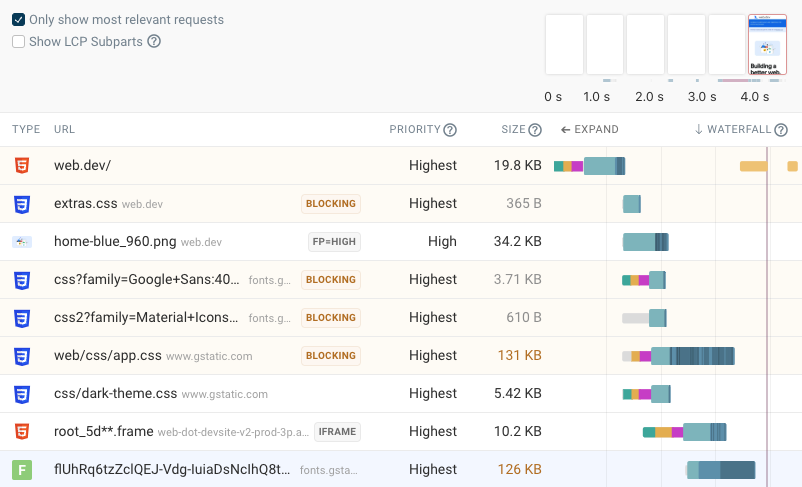
More detailed request waterfalls
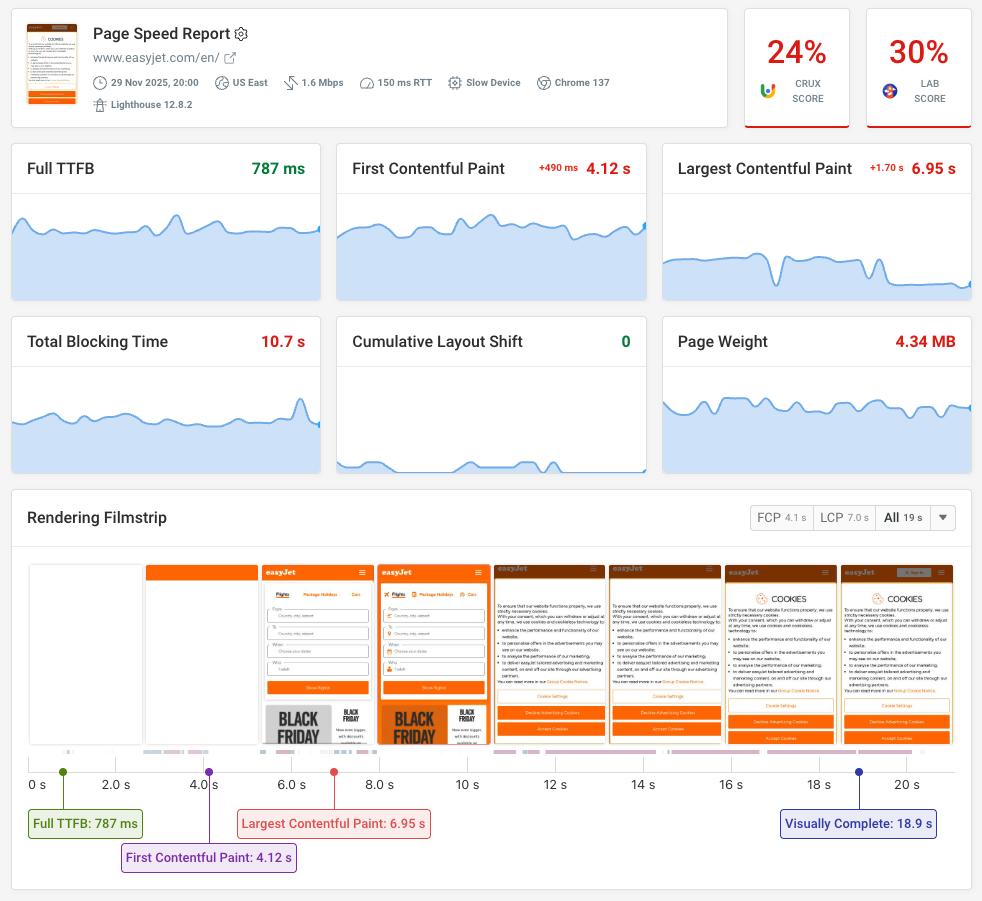
If you need a request waterfall that shows additional information on page load time, try DebugBear's free website speed test:
- Identify render-blocking requests
- See what image is required for the LCP
- Higher-quality network throttling
- Resource chunk timings for downloads
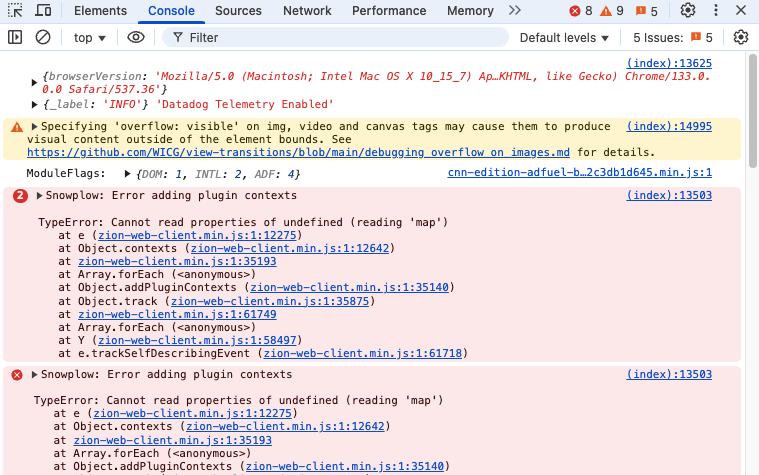
Console tab: view errors and debug messages
The Console tab lets you view messages generated by the page that can be used for debugging. That includes warnings added by the browser, reports of errors from running JavaScript code on the page, as well as any messages added by the website's developers.
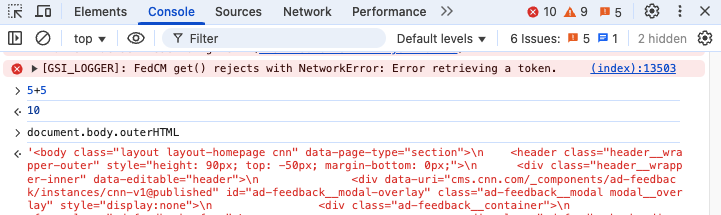
Running JavaScript in the console
You can also run JavaScript code commands directly in the console. That code can interact with the DOM, so if you want to see the page HTML you could type document.body.outerHTML and press Enter and Chrome will display it.
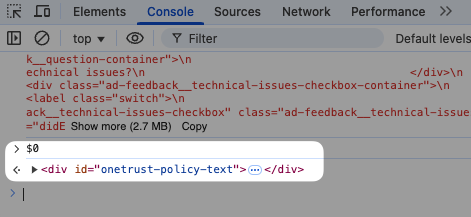
If you've inspected a page element using the Elements panel, you can use $0 to get a reference to that element. You can then use commands like this:
$0.textContentto view the text inside the element$0.style.backgroundColor = "red"to edit the element styling
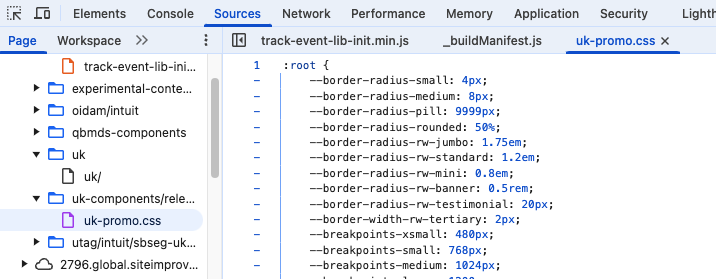
Sources tab: view source code and debug JavaScript
The Sources tab lets you see the source code behind the website. That includes HTML, CSS, and JavaScript code.
If you're looking for a specific file, the Open File dropdown is really helpful.
- Click the three dots in the left side pane of the Sources tab
- Click on Open File
Alternatively, use Ctrl + P to open the dropdown on Windows, or Cmd + P on Mac OS.
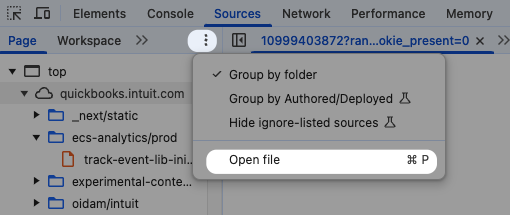
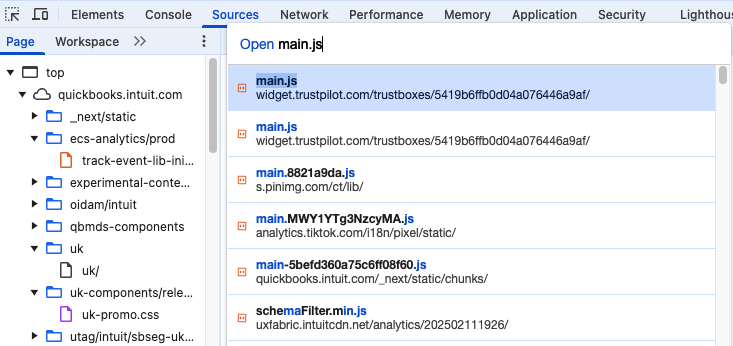
You can then type in the name of the file you're looking for and press Enter to view its source content.
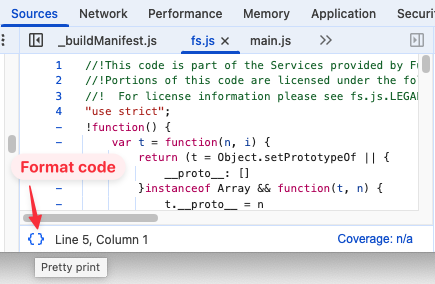
A lot of the code you'll see will be minified. That means its size has been reduced to speed up loading the source file, at the cost of readability.
You can somewhat counteract this by clicking the Prettify print icon, which cleans up the code formatting to make it easier to understand.
Using the Sources tab to debug JavaScript code
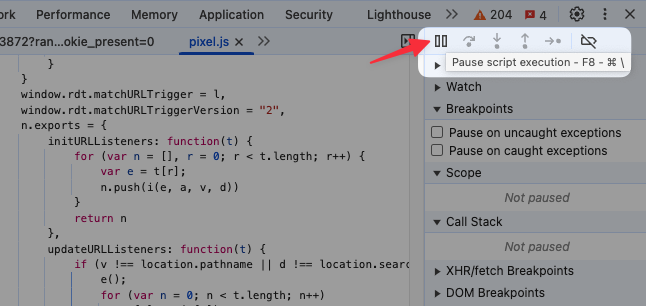
You can use the Sources tab to watch JavaScript code run line by line and see how it's processing data.
Click the Pause script execution icon to pause the next time code runs on the page.
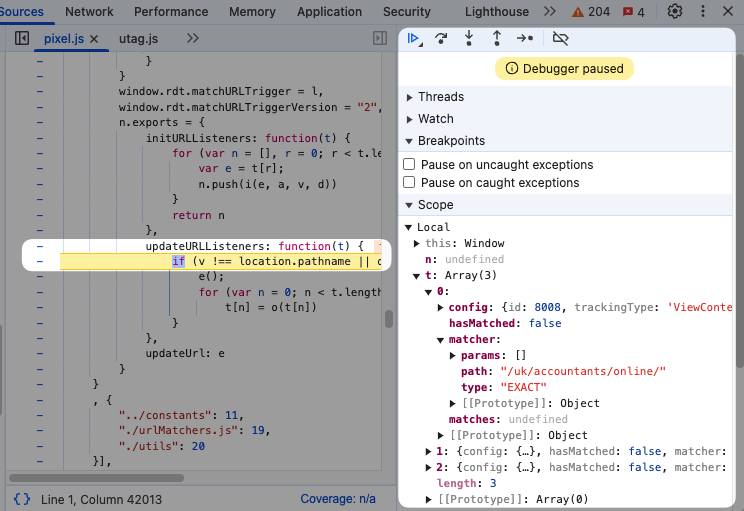
Once execution is paused Chrome shows you what code is currently running and the values of local variables.
To inspect variables in more detail you can expand items in the Scope section of the side pane.
Pausing execution is a great way to inspect your page as it's loading and debug performance issues on your website.
Stepping through code
Once you've paused execution you can use the control buttons at the top of the side pane to resume running the code, step through the code line by line, or step into specific functions to see what happens within them.
Setting breakpoints
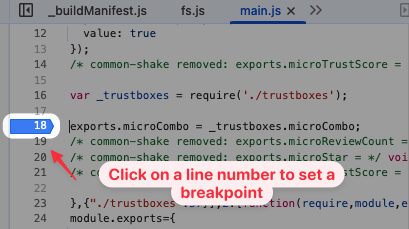
Pausing the code that's currently running can be useful, but more often you'll want to debug specific parts of your website's logic. Putting a breakpoint there means you can pause execution in the right place and inspect how the code runs.
To set a breakpoint on a specific line number, simply click on the line number in the Sources tab. Chrome will pause running code on your website the next time the code on that line runs. You may need to reload the page you're on.
You can also use the debugger statement in your own code to set a breakpoint.
Overriding source file content
DevTools includes a feature called local overrides, which makes it easy to try out website tweaks locally.
Right-click the file you want to edit and select Override content.
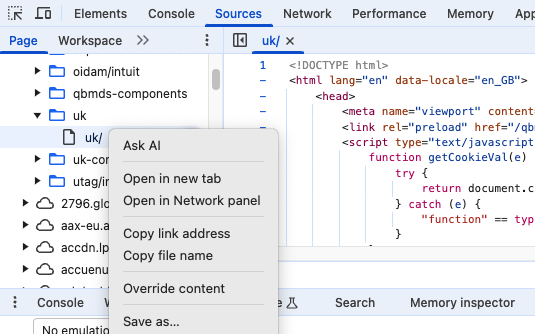
When first trying out local overrides you'll have to go through a few setup steps, for example defining a folder where file overrides are stored.
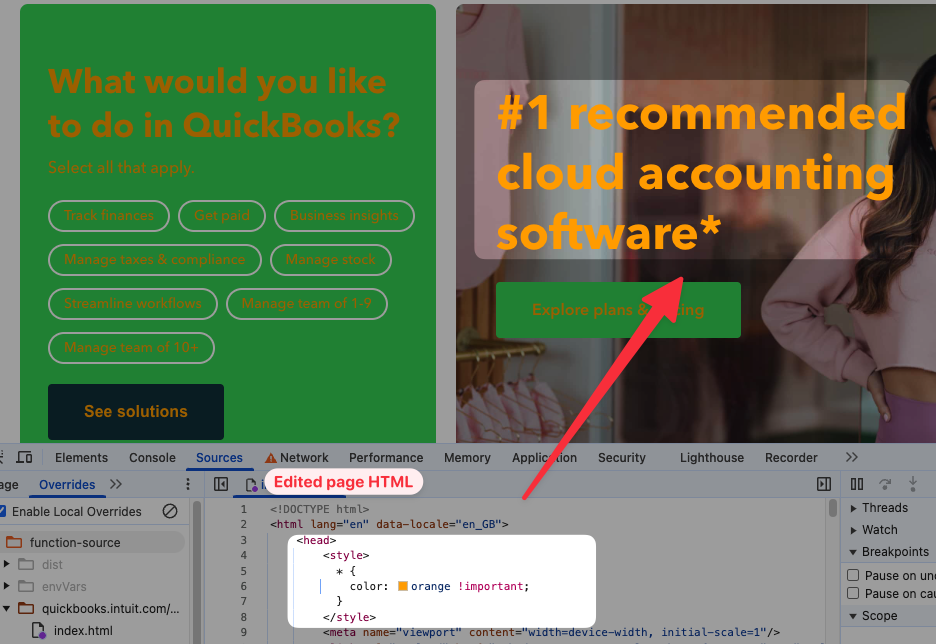
Then you can start making changes to the file. When reloading the page Chrome will then use the local response body instead of downloading the file over the network.
Here's an example where I've added a CSS style tag to the HTML.
Performance tab: debug page speed issues
The Performance tab lets you measure the speed of your website and understand how to optimize it.
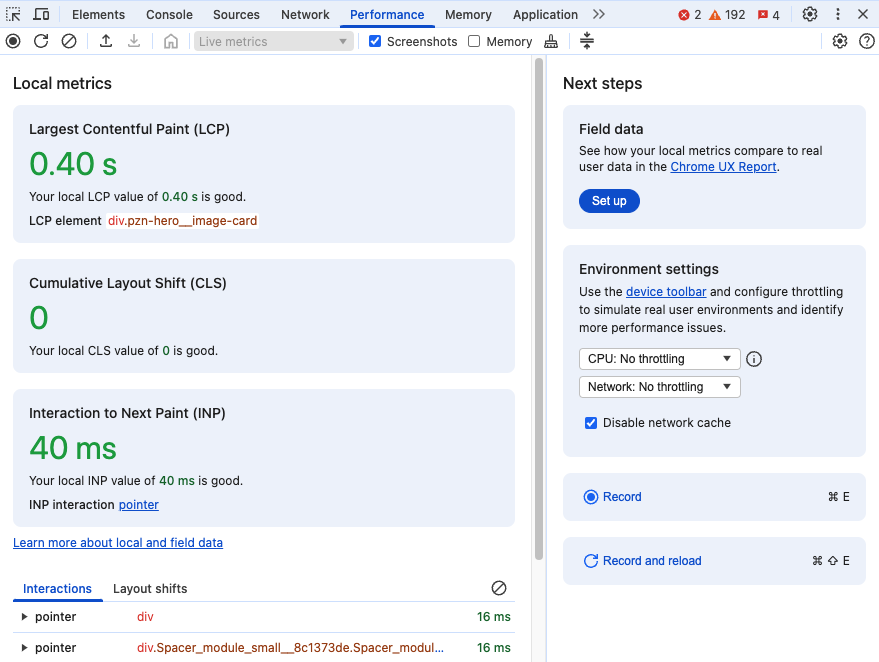
When you open it you'll see three key metrics about your site speed, called the Core Web Vitals metrics:
- Largest Contentful Paint (LCP): how long does your page take to load?
- Cumulative Layout Shift (CLS): does content move around unexpectedly?
- Interaction to Next Paint (INP): how quickly does the page respond to user interactions?
Under the LCP score you can also see what part of the page is the Largest Contentful Paint element. Click on it to jump to the Elements panel.
Recording a performance profile
If you click on the Record and Reload button Chrome will collect a performance profile: collecting detailed data on what's happening on the page while it's loading.
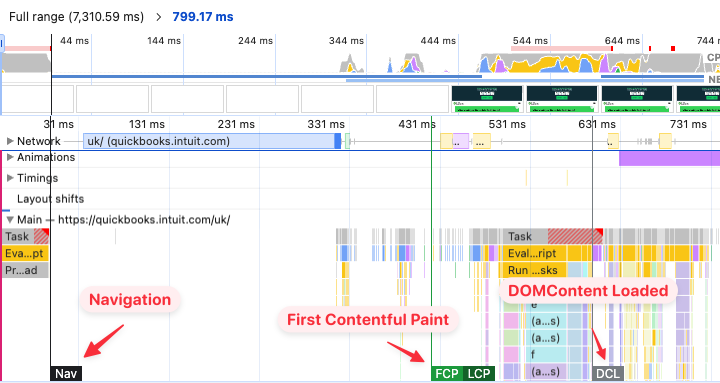
The result of this looks really complex! The profile shows a timeline where the left is the start of the navigation and the right is where the profile stopped.
We recommend checking out our article on Favorite DevTools Features of 2025 for more insights into the latest DevTools performance features.
There are multiple lanes with data on different aspects of performance:
- At the top you can see a chart showing overall CPU activity
- The filmstrip view visual loading progress as experienced by the visitor
- The network lane shows when different page resources are downloaded
- The Main thread lane shows detailed information on what code is running
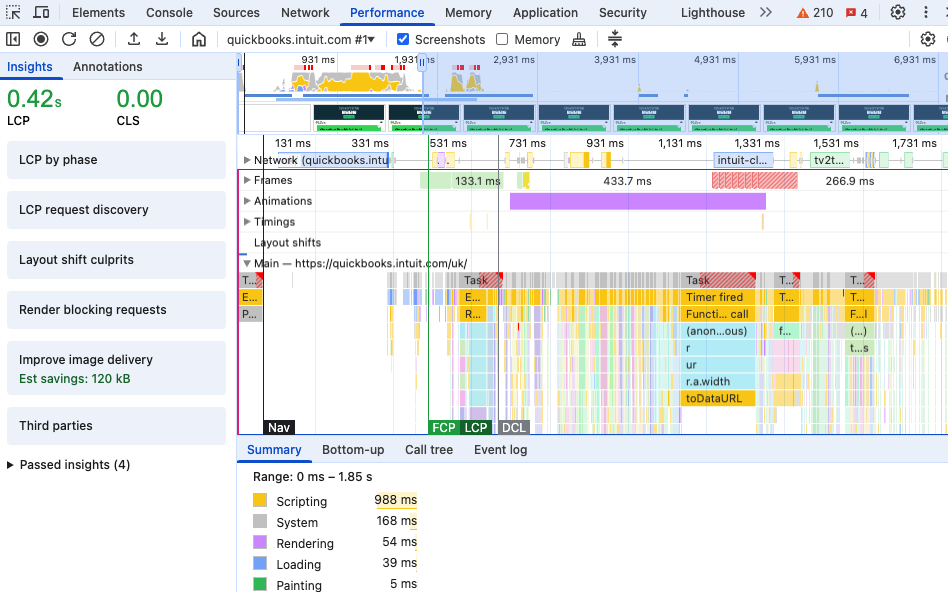
A starting point for interpreting the profile data is looking at when different page load milestones happen. In addition to the LCP metric we mentioned above, DevTools also shows the Load and DOMContentLoaded events fire.
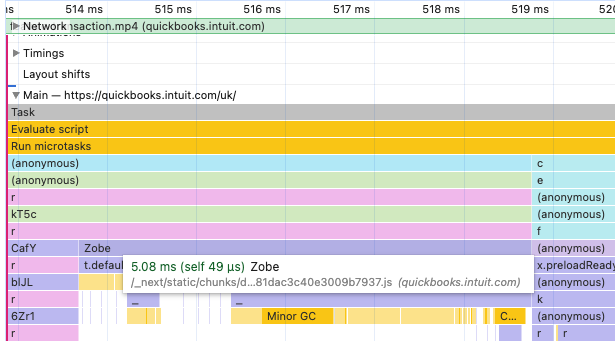
To debug CPU processing that's slowing down your website you can zoom in on the main thread section to view specific functions in your code that are taking a long time to run.
This view is super helpful if you want to reduce main thread work or speed up specific INP interactions.
Check out our detailed guide on how to improve website performance.
Application tab: inspect web app data and behavior
This tab goes beyond single page views and focuses on application state that's maintained across different navigations.
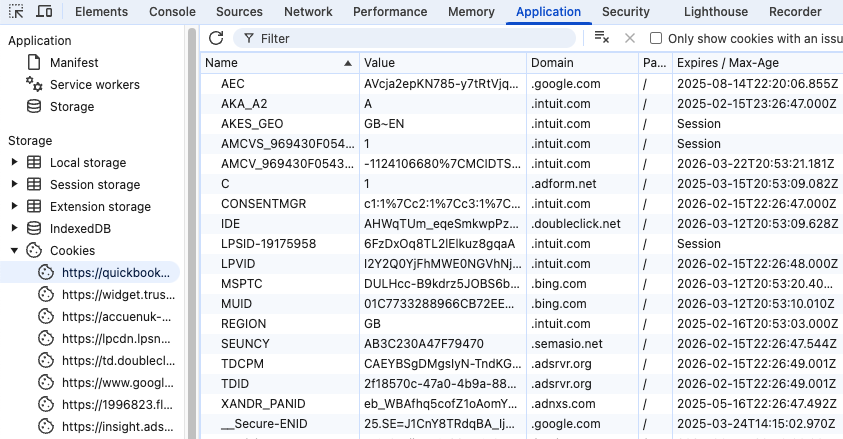
For example, you can see what data a website is storing on your computer. The screenshot below shows a list of cookies, but there are also other storage types like local storage or IndexedDB storage.
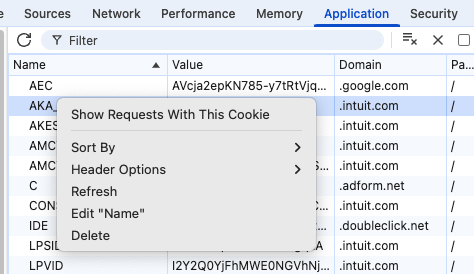
You can right-click each cookie to delete or edit it. You can clear all cookies to reset state on the website and view it as a new visitor.
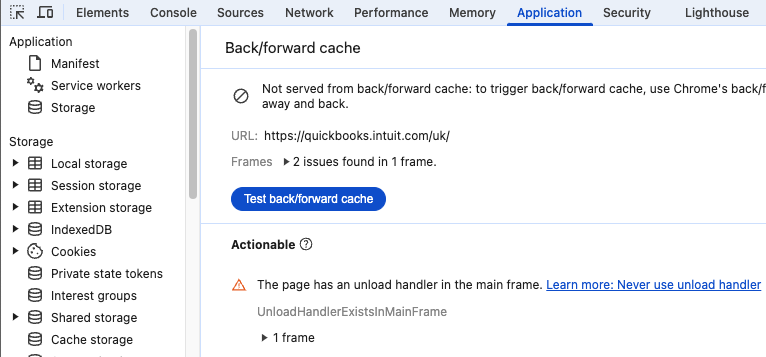
Testing the back/forward cache
Another aspect of navigating across your website is the back/forward cache. This cache allows the browser to restore the previously loaded page instead of loading it from scratch, allowing the page to appear instantly.
Some aspects of how your page is built can prevent this cache from working. Click the Test back/forward cache button to check your page and see what issues are preventing the cache from working.
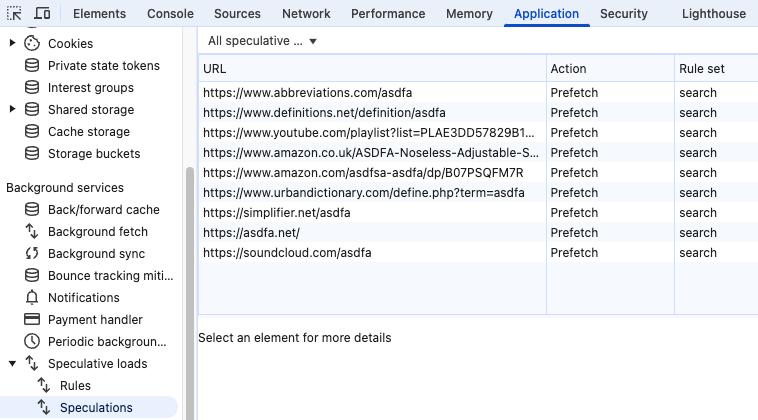
Debug speculation rules
Another feature of the Application tab is being able to view speculation rules that are active on your website, and if they are working correctly.
Here's an example showing various prefetched resources that are loaded when making a Google search. Google has written more about their use of speculation rules here.
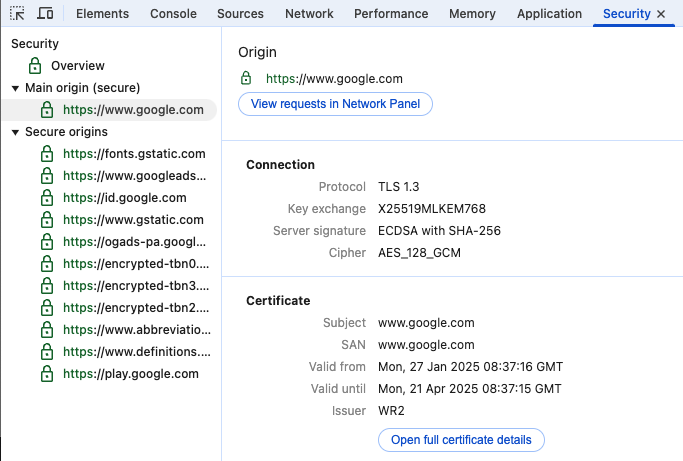
Security tab: view HTTPS certificate details
The Security tab shows you whether your website uses a security HTTPS connection, across different frames and resources loaded on your website.
You can also view details about each certificate, for example when it expires or what cipher it uses.
Lighthouse tab: audit your website
This tab lets you run Google's Lighthouse tool locally on your computer. Lighthouse is what also powers PageSpeed Insights behind the scenes.
Lighthouse audits your website across four categories:
- Performance
- Accessibility
- Best Practices
- SEO
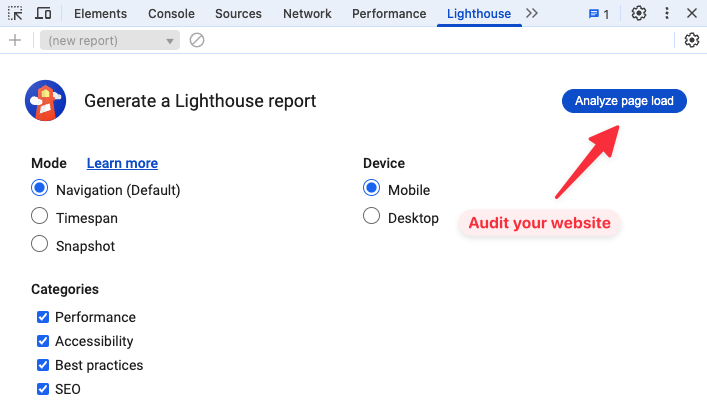
After clicking Analyze page load to run the test you'll get a score for each category.
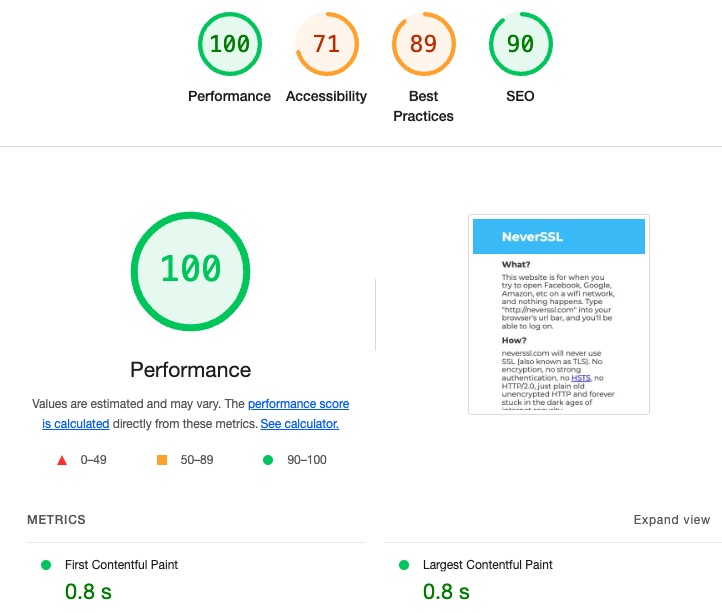
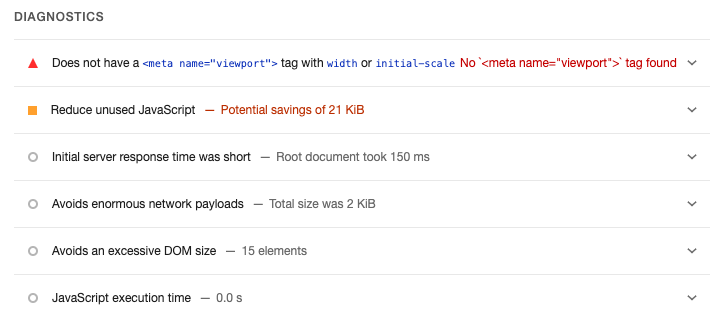
The Lighthouse report consists of different audits that assess a specific part of your website and provide guidance on how you can improve it. For example, you can see specific resources that are loaded or specific long script evaluation tasks that slow down the page.
Memory tab: debug memory leaks
The memory tab lets you see what on the page is using up memory on the visitors device and helps you identify memory leaks.
You can either track new page objects that are created or look at a heap snapshot that contains all memory objects on the page.
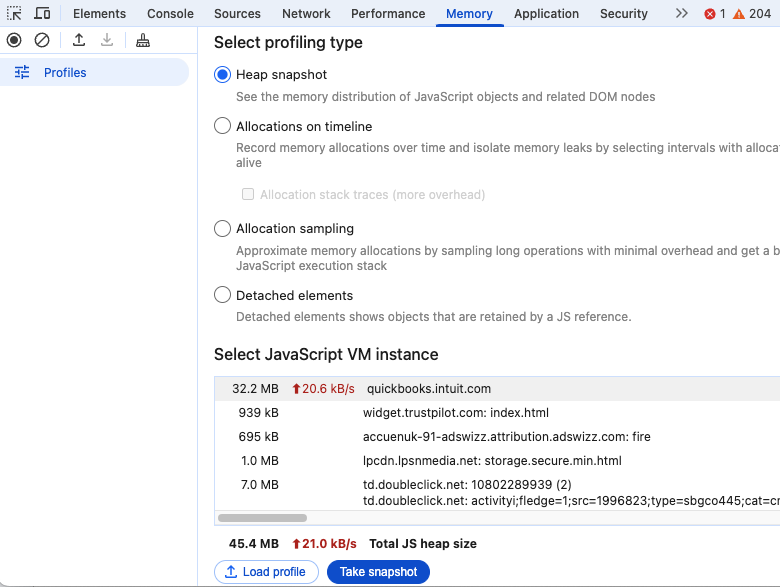
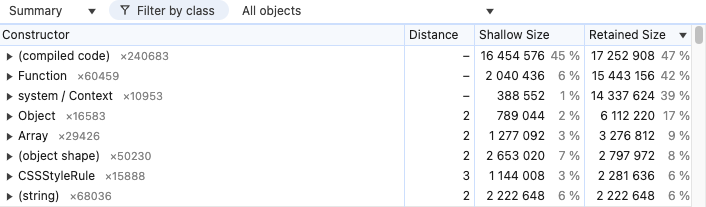
Clicking Take snapshot will show you a list of object types on the page, with the one that's using up the most memory shown at the top.
For example, here we can see that compiled JavaScript code is using up 16 megabytes of memory on the device.
The shallow size tells you how much memory is used by the object itself. The retained size also includes any other objects that are referenced by it.
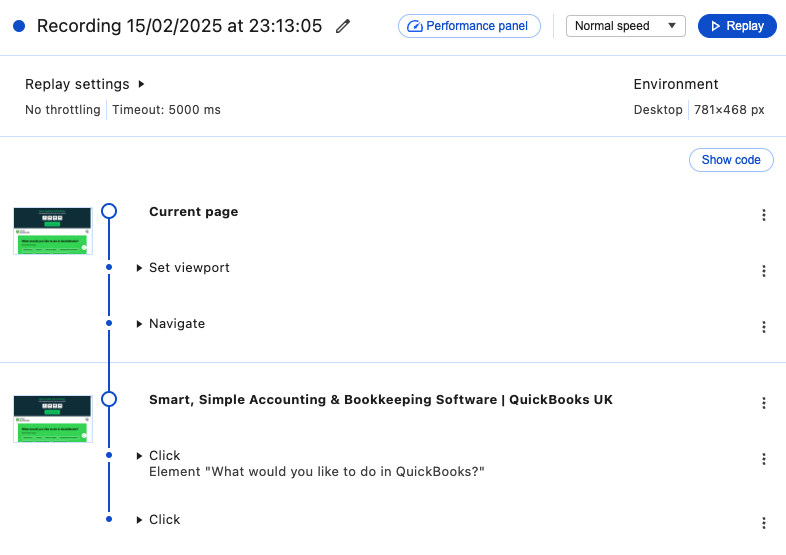
Recorder tab: record user flows
The recorder tab is currently a preview feature that's in active development. After starting a recording you can interact with the page. Chrome can then replay those interactions later on.
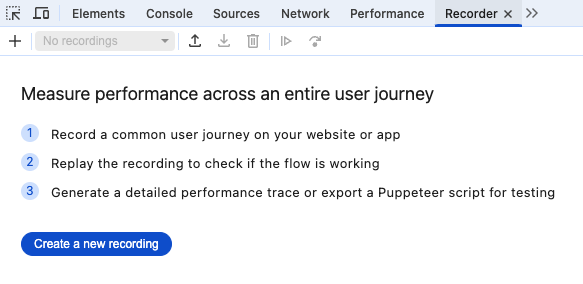
The recording consists of a series of steps like navigating to a URL or clicking on a page element. You can replay these while collecting a performance profile, and then check the measurements and debug data to see how you can speed up your website.
You can then export these recordings as Puppeteer scripts, for example for automated end-to-end testing.
CSS Overview
Another preview feature is the CSS Overview. It provides a summary of CSS code on your website, for example what colors or font sizes are used on the page.
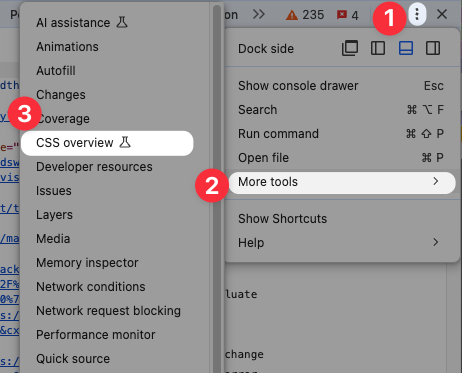
To open the CSS Overview:
- Click the three dots in the top right corner of DevTools
- Open More tools
- Select CSS Overview
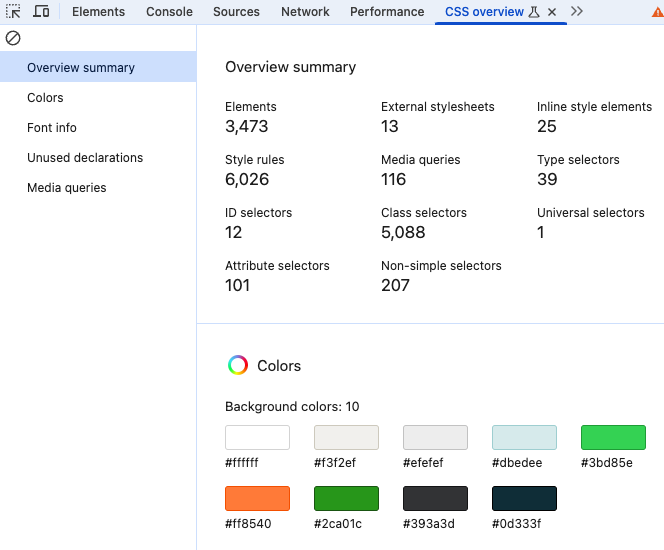
Click Capture overview to start analyzing the page. DevTools reports a number of statistics like the number of page elements, style rules, or media queries.
You can also see what color palette is used on your website.
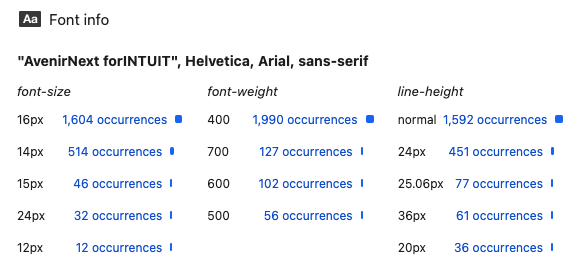
The font analysis shows how many elements use the font and what sizes and page weights are used.
One use case for this is identifying what your most common fonts are and then preloading those web fonts to ensure they show up quickly.
Code coverage
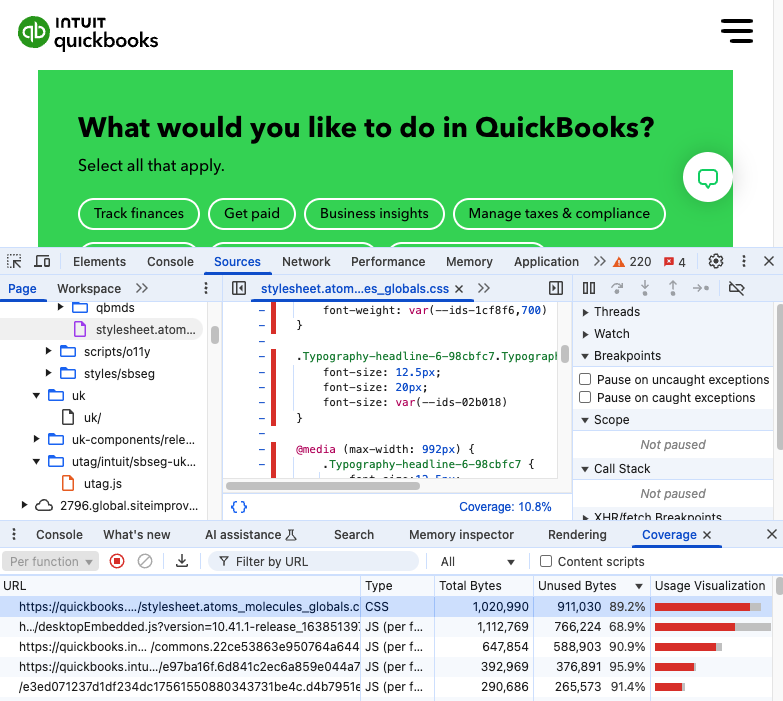
The Coverage tab in Chrome DevTools can tell you how much of the code that's downloaded on a website is actually being used when loading the page. You can use this information to reduce unused JavaScript code or remove unused CSS.
Each script or stylesheet has a usage visualization column indicating the percentage of code in that file that was necessary to display the page contents.
Click on each file URL to get an annotated view of the file, showing which lines are used or unused.
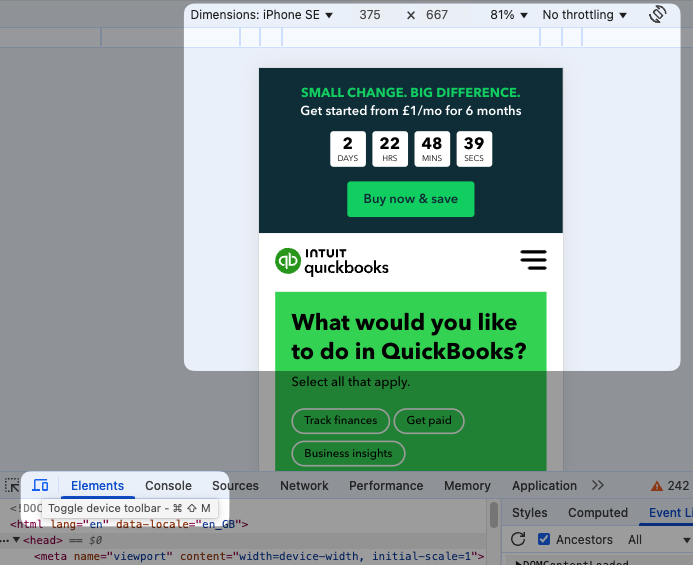
Mobile device emulation
The device mode in Chrome DevTools allows you to test mobile or tablet viewports while running Chrome on a desktop device.
To enable it, click on the device icon in the top left of Chrome DevTools. This button will toggle the device toolbar and start emulating a mobile device.
You can also use DevTools to test on a real device using remote debugging.
Hidden useful features
DevTools provides a lot of helpful features that don't get their own tab. Let's take a look at a few of them.
You can access these via the DevTools command menu. Open the command menu with Ctrl + Shift + P on Windows or Cmd + Shift + P.
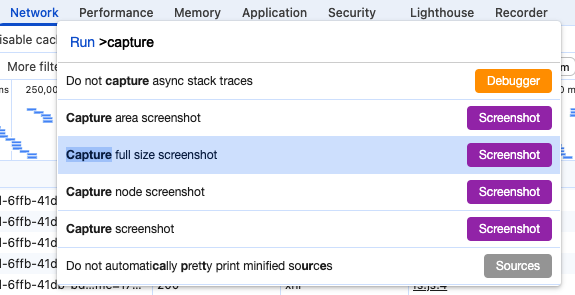
Capture screenshots
Chrome provides a number of options to capture screenshots of the current page. Open the command menu and search for "capture" to see the available screenshot options.
For example, you can capture a full size screenshot that includes all content on the page. That's super useful if you're reviewing page content or want to compare your site before and after a design change.
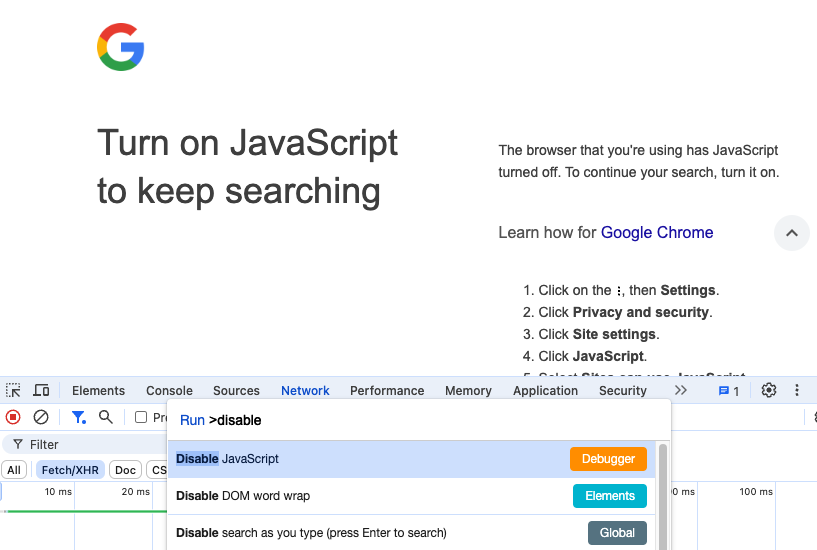
Disable JavaScript
Testing your website without JavaScript is useful to see how JS impacts your page speed and if your website is working well if JavaScript is disabled or takes a long time to load.
Search for "Disable JavaScript" in the command menu, then reload the page.
If you want a quick way to test your website without JS, try our free NoScript tool.
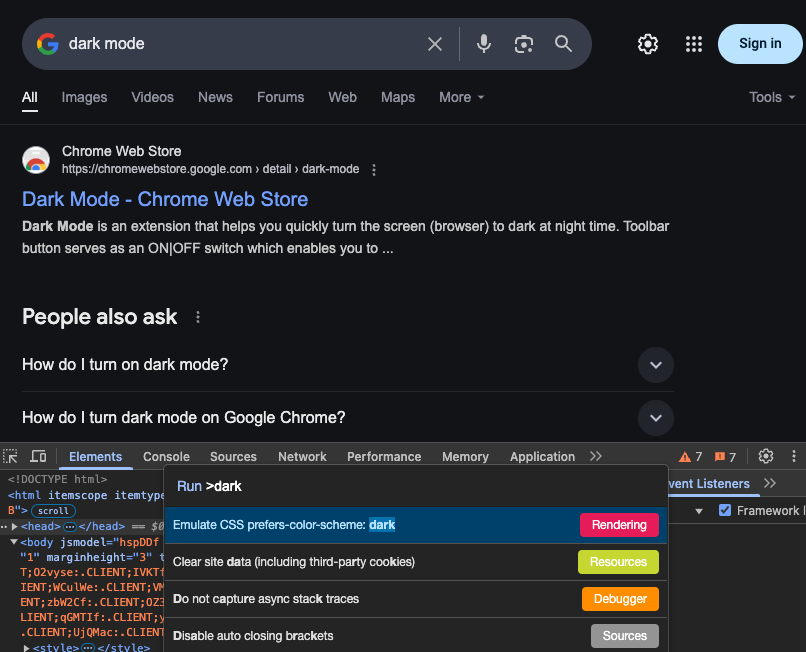
Dark mode
DevTools includes two great dark mode features: switching DevTools to dark mode and testing websites with a dark color scheme.
To enable dark mode in DevTools, run the Switch to dark mode command.
When working on dark mode features on your website you can use the Emulate CSS prefers-color-scheme: dark command. If the page uses the CSS prefers-color-scheme media feature it will then switch over to a dark theme.
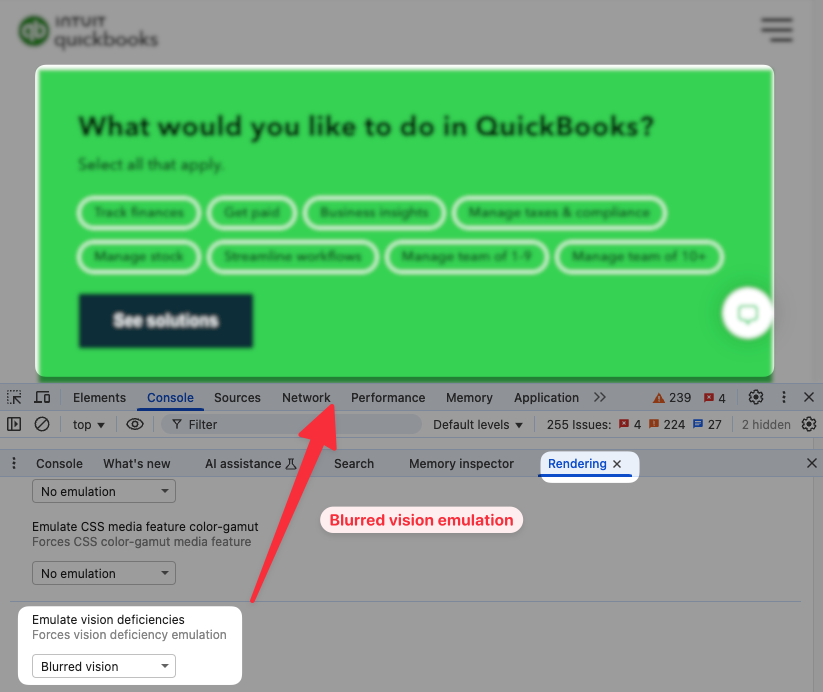
Emulate vision deficiencies
Chrome can emulate a number of vision deficiencies so that you can check if your website is still accessible.
You can find it via More Tools and the Rendering tab, or directly via the command menu and search for "Emulate deuteranopia (no green)" or other options.
Here's an example of a page with blurred vision emulation enabled.
Code search
You can also search the full source code of HTML, CSS, and JavaScript files on the page. To start, enter Show Search into the command menu. Then enter your search term and press Enter.
Chrome will show you all instances of that search term and you can click on them to open them in the Sources tab.
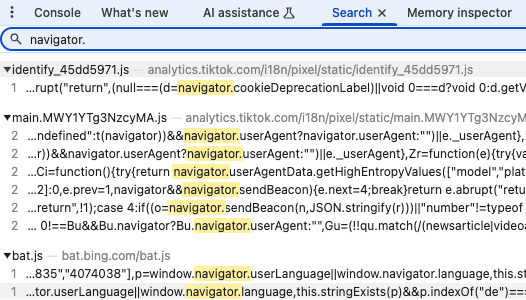
One great use case for full text search is if a website is loading a resource that's not referenced in the HTML. You'll usually be able to find it referenced somewhere in a JavaScript file, helping you understand how to avoid loading it or optimize its loading speed.
Want to improve your website speed?
If you're working on your website speed, DebugBear website performance monitoring can help you keep track of your metrics and identify new opportunities for optimization.
Continuously track loading speed in lab-based tests, and debug slow page interaction with real user monitoring data.
Each test result provides an overview of your page speed and what it means for users.
You also get detailed technical reports, including request waterfalls, data from Google's Chrome UX Report, as well as in-depth analysis of HTML and CSS file size.
Sign up for a free trial to start monitoring and optimizing your website today.


Monitor Page Speed & Core Web Vitals
DebugBear monitoring includes:
- In-depth Page Speed Reports
- Automated Recommendations
- Real User Analytics Data