
Nobody likes waiting for websites to load. But what causes slow website performance, and what can you do about it?
In this article we'll look at 13 steps you can take to make your website faster. But first, let's take a look at what website performance is all about and how we can measure page speed.
What is website performance?
Website performance measures how fast your website is. Most importantly, how long does your website take to load?
Sometimes when a visitor clicks a link on Google or elsewhere, the next page appears almost instantly. Other times visitors wait a long time for the contents of the next page to load.
Different web performance metrics indicate how soon after navigation various page load milestones happen.
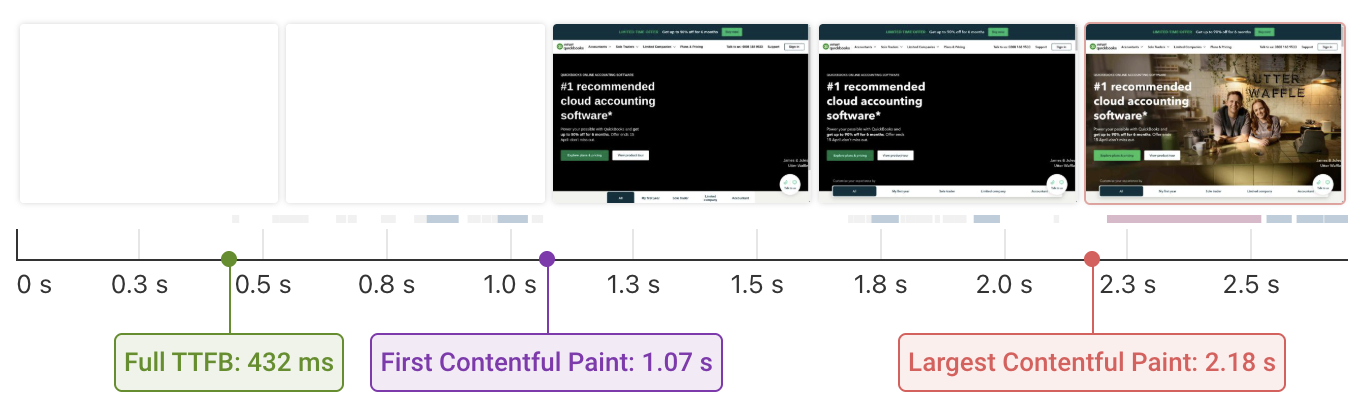
The page load process often consists of multiple stages where page content gradually appears.
Why is website performance important?
Ultimately, a fast website is about providing a better user experience. Visitors who spend less time waiting to see your content will be more engaged, more likely to navigate around your website, and more likely to convert to paying customers.
But Google also uses page speed as a ranking factor. Making your website faster can help you get more organic search engine traffic.
According to Google, a good website loading time is below 2.5 seconds. Wait times up to 4 seconds are still okay, but Google considers anything above that poor.
How to measure website speed
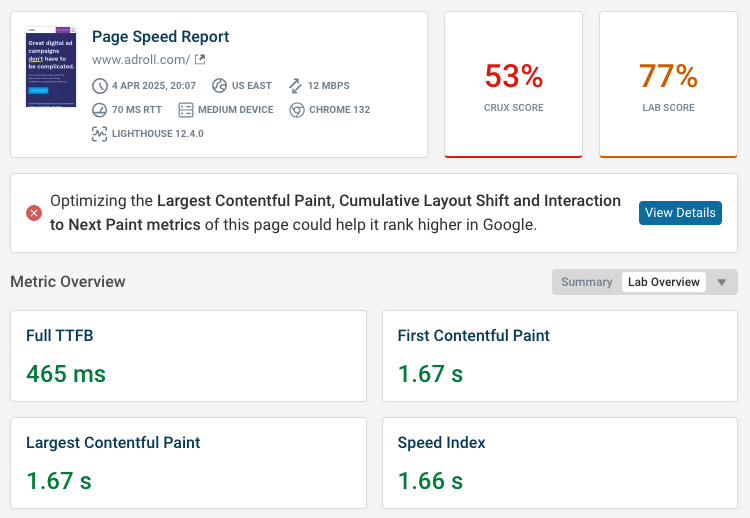
A lot of automated tools can measure page load time and find ways to improve it:
These tools will assign a rating to your website, point out performance metrics you should improve, and provide additional debug data to help you improve your page speed.
What is the best metric to assess page speed?
There are many different ways to measure page load time, for example First Contentful Paint or Speed Index. However, for the last few years Google has focused on the Largest Contentful Paint (LCP) metric.
LCP measures how soon after navigating to a page the main content element appears. Specifically, that means the largest element on the page, usually text or an image.
What's the best strategy to improve website speed?
Effective website performance optimization consists of two key strategies:
- Using automated tools to identify and test high-impact optimizations
- Analyzing request waterfall data to understand why content loads when it does
There are many techniques to make your website faster. Using tools to detect and try out optimizations is often easier than manually checking for ways you can speed up your site.
This article provides an overview of some of the most common causes of poor website performance and what you can do to fix these issues.
Best practices to improve website performance
Fast websites avoid loading unnecessary resources, make sure resources can be loaded quickly, and are built so that only the most critical resources hold back rendering.
Let's look at the most important best practices to speed up your website.
1. Optimize server response time
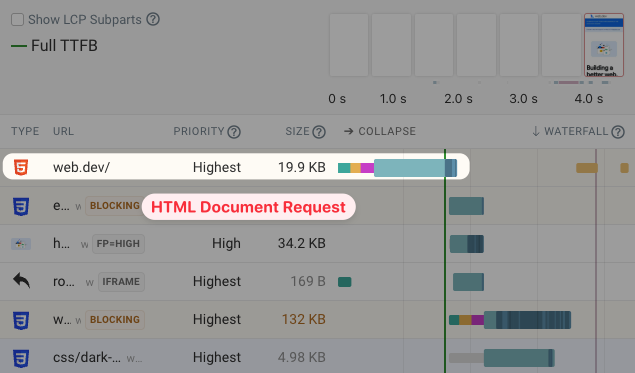
The first step to loading any website is downloading the HTML document from the server. Improving initial server response time is important, as other resources can't start loading until after the HTML has loaded.
A poor server response time is indicated by a high Time to First Byte metric value.
If there's nothing you can do to speed up response time, consider using 103 Early Hints to start loading other important resources before the HTML is ready.
Server-side optimizations
To improve server response time you need to profile your backend application code to see what's causing delays.
- Is the hosting environment not powerful enough?
- Is a lot of time spent processing data and rendering HTML?
- Are database queries slow?
- Is the response delayed by third-party API requests?
Use a Content delivery network
Outside of applying optimizations to your server code, you can also use a Content Delivery Network (CDN) to improve performance. A CDN provides a global network of servers as well as built-in tools to speed up asset delivery.
With a CDN you'll get two key performance benefits:
- Server connections will take less time to establish, as the CDN has servers close to the visitor
- CDN caching lets you cache some responses on the CDN so they can be served without contacting your server
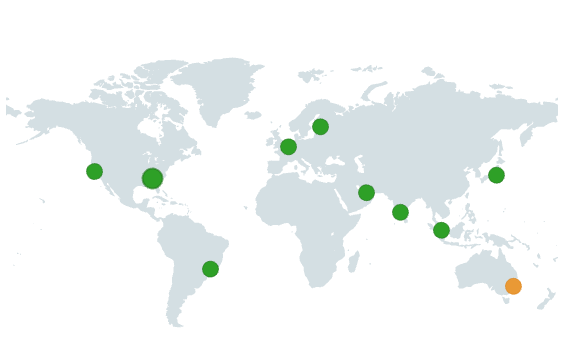
Run a global TTFB test to see how the speed of your website varies across the world.
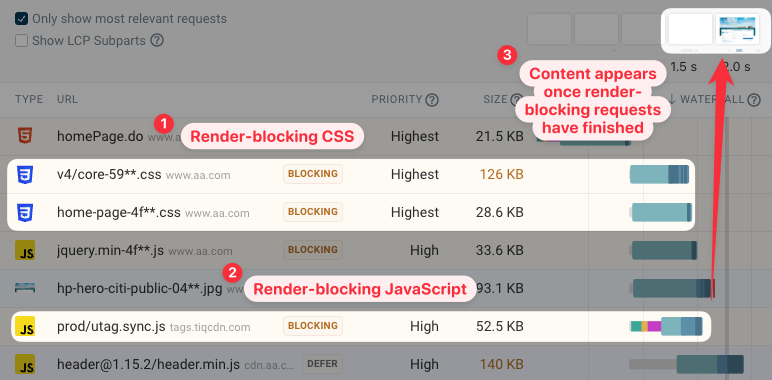
2. Reduce render-blocking resources
Once the HTML document has been loaded, the next step to display the page content is loading other render-blocking resources. That includes CSS stylesheets and some JavaScript code.
Browsers don't display page content until after render-blocking requests are complete. You can see that in the request waterfall below. The filmstrip just shows a blank page until the render-blocking utag.sync.js file has finished loading.
Defer JavaScript files
HTML <script> tags are render-blocking by default, but usually JavaScript files don't need to block rendering. Instead you can defer running JavaScript code with the defer attribute. Then the page content can render even though the scripts are still loading.
<script src="jquery.js" defer />
3. Optimize image files
While the Largest Contentful Paint element can be a text element, LCP images are typically the cause of poor performance. That's because high-quality images tend to be large and slow to download.
To find out what the LCP element is on your website, run a test with DebugBear and click on the Largest Contentful Paint metric heading. If the LCP element is an image you can also see additional details for the image request, like the file size and download duration.
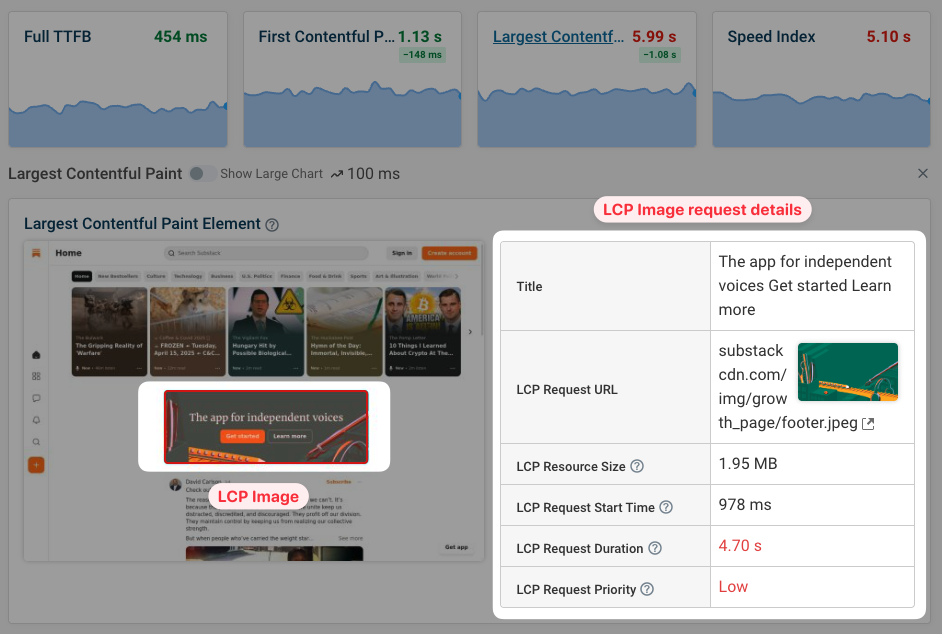
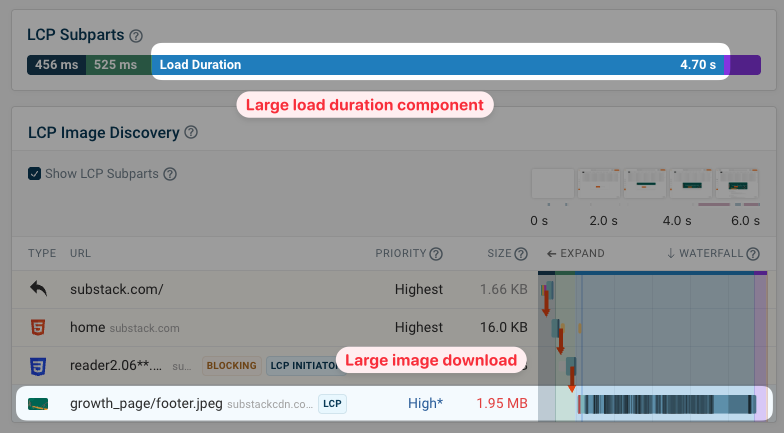
You can also see that most of the page load delay comes from the Resource Load Duration component of the LCP metric.
In this case the image is almost 2 megabytes large, and downloading the image accordingly takes 4.7 seconds.
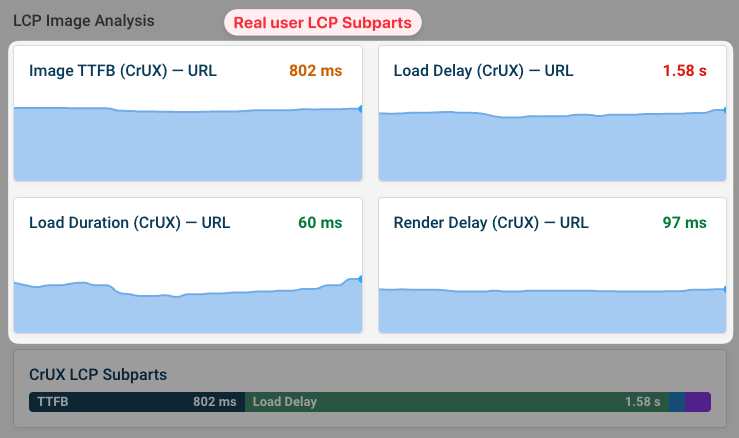
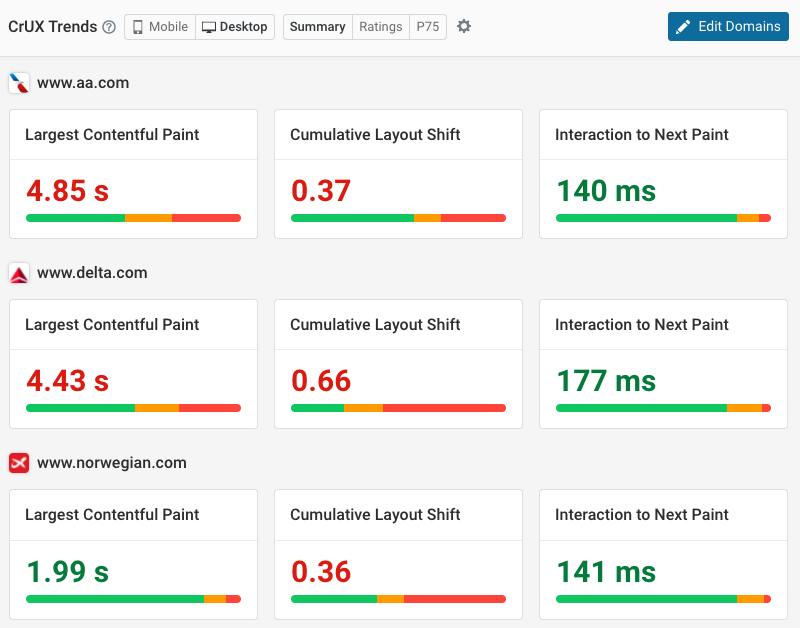
Get more insight into LCP images with CrUX data
If you're wondering if the synthetic page speed test result matches what real users are experiencing, you can check the data Google publishes as part of the Chrome User Experience Report (CrUX).
It includes data on the LCP subparts, which tell you what's really holding back loading the LCP image on your website.
How to reduce image file size
You can take a few concrete steps to optimize your images:
- Use a modern image format like WebP or AVIF
- Serve images at an appropriate size
- Set a quality level to balance quality and file size
Image optimization tools like Squoosh or Optimizilla make it easy to compress your images so they can load more quickly.
4. Prioritize important content
Every request made by the browser has a request priority from Lowest to Highest. Render-blocking resources are high priority, while for example deferred JavaScript is low priority.
Chrome also has a particular way to prioritize image resources. The first 5 images are medium priority, images in the viewport are high priority, and other images are low priority.
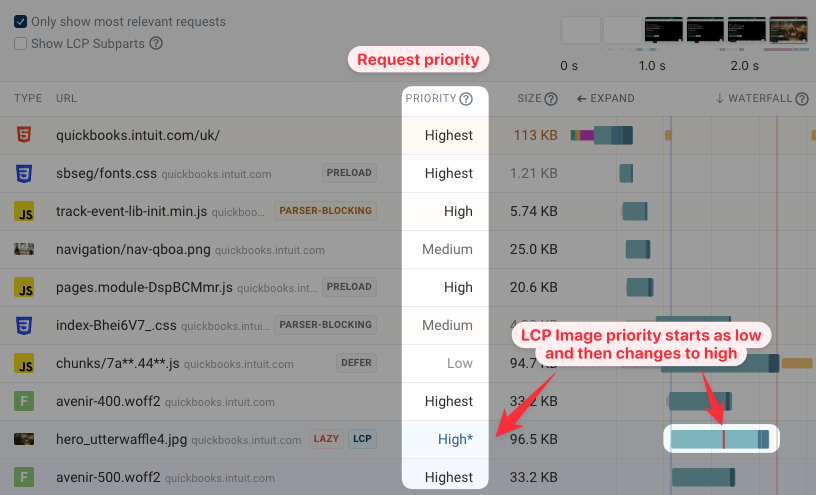
The screenshot above shows an LCP image with a priority change from Low to High. The red bar on the request waterfall entry indicates when the priority change takes place.
Why does the priority change? It's when Chrome renders the page and realizes that this image is in the viewport.
Loading the LCP image with low priority means that the request will be made later than it should be, and bandwidth may instead be used to load other resources.
Optimize image loading with the fetchpriority attribute
If you know that an image is important you can add the fetchpriority="high" attribute to its <img> tag.
<img
  fetchpriority="high"
  src="https://quickbooks.intuit.com/oidam/intuit/hero_utterwaffle4.jpg"
/>
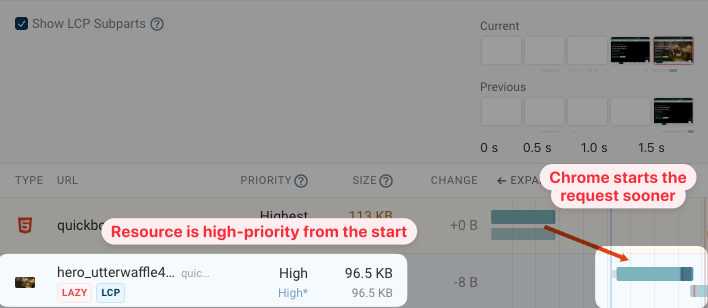
In DebugBear we can run a page speed experiment for this change to see how it impacts the Largest Contentful Paint score. In this case, the page now loads almost a full second faster.
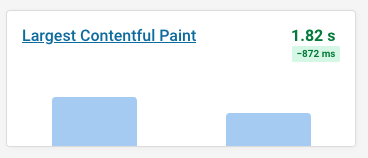
If we take a closer look at the comparison of the request waterfall, we can see that the LCP image request now starts a lot earlier. It also takes over 200 milliseconds less time than before.
Check that your website server correctly supports HTTP prioritization. Otherwise it may send low-priority resources at the same time as critical page content.
5. Delay loading unimportant resources
The fewer resources you fetch during the initial page load, the less different resources will compete for bandwidth. As a result, the resources that you actually need to load will download more quickly.
Browsers automatically reduce the priority for less important resources. For example, when you defer a JavaScript file that will reduce its request priority.
You can also use the fetchpriority="low" attribute to mark resources that are not essential early on to render the page.
Lazy-loading images that you know are below the fold with loading="lazy" lets you avoid unnecessary image requests entirely, until they are actually needed to render page content.
Be careful to not lazy load all images, as that means you'll also lazy load the LCP image, slowing down your website.
6. Ensure key files are discovered early
Sequential request chains are a common cause of poor performance. Instead of loading the document and then immediately loading all other resources necessary to render the page, the first set of requests instead triggers other critical requests.
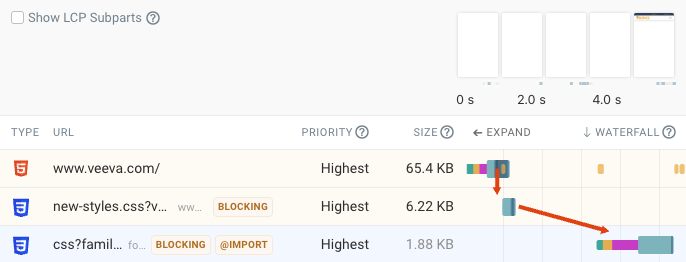
Here's an example of that: the browser doesn't know about the LCP image until after the CSS stylesheet has finished loading.
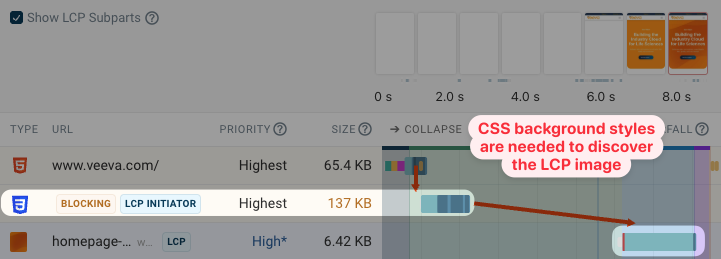
On that same page we also find another sequential request chain, this time due to a CSS @import statement.
That further delays the background image, because the browser doesn't know it needs to style the LCP element until the page has rendered. The imported stylesheet is render-blocking, introducing an additional delay.
For best performance, all other critical requests should be triggered directly by the document HTML.
What can we do to fix this issue?
- We can avoid using
@import, or preload the second stylesheet from the HTML code - We can preload the LCP background image
Adding this code to the page HTML should have a big positive performance impact:
<link
  rel="preload"
  href="https://www.veeva.com/wp-content/homepage-hero-mobile.jpg"
  as="image"
  fetchpriority="high"
/>
<link
  rel="preload"
  as="style"
  href="https://fonts.googleapis.com/css?family=Roboto:200,300,400,500,700"
/>
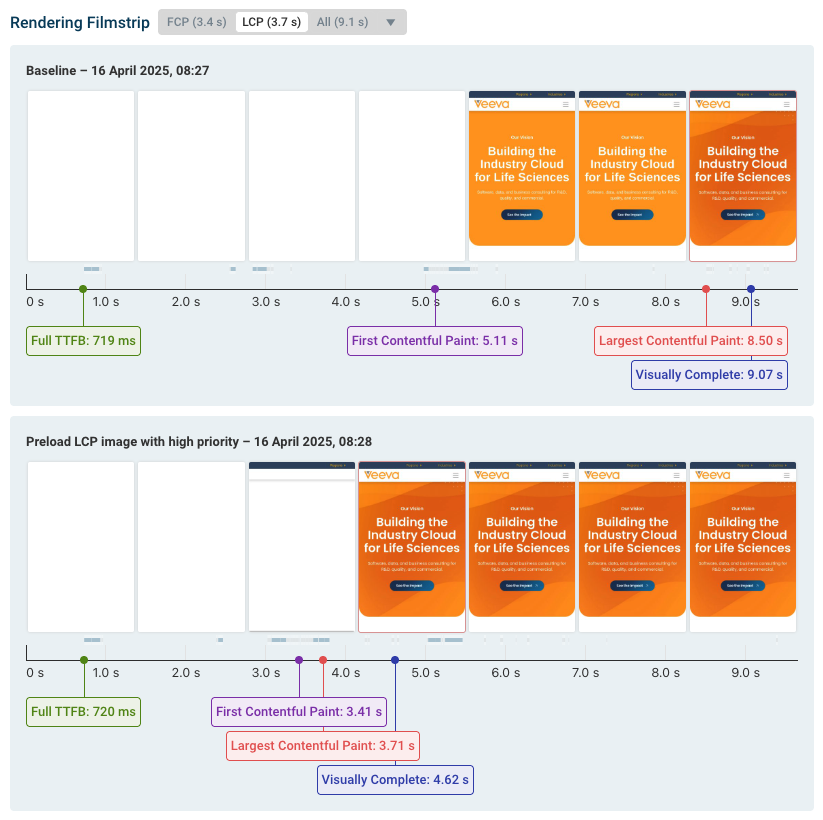
If we run this as a DebugBear experiment, we can see the before and after rendering filmstrip. Both the First Contentful Paint and Largest Contentful Paint metrics are much better now. Content starts to render sooner and it renders with the background image right away.
7. Optimize font loading
In addition to optimizing images, you also need to make sure that text shows immediately after the page starts rendering. This can be tricky as many websites use web fonts that need to be downloaded first, but you can do two key steps to improve font performance:
- Ensure text remains visible during load with
font-display: swap - Preloading web fonts so they aren't part of a sequential request chain
Avoid excessive web font preloading
Preloading fonts is usually a good practice, but it can also make performance worse if you preload too many fonts or if the font files are too large. Browsers can prioritize these fonts over important render-blocking resources.
You can see an example below, where a website preloads over 30 different fonts, with some of them being over 300 kilobytes large. As a result, the page renders a lot more slowly.
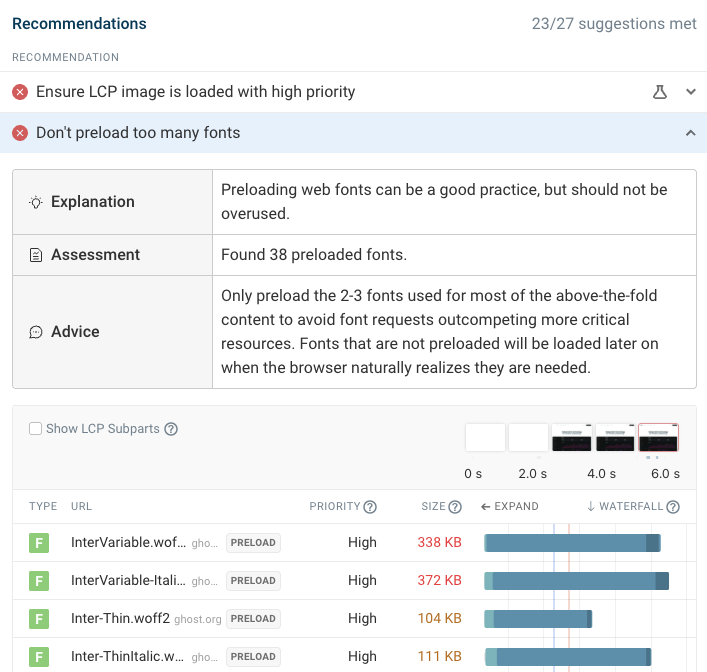
Only preload the 2-3 most important fonts on your website. Each font file should be less than 100 kilobytes in size.
8. Ensure visitors can see content once key resources have loaded
Normally visitors can see your page once all render-blocking resources are loaded. However, sometimes page content is hidden or requires additional processing before it appears.
For example:
- Anti-flicker snippets can make content invisible until A/B tests are loaded
- Single-page apps require additional processing and data fetching before content renders
- CSS animations can delay when content becomes visible.
If your website uses a JavaScript framework to render page content, make sure that server-side rendering is enabled.
Here's an example of a website that's hiding all page content. Even though all CSS has loaded, visitors wait several more seconds before content becomes visible. In a page speed test, this would show up as part of the LCP render delay component.
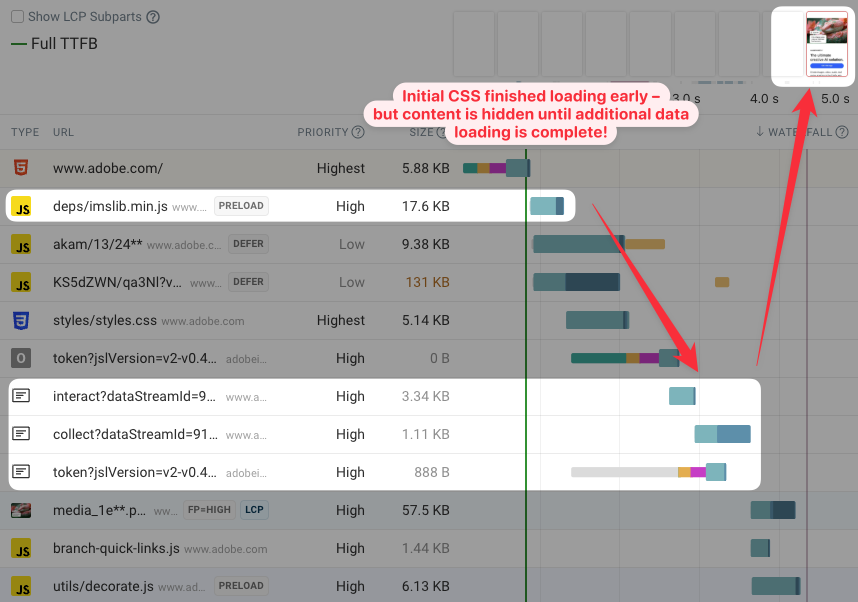
The page contains a typical anti-flicker snippet, where the whole body or html HTML tag is hidden.
<style id="ims-body-style">
  body:first-of-type {
    opacity: 0.01 !important;
  }
</style>
You can often avoid hiding content entirely, or be more selective and hide only specific page elements that are impacted by JavaScript-driven content updates.
9. Speed up JavaScript code and CPU processing
Most JavaScript code can be deferred and shouldn't impact the initial load of your website. However, it's not always possible to delay loading all scripts, and running this code can delay the website's rendering process.
The DevTools performance tab can give you a lot of insight into what CPU processing tasks are slowing down your code.
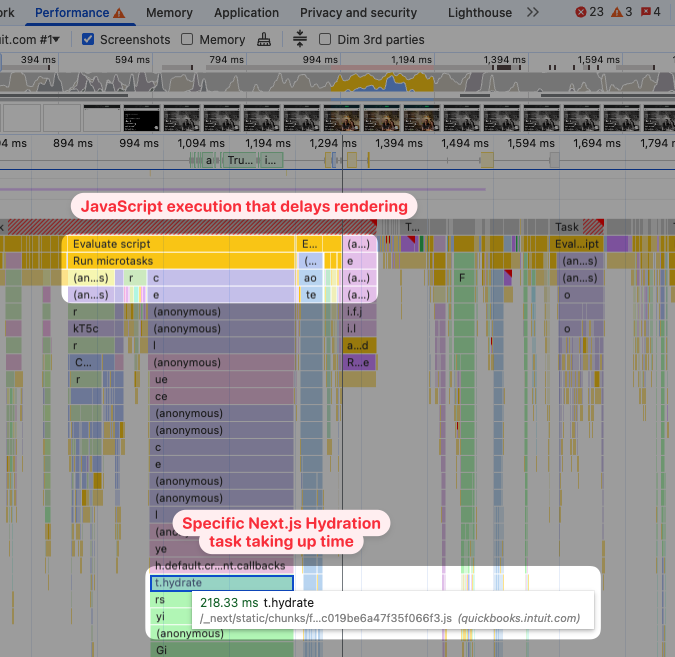
In this example, the JavaScript hydration task is blocking the CPU and causing the page to render more slowly.
If your website is a single page application, check out our guides to React performance, Next.js performance, and Nuxt performance.
How to reduce CPU processing
To speed up CPU tasks on your website, you can:
- Identify tasks with Chrome DevTools and then optimize them
- Reduce DOM size to speed up rendering
- Review third-party scripts on your website
- Remove unused JavaScript from your page
10. Optimize HTML, CSS, and JavaScript file size
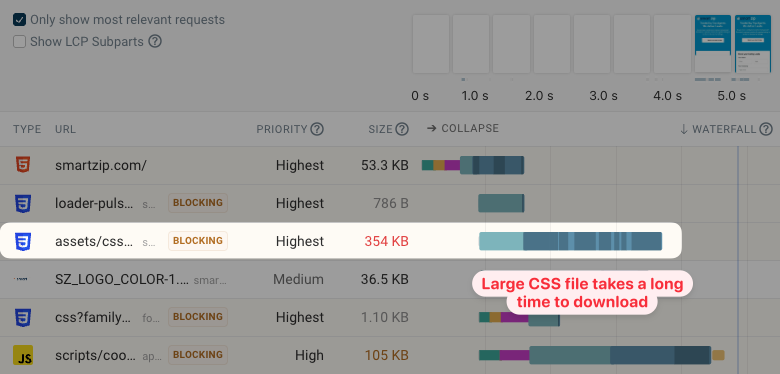
Larger files take longer to download, causing slower website speed. You can see that in this request waterfall, where a 354 kilobyte CSS file takes 2.8 seconds to load. During this time, rendering is blocked.
Text files like HTML or CSS have specific techniques you can apply to reduce their size:
- Use lossless text compression like Gzip and Brotli
- Minify CSS and JavaScript files
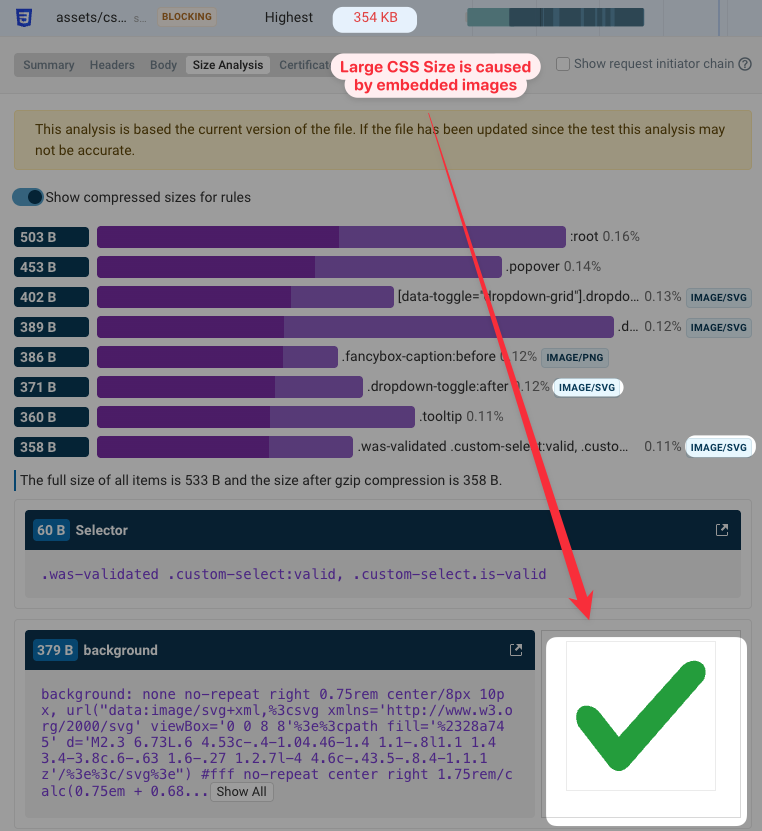
One common reason for large code files are images or fonts embedded as Base64 data URLs. DebugBear can help you identify these with the Size Analysis feature. Expand the request list in the test result and click Size Analysis to view it.
11. Cache static content in the browser
When a visitor first comes to your website, the browser cache won't contain any saved content yet, and all resources need to be loaded over the network. However, if you serve website assets with an efficient cache policy, the browser can save them for later visits and navigations on your website.
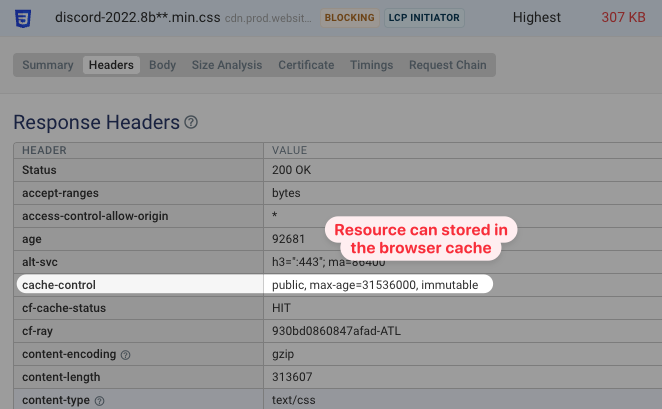
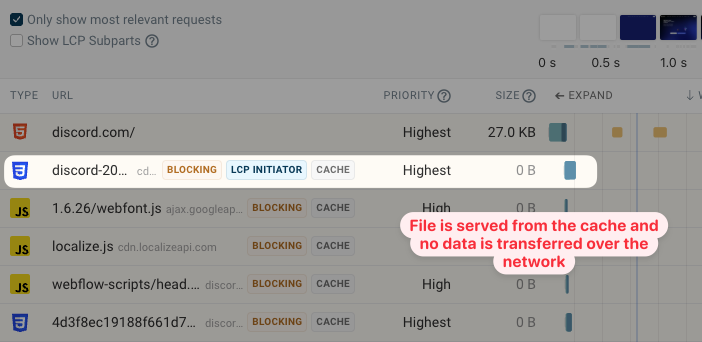
Servers can indicate that a resource can be cached in the browser using the cache-control HTTP header. In this case, the file can be cached for up to one year (31,536,000 seconds).
If we then test a second load of the page, we can see that the CSS file now loads quickly from the cache and no data needs to be downloaded over the network.
12. Cache back/forward navigations
Website visits often aren't simple and unidirectional: there are different types of navigations. Visitors reload pages to get up-to-date data, or navigate back to the previous page.
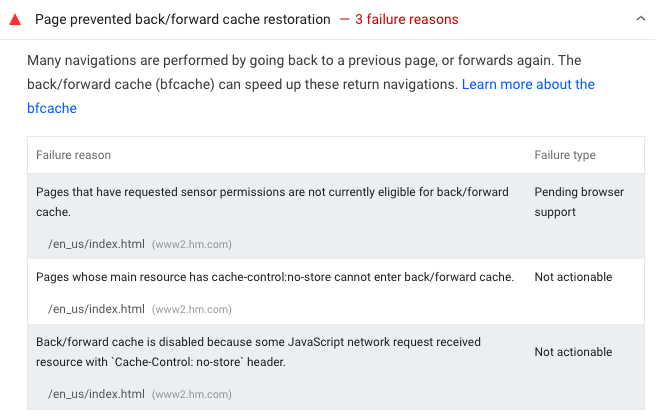
Back/forward navigations should usually feel instant because browsers can store the page in the back/forward cache.
However, sometimes browsers can't restore pages from the cache, either for security reasons or due to technical limitations. Tools like Lighthouse can tell you whether your page prevents back/forward cache restoration, for example due to a cache-control: no-store header.
13. Speed up later navigations
After landing on your website, many users will start interacting and navigating around. By prefetching resources that will be loaded later you can provide a faster experience.
One new way to do that is using speculation rules. Speculation rules let you tell the browser when to prefetch different resources on your page. If you know many visitors will go to your login page after opening the pricing page, you can pre-render the entire login page and achieve an instant navigation.
To set up speculation rules, you just need to add a <script> tag with a type="speculationrules" attribute to your HTML.
For example, you can tell the browser to pre-render pages when the user hovers over a link. The preload condition is set by the eagerness attribute – moderate means the page is pre-rendered when a user hovers over the link for 200 milliseconds.
<script type="speculationrules">
  {
    "prerender": [
      {
        "where": {
          "href_matches": "/*"
        },
        "eagerness": "moderate"
      }
    ]
  }
</script>
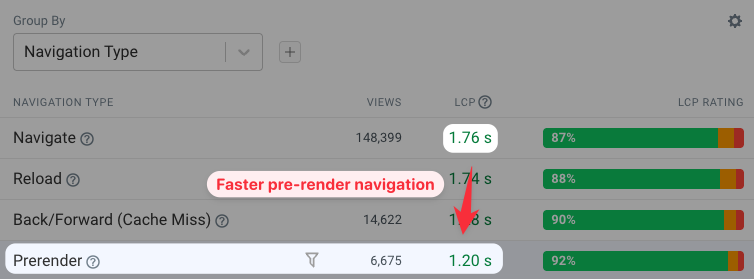
To check how pre-rendering improves performance you can use real user monitoring and compare LCP scores by navigation type.
Core Web Vitals: Going beyond load time
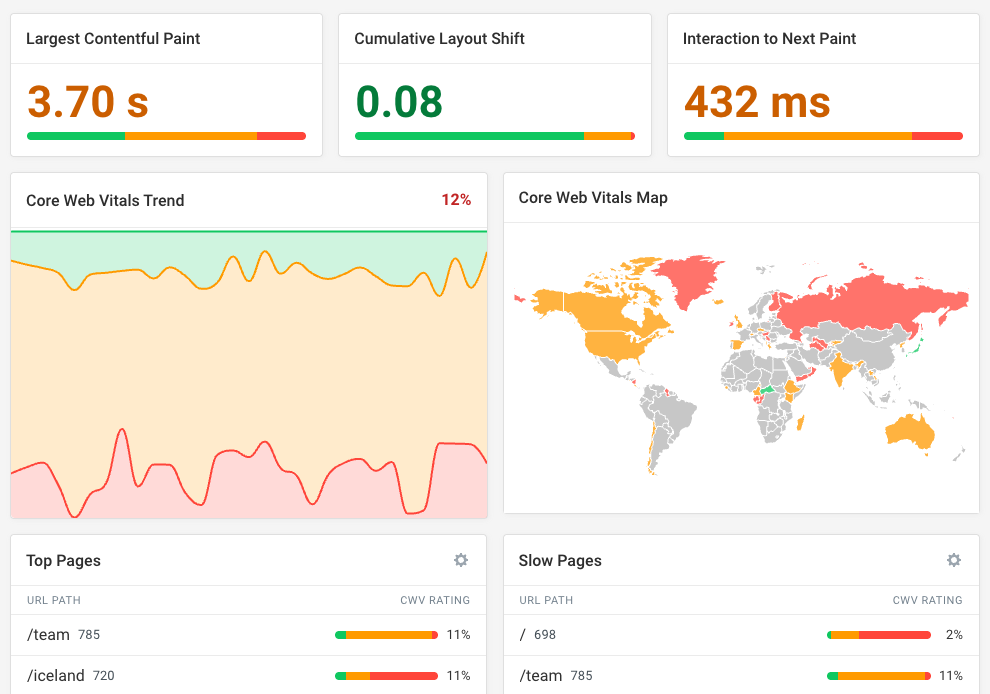
In this post we've looked at the Largest Contentful Paint metric that measures how quickly a page loads. LCP is one of Google's Core Web Vitals that impact rankings. However, there are also two other Core Web Vitals:
- Cumulative Layout Shift measures visual stability. Does content stay where it was first rendered, or does it move around and disorient users?
- Interaction to Next Paint measures how quickly your website responds to user interactions. Do visitors get quick visual feedback, or does the page remain frozen after the interaction?
Improving all three metrics takes you a long way to providing a better overall experience for your visitors.
How to maintain web performance improvements over time
After deploying improvements on your website, you need to do two things:
- Confirm that the optimization actually improves website performance
- Make sure the improvement is sustained and you don't quickly regress
A website performance monitoring tool can help you achieve both of these goals. You can track different metrics over time and get alerted to performance regressions.
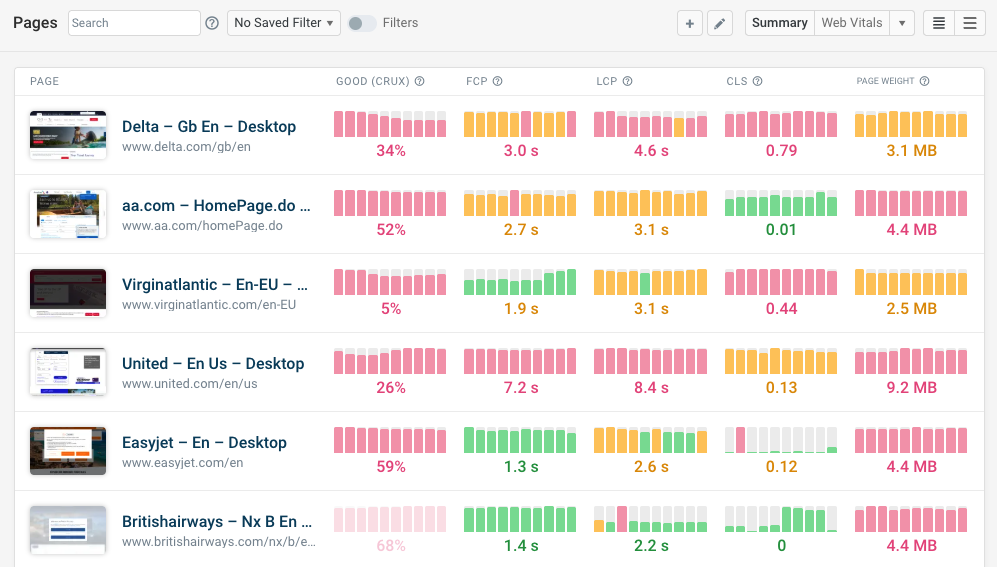
DebugBear combines synthetic performance tests, CrUX data, and real user monitoring to give you a comprehensive view of your website performance and how you compare to your competition.


Monitor Page Speed & Core Web Vitals
DebugBear monitoring includes:
- In-depth Page Speed Reports
- Automated Recommendations
- Real User Analytics Data