
I've always been annoyed by the slow speed of the Google Cloud Console web app. In 2020 I wrote about how a single page loads 16 MB of JavaScript. That same page now loads 21 MB.
But are other cloud providers better? I looked at real-user data from the Chrome User Experience Report and also ran my own tests.
This article looks at Google Cloud Platform (GCP), Amazon Web Services (AWS), and Microsoft Azure.
Performance data from real Chrome users
Google collects site speed metrics from real Chrome users as part of the Chrome User Experience Report (CrUX). We can look at the data for each of the cloud console apps.
Treo Site Speed is an incredibly helpful tool to look at origin-level CrUX data. You enter the domain of the website you’re interested in and get beautifully-presented site speed data.
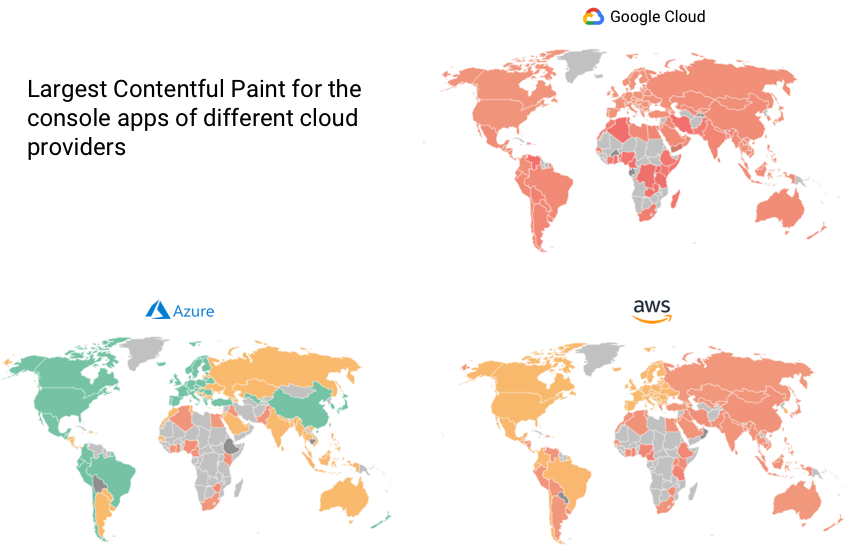
Looking at the Largest Contentful Paint metric, we can see that Google Cloud is significantly slower than both AWS and Azure. It takes over 2 times as long for the largest content element to show in the GCP app than it does in Azure.
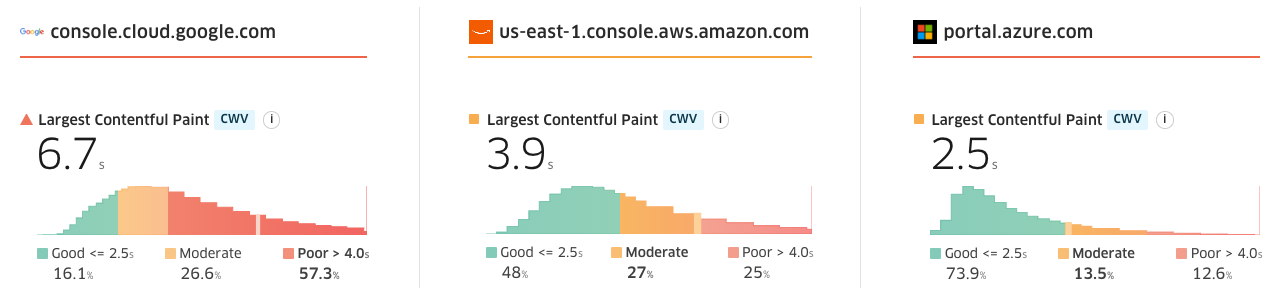
Google judges 74% of LCP experiences as good on portal.azure.com, 48% on console.aws.amazon.com, but only 16% on console.cloud.google.com.
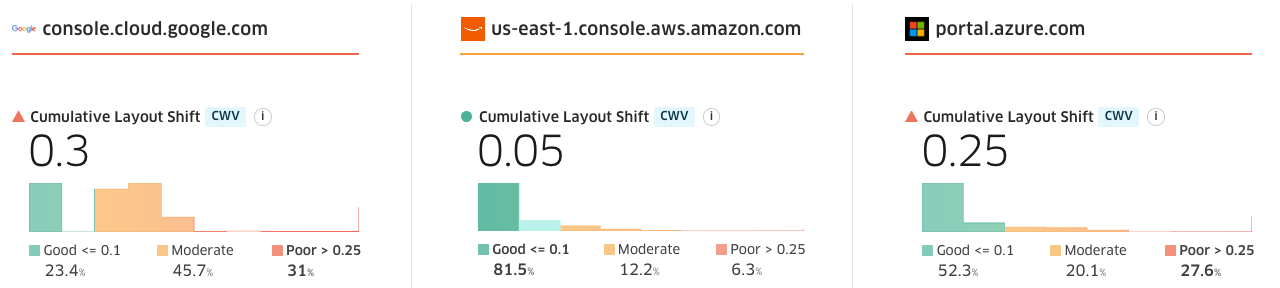
Google also has by far the worst Cumulative Layout Shift score, meaning that content moves around on the page after being rendered. However, here it is only slightly worse than Azure.
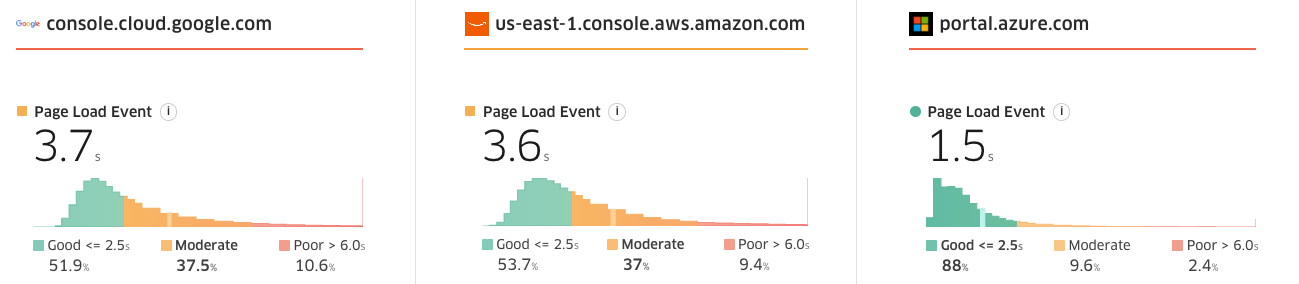
The Load event isn’t a great performance metric as it doesn’t focus on page behavior that’s directly relevant to users. But it does give us an idea of how long the initial load of a page takes.
Again Google Cloud has the slowest app of the three, with a Load time of 3.7 seconds. While this metric is similar for AWS, the Azure load time is much lower with 1.5 seconds.
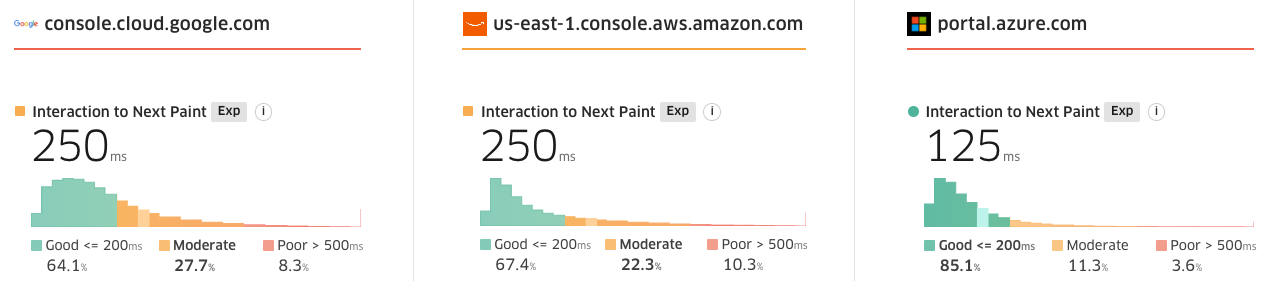
Finally, the Chrome User Experience Report also measures how quickly the page responds to user interaction like mouse clicks and keyboard input. It does that using the new Interaction to Next Paint metric.
For GCP and AWS the page takes 250 milliseconds to update after the user interaction. In contrast, for Azure it only takes half the time.
Check out the full data on Treo!
Testing page load time
I also measured page load time directly on my own computer.
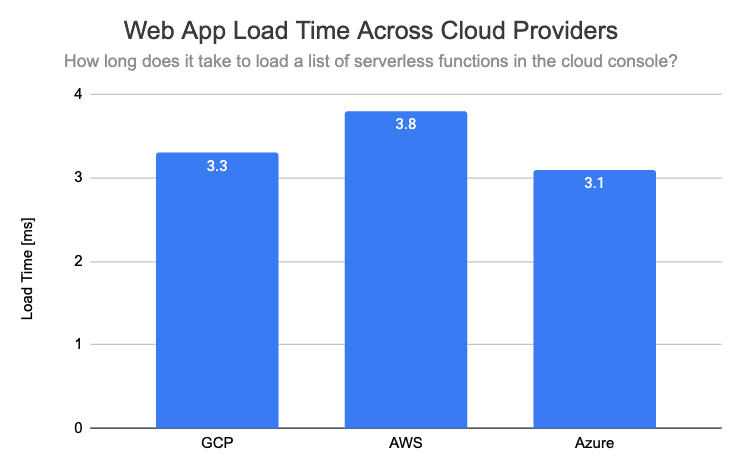
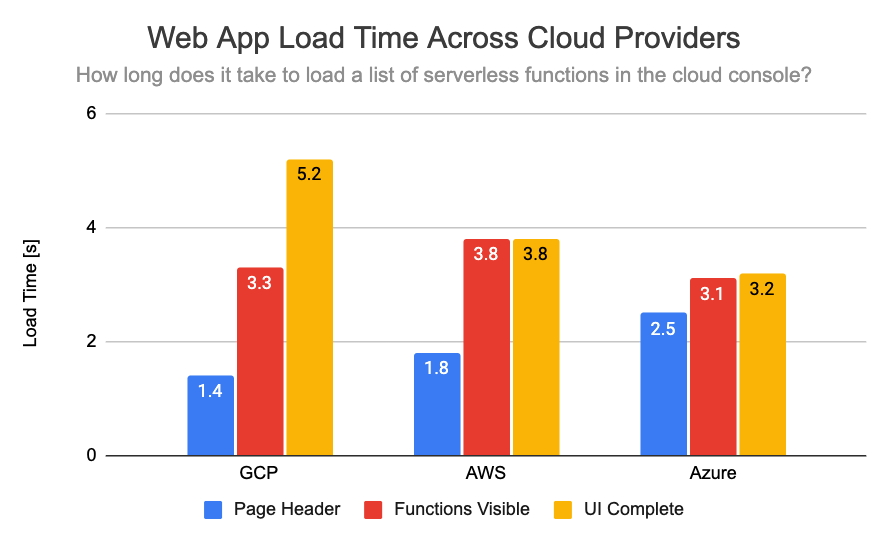
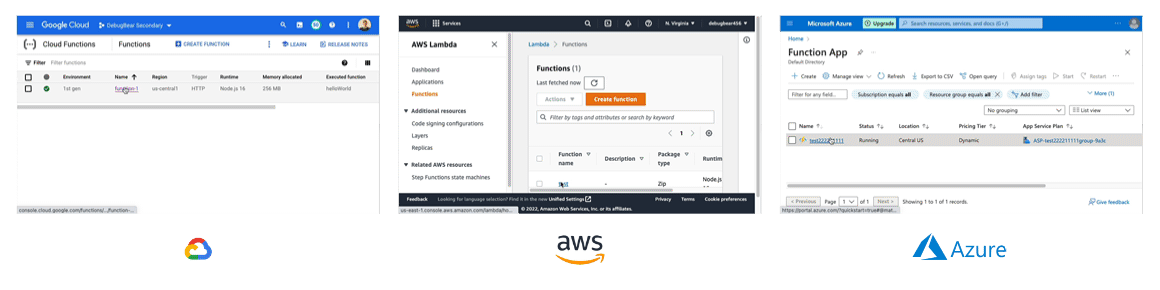
GCP, AWS, and Azure all have some kind of serverless function product. I created a serverless function with each Cloud Provider and then measured how long it takes to load the list of functions in the console web app.
Surprisingly, the results were very similar with each app taking 3 to 4 seconds to render. Azure was still the fastest app, rendering the list of functions 3.1 seconds after page navigation.
The Google Cloud UI continued to update after the initial render. However, this only affected the page header. This suggests a good prioritization decision where the main page content is loaded before ancillary UI components.
You can see the rendering progress of the three apps side by side below.
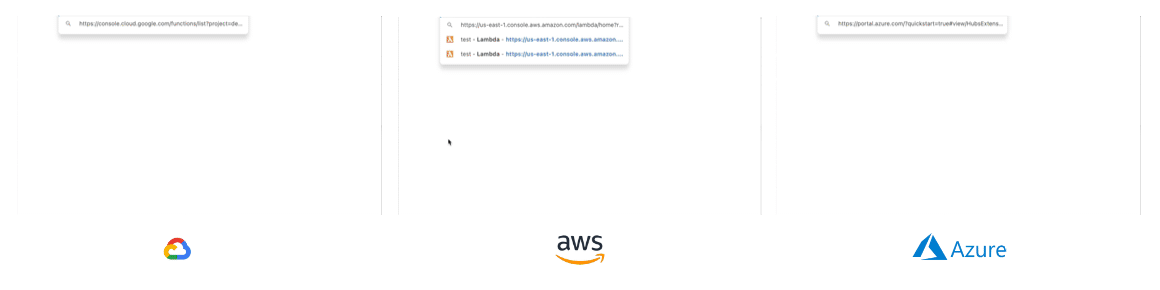
AWS may look fully loaded at the same time as GCP and Azure, but it only shows an empty list at first and then loads the functions.
Navigating within the page
What about interacting with the page after the initial load? I also measured how long after clicking on a serverless function the new page shows up.
Here AWS wins easily, as the new page appears almost practically instantly. Google Cloud and Azure both take several seconds to load and render the new content.
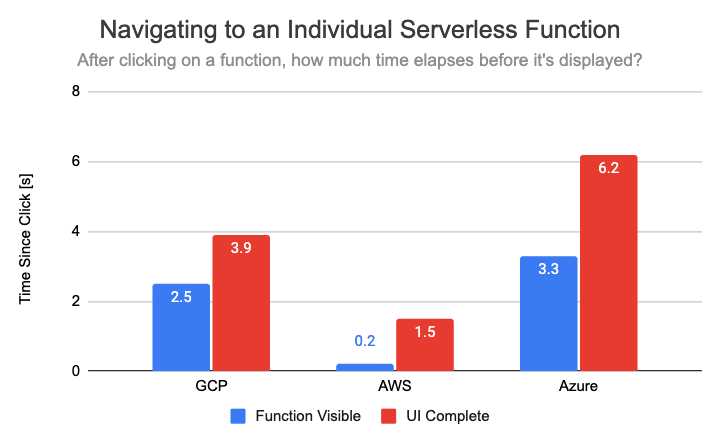
Again, here’s a gif showing what this navigation looks like in each console app.
Note: I ran these tests in Chrome DevTools using a throttled connection with 10 megabits of bandwidth and 20 milliseconds of round trip time.
JavaScript size
Depending on whether it’s loaded before or after the main page content, loading and executing JavaScript code can have a significant impact on user experience.
The Google app loads 21 Megabytes of code – double what AWS loads and four times the size of the Azure application.
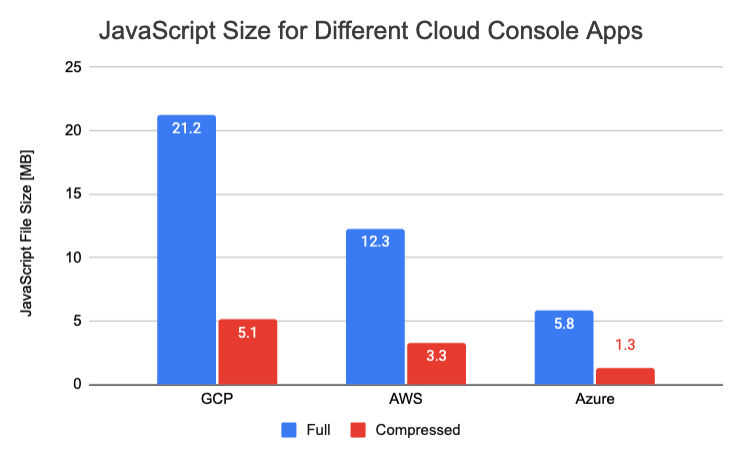
While all of this code has to be executed, thanks to file compression only a smaller amount of data has to be downloaded. Still, Google fetches over 5 megabytes of code.
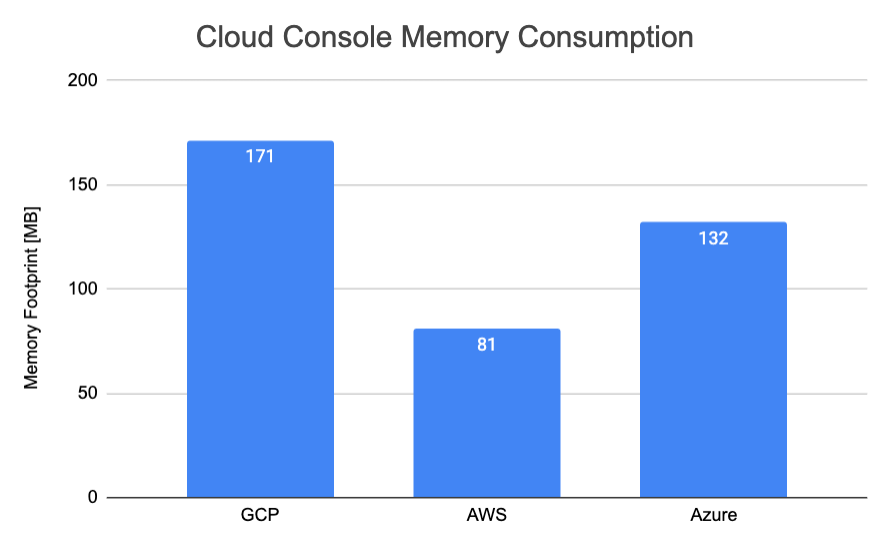
Memory consumption
Another measure of complexity is how much memory the page consumes. For this I used Chrome’s Task Manager to see the memory footprint of each page.
Here the AWS app wins with only 81 megabytes. This isn’t a whole lot actually – for example, the React homepage takes up 59 megabytes.
However, the Google Cloud app is once again the most resource-hungry, using 171 megabytes of memory.
Conclusion
The big cloud providers all ship large complex console apps that consist of many megabytes of JavaScript code. Overall the data shows that Google Cloud has built the slowest UI of the three providers while Azure is the fastest.
We can also see AWS doing well when navigating within the app – it feels like a smooth transition, not like loading a whole new page.
While the local speed test did not support Google being slower than its competitors, I think this might be because the experience depends heavily on what content you're viewing. I only looked at a listing page with a single serverless function, but more complex pages (for example the logs view) tend to be especially slow.
DebugBear lets you continuously monitor site speed. Want to monitor how fast your app is for logged-in users? We support running through a login flow prior to tests.