
This post introduces the scheduler.yield API and explains how you can use it to optimise the performance of your web applications. There are also interactive code demos you can follow along with.
Introduction
In the context of web performance, scheduling is the browser's way of deciding which tasks to run (JavaScript, page rendering, etc.) and when to run them. Scheduling is a key concept that can impact the user experience of your web applications.
While not every website needs to worry about scheduling, scheduling is an important feature to understand as it offers precise timing and control over how your JavaScript is scheduled.
What is scheduler.yield?
The scheduler.yield API is supported in Chromium-based browsers.
The scheduler.yield() method is used to yield control back to the browser's scheduler, allowing other important tasks to run. It's the browser that decides what's considered "important".
scheduler.yield(); // Promise {<pending>}
This can be useful when you want to ensure that your JavaScript code doesn't block the main thread and negatively impact the user experience.
You might be wondering, what other work does the browser need to do? The browser scheduler is responsible for a lot of things, such as:
- Rendering the page
- Garbage collection
- Handling user input
Let's focus on the last one, handling user input. When the main thread is blocked, the browser can't respond to most types of user input. This can lead to a poor user experience and result in poor web performance metric scores, like Interaction to Next Paint as part of Core Web Vitals.
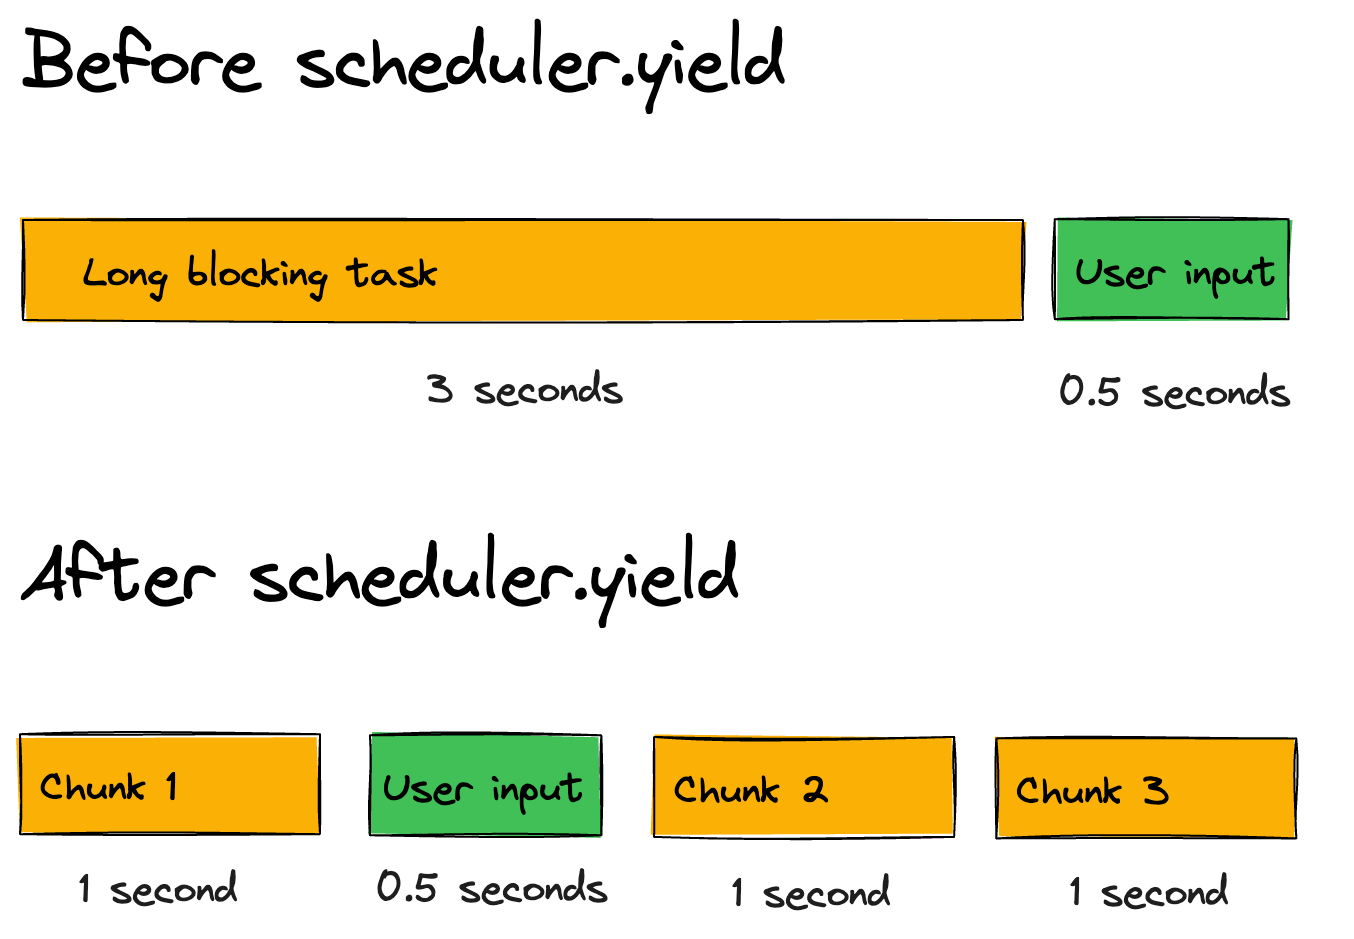
In the following diagram, the "Before scheduler.yield" and "After scheduler.yield" examples both take 3.5 seconds to complete. However, the "After scheduler.yield" version is able to run an important task related to user input after 1 second, while the "Before scheduler.yield" example is only able to run the important task after 3 seconds.
Understanding key web performance concepts
If you're finding terms like "main thread," "browser scheduler," and "blocking" confusing - don't worry! You're not alone.
While web performance used to focus mostly on network speed (how fast resources download), today's JavaScript-heavy web apps have shifted our attention to runtime performance (how smoothly the browser executes code and handles JavaScript).
Here's a breakdown of these important concepts:
-
Main thread: Think of this as the browser's primary worker that handles most tasks - running your JavaScript, processing user input, and painting the screen.
-
Browser scheduler: This is like a traffic controller that decides which tasks to run and when. It's responsible for ensuring that important tasks (like responding to user input) are prioritized.
-
Blocking: When a task (like a heavy JavaScript calculation) is running on the main thread, it prevents other important work from happening - like responding to a user's click.
When we talk about scheduler.yield, we're giving that traffic controller a chance to prioritize more urgent tasks before continuing with our code.
Note on code examples
In the next few sections, you'll see code examples that demonstrate how to use scheduler.yield. Before that, however, we first need an example of a slow-running function that blocks the main thread. The implementation of the following function isn't important:
// A helper function to block the main thread
// for demonstration purposes only
function blockMainThread(duration) {
  const startTime = Date.now();
  while (Date.now() - startTime < duration) {
    // Blocking the main thread
  }
}
The takeaway here is that when blockMainThread is called, it blocks the main thread for (roughly) the specified duration.
How to use the scheduler.yield API
In this section, you'll see a minimal before and after example of using scheduler.yield.
A task that blocks for 50ms or longer is known as a Long Task and needs fixing.
First, the "before" which blocks the main thread for 1 second, and does not use scheduler.yield:
Before:
// This function blocks for 1 continuous second (500ms + 500ms)
function blocksContinuously() {
  blockMainThread(500);
  blockMainThread(500);
}
And here's the "after" which does use scheduler.yield:
After:
async function blocksInChunks() {
  // Blocks for 500ms, then yields to the browser scheduler
  blockMainThread(500);

  await scheduler.yield(); // The browser scheduler can run other tasks at this point

  // Blocks for another 500ms and returns
  blockMainThread(500);
}
And here's the difference shown in a DevTools Performance profile:
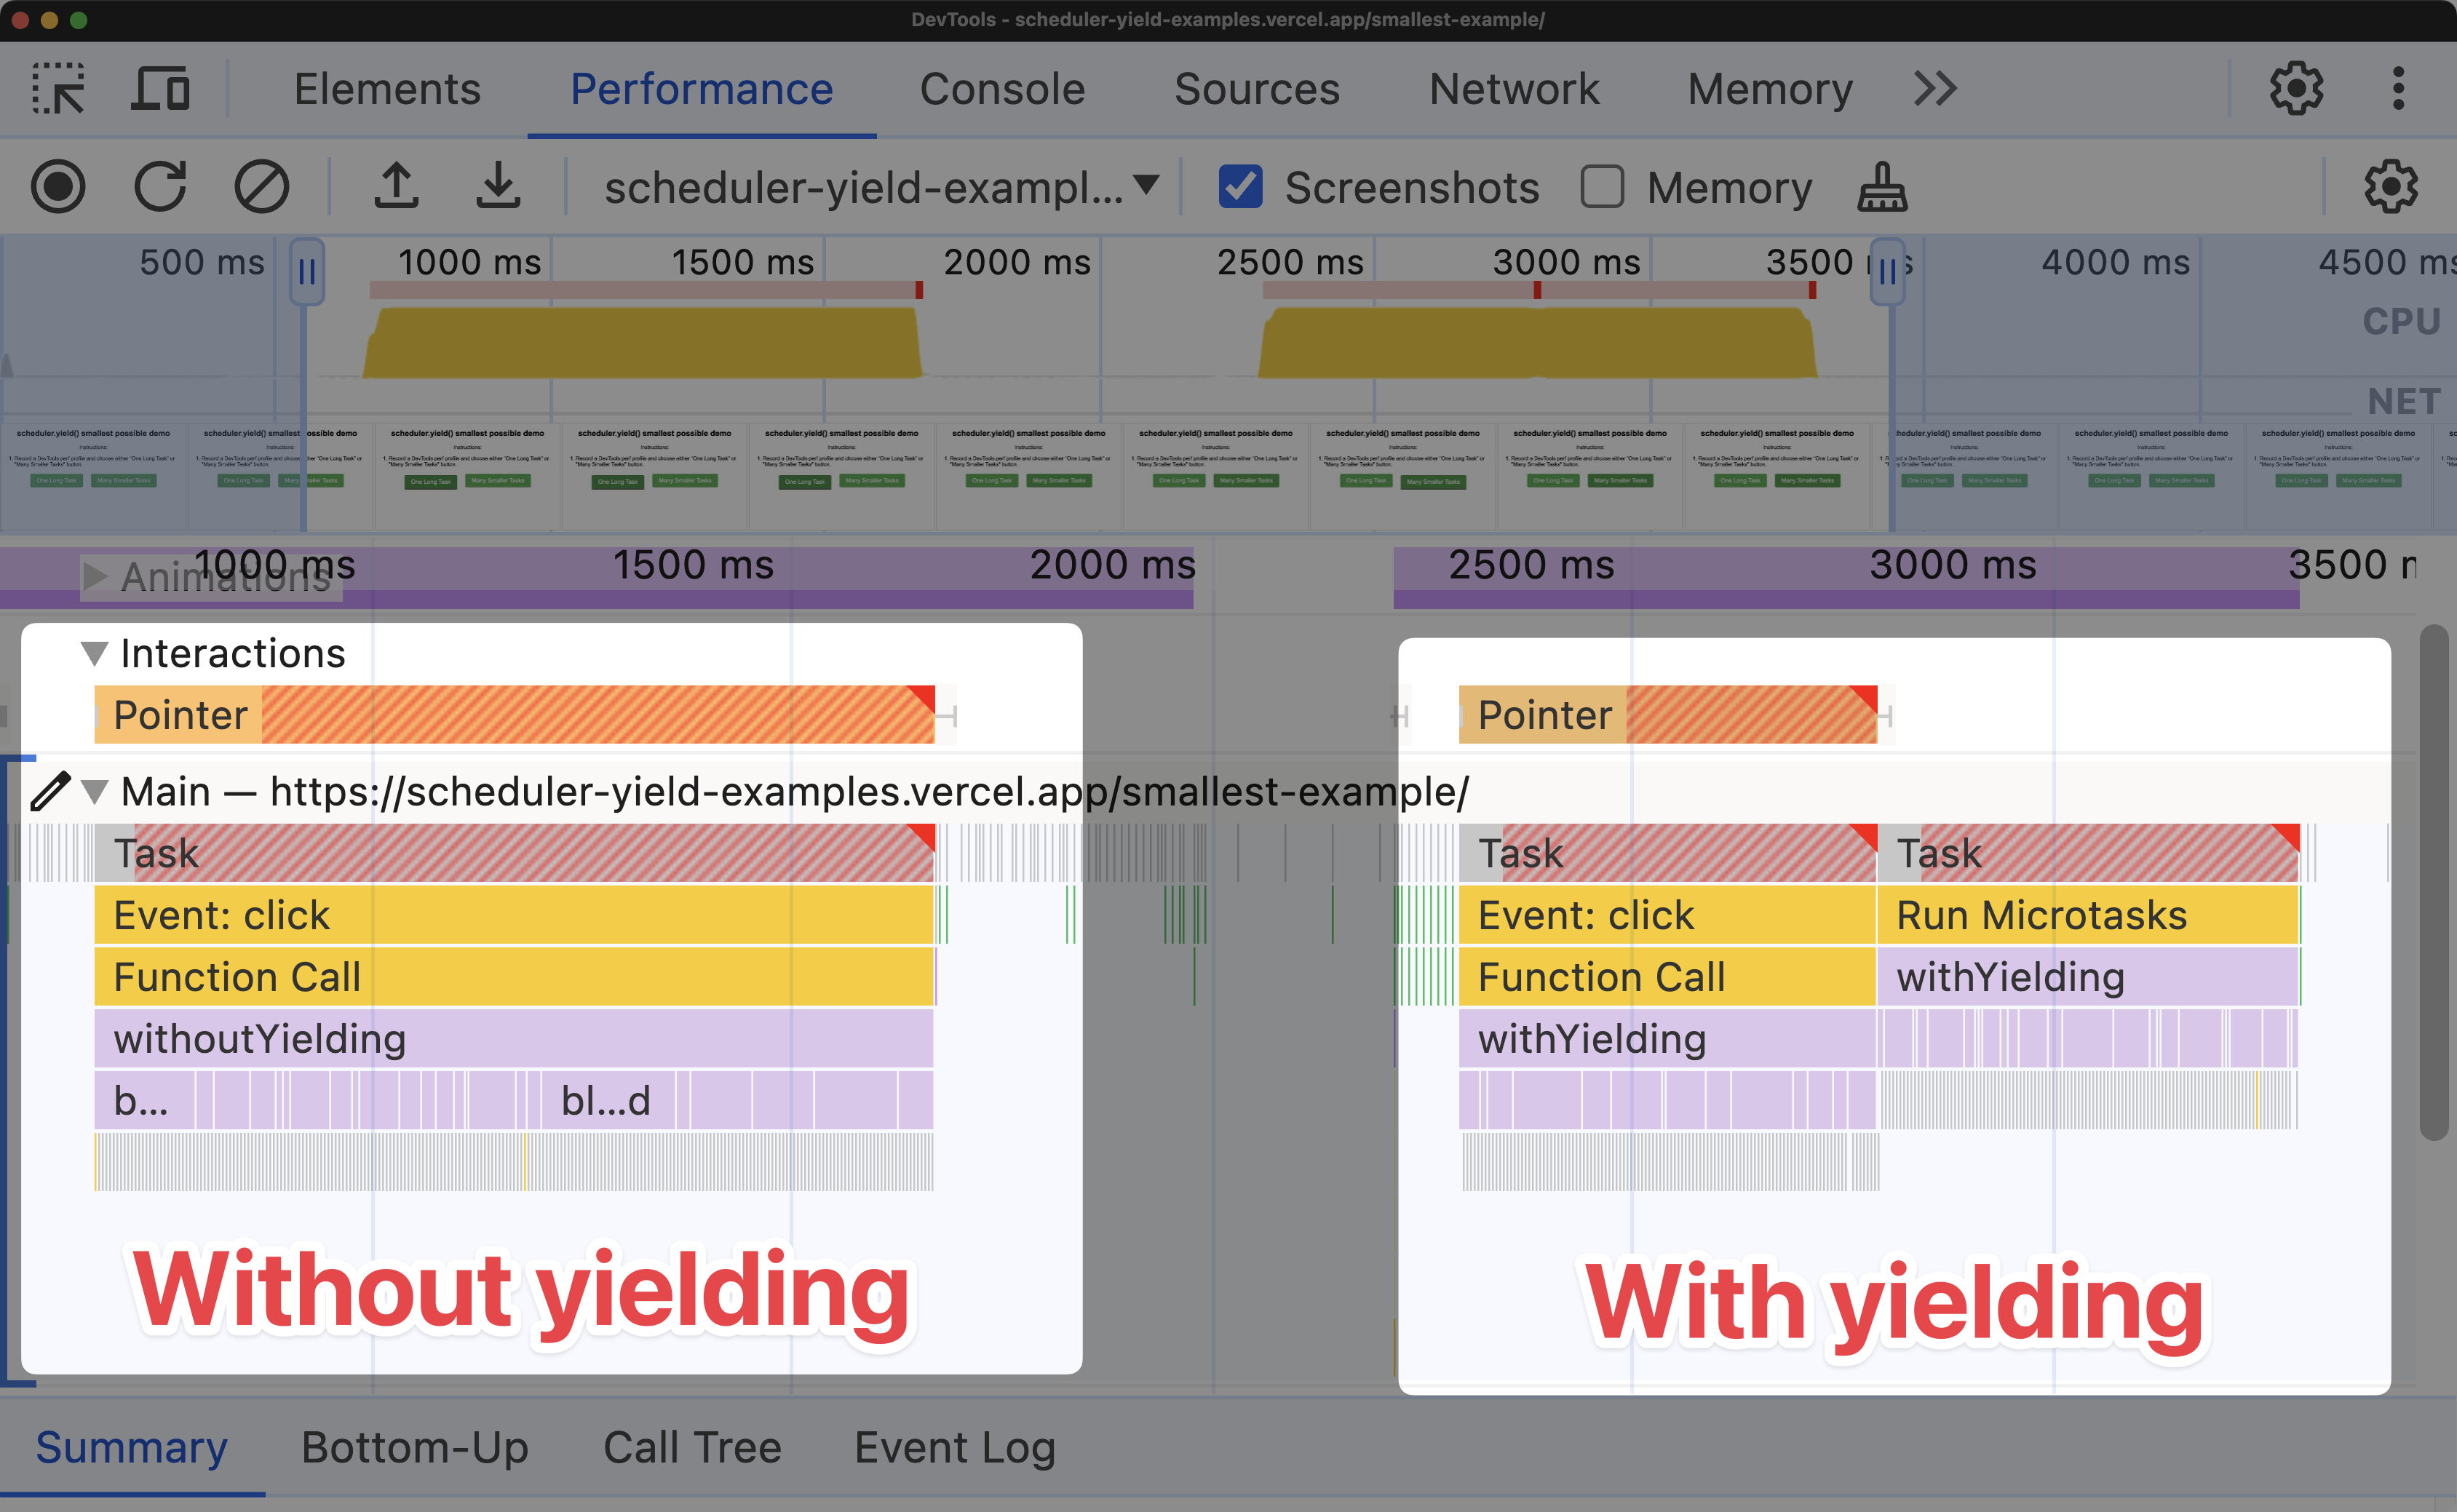
Here are some key points to note from the Chrome DevTools screenshot:
Without scheduler.yield | With scheduler.yield | |
|---|---|---|
| Button responsiveness | The button :active state freezes for 1 second | The button active state freezes for 500ms |
| User experience | The user is unable to interact with the page for 1 second | The user can interact with the page after 500ms |
| Long Task | The Long Task takes 1 second to complete | The Long Task takes 500ms to complete |
scheduler.yield returns a promise. After the promise is resolved, the remaining code in blocksInChunks will run.
There's a big difference between the two implementations shown earlier:
- Without
scheduler.yield: TheblocksContinuouslyfunction blocks the main thread for 1 continuous second. - With
scheduler.yield: TheblocksInChunksfunction blocks for 500ms, yields to the browser scheduler, and then blocks for another 500ms.
Most websites will have JavaScript that occasionally blocks the main thread - that's normal. But there's a huge difference between:
- Blocking the main thread for 1 continuous second (bad user experience)
- Blocking for 500ms, yielding to let the browser handle important tasks, then continuing with another 500ms (much better experience)
For best results, you should break down your work into even smaller chunks and yield between them. This gives the browser frequent opportunities to handle user interactions and can help avoid INP issues during page load.
Our simple examples above demonstrate the basic concept, but you might wonder: "How does this look in practice when a user tries to interact with my page?" Let's see this in action with some real examples.
Demo: using scheduler.yield with a user interaction
Here's an interactive demo of using scheduler.yield that highlights a user interaction scenario.
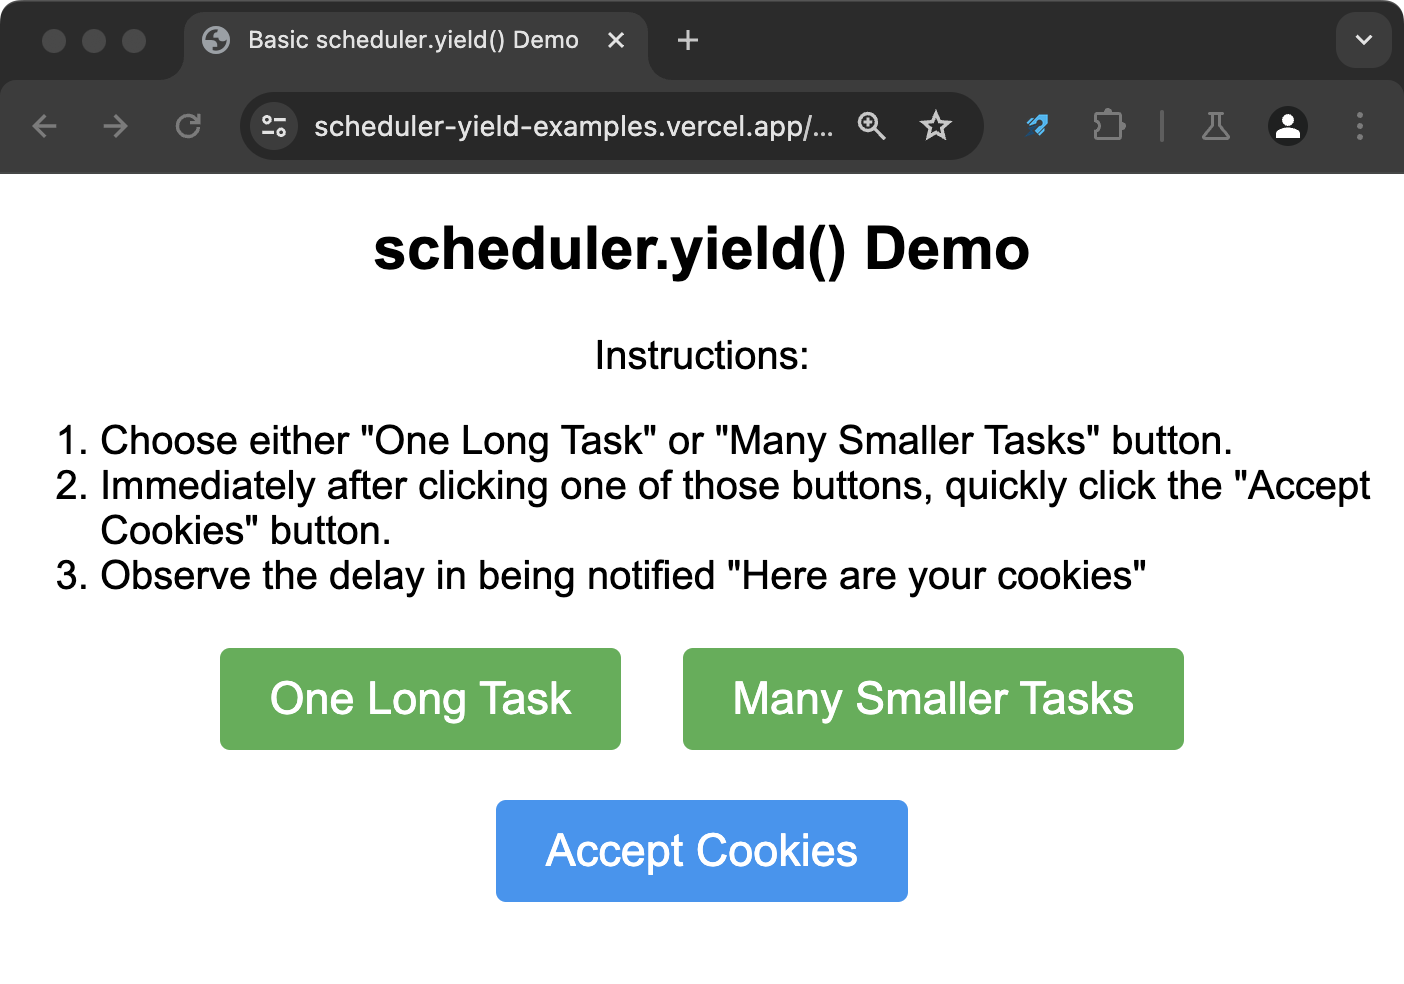
Follow these steps to see how using scheduler.yield results in a faster interaction:
- Choose either the "One Long Task" or the "Many Smaller Tasks" button.
- One Long Task: Does not use
scheduler.yield. - Many Smaller Tasks: Uses
scheduler.yield.
- Immediately after clicking one of those buttons, quickly click the "Accept Cookies" button.
- Observe the delay in being notified "Here are your cookies"
Bonus: Record a DevTools performance profile of the above steps. Can you observe how JavaScript execution appears differently depending on whether you clicked "One Long Task" or "Many Smaller Tasks"? If not, continue reading to see what it looks like.
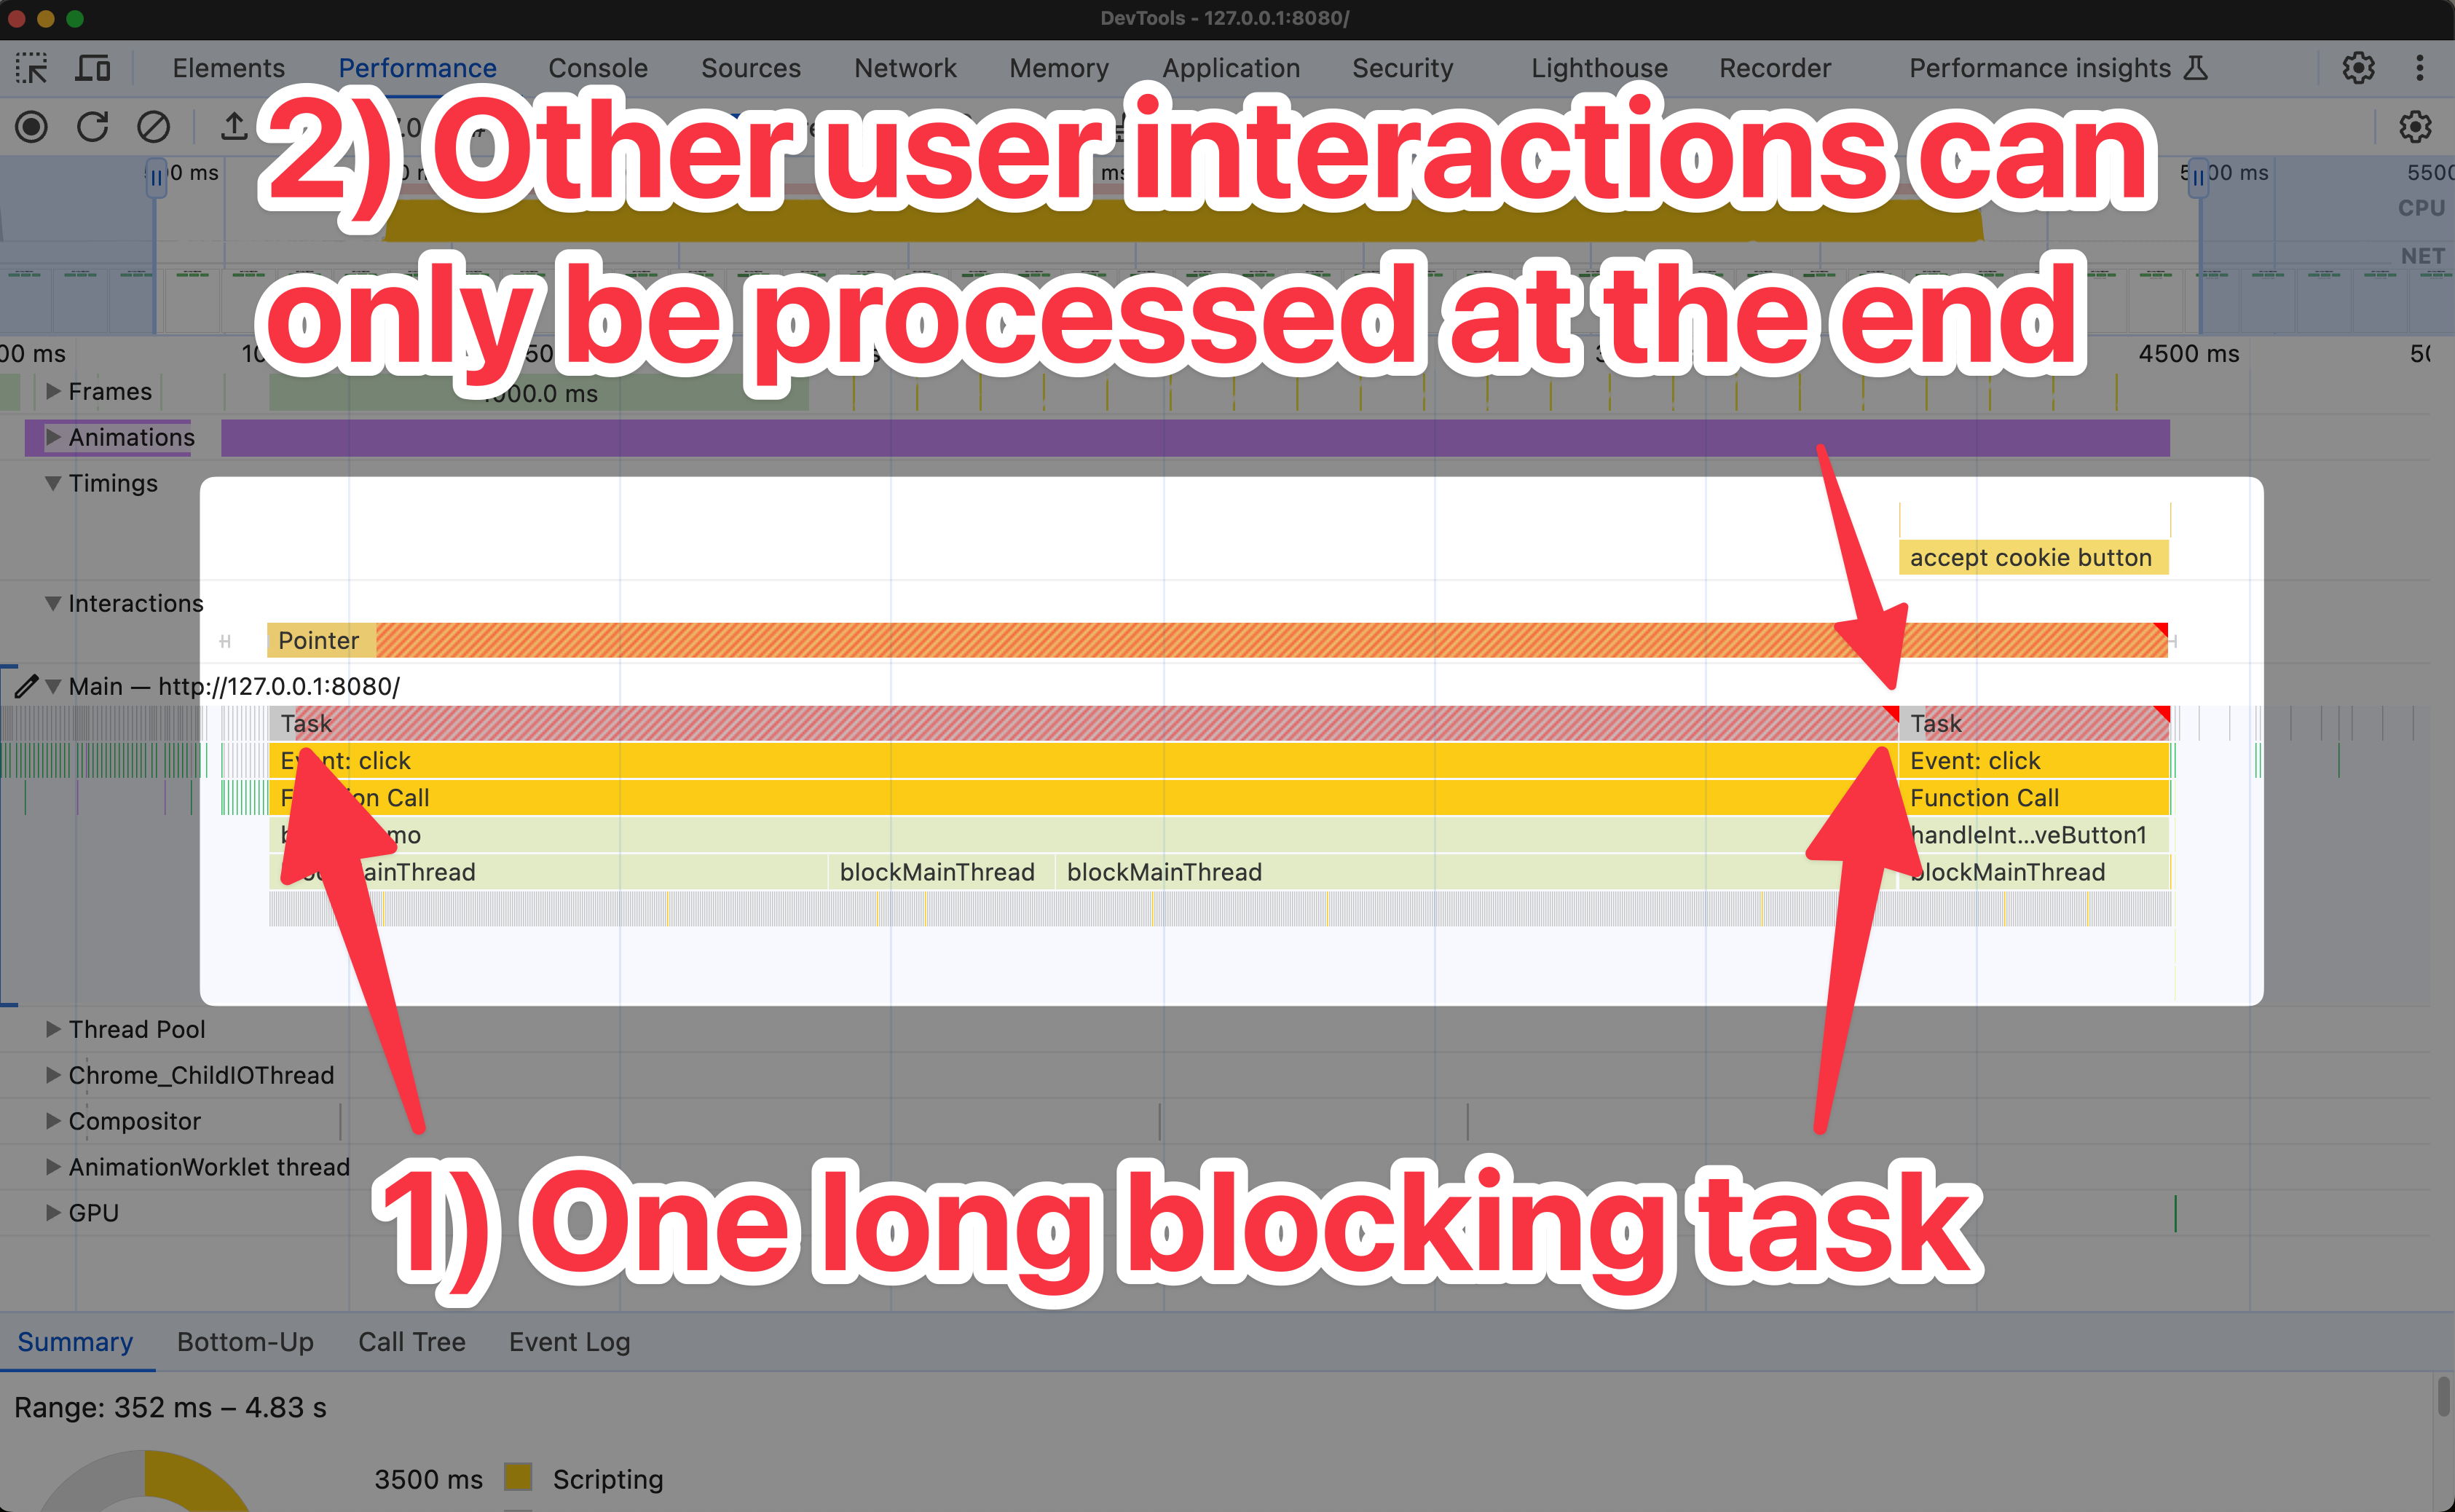
In this scenario, there is a long blocking task that does not use scheduler.yield. During the task, the user clicks on an "Accept cookies" button. The browser is unable to respond to this user input until the long task is complete.
Note if you are not sure on what to focus on within the following screenshot, skip it, and look at the next one.
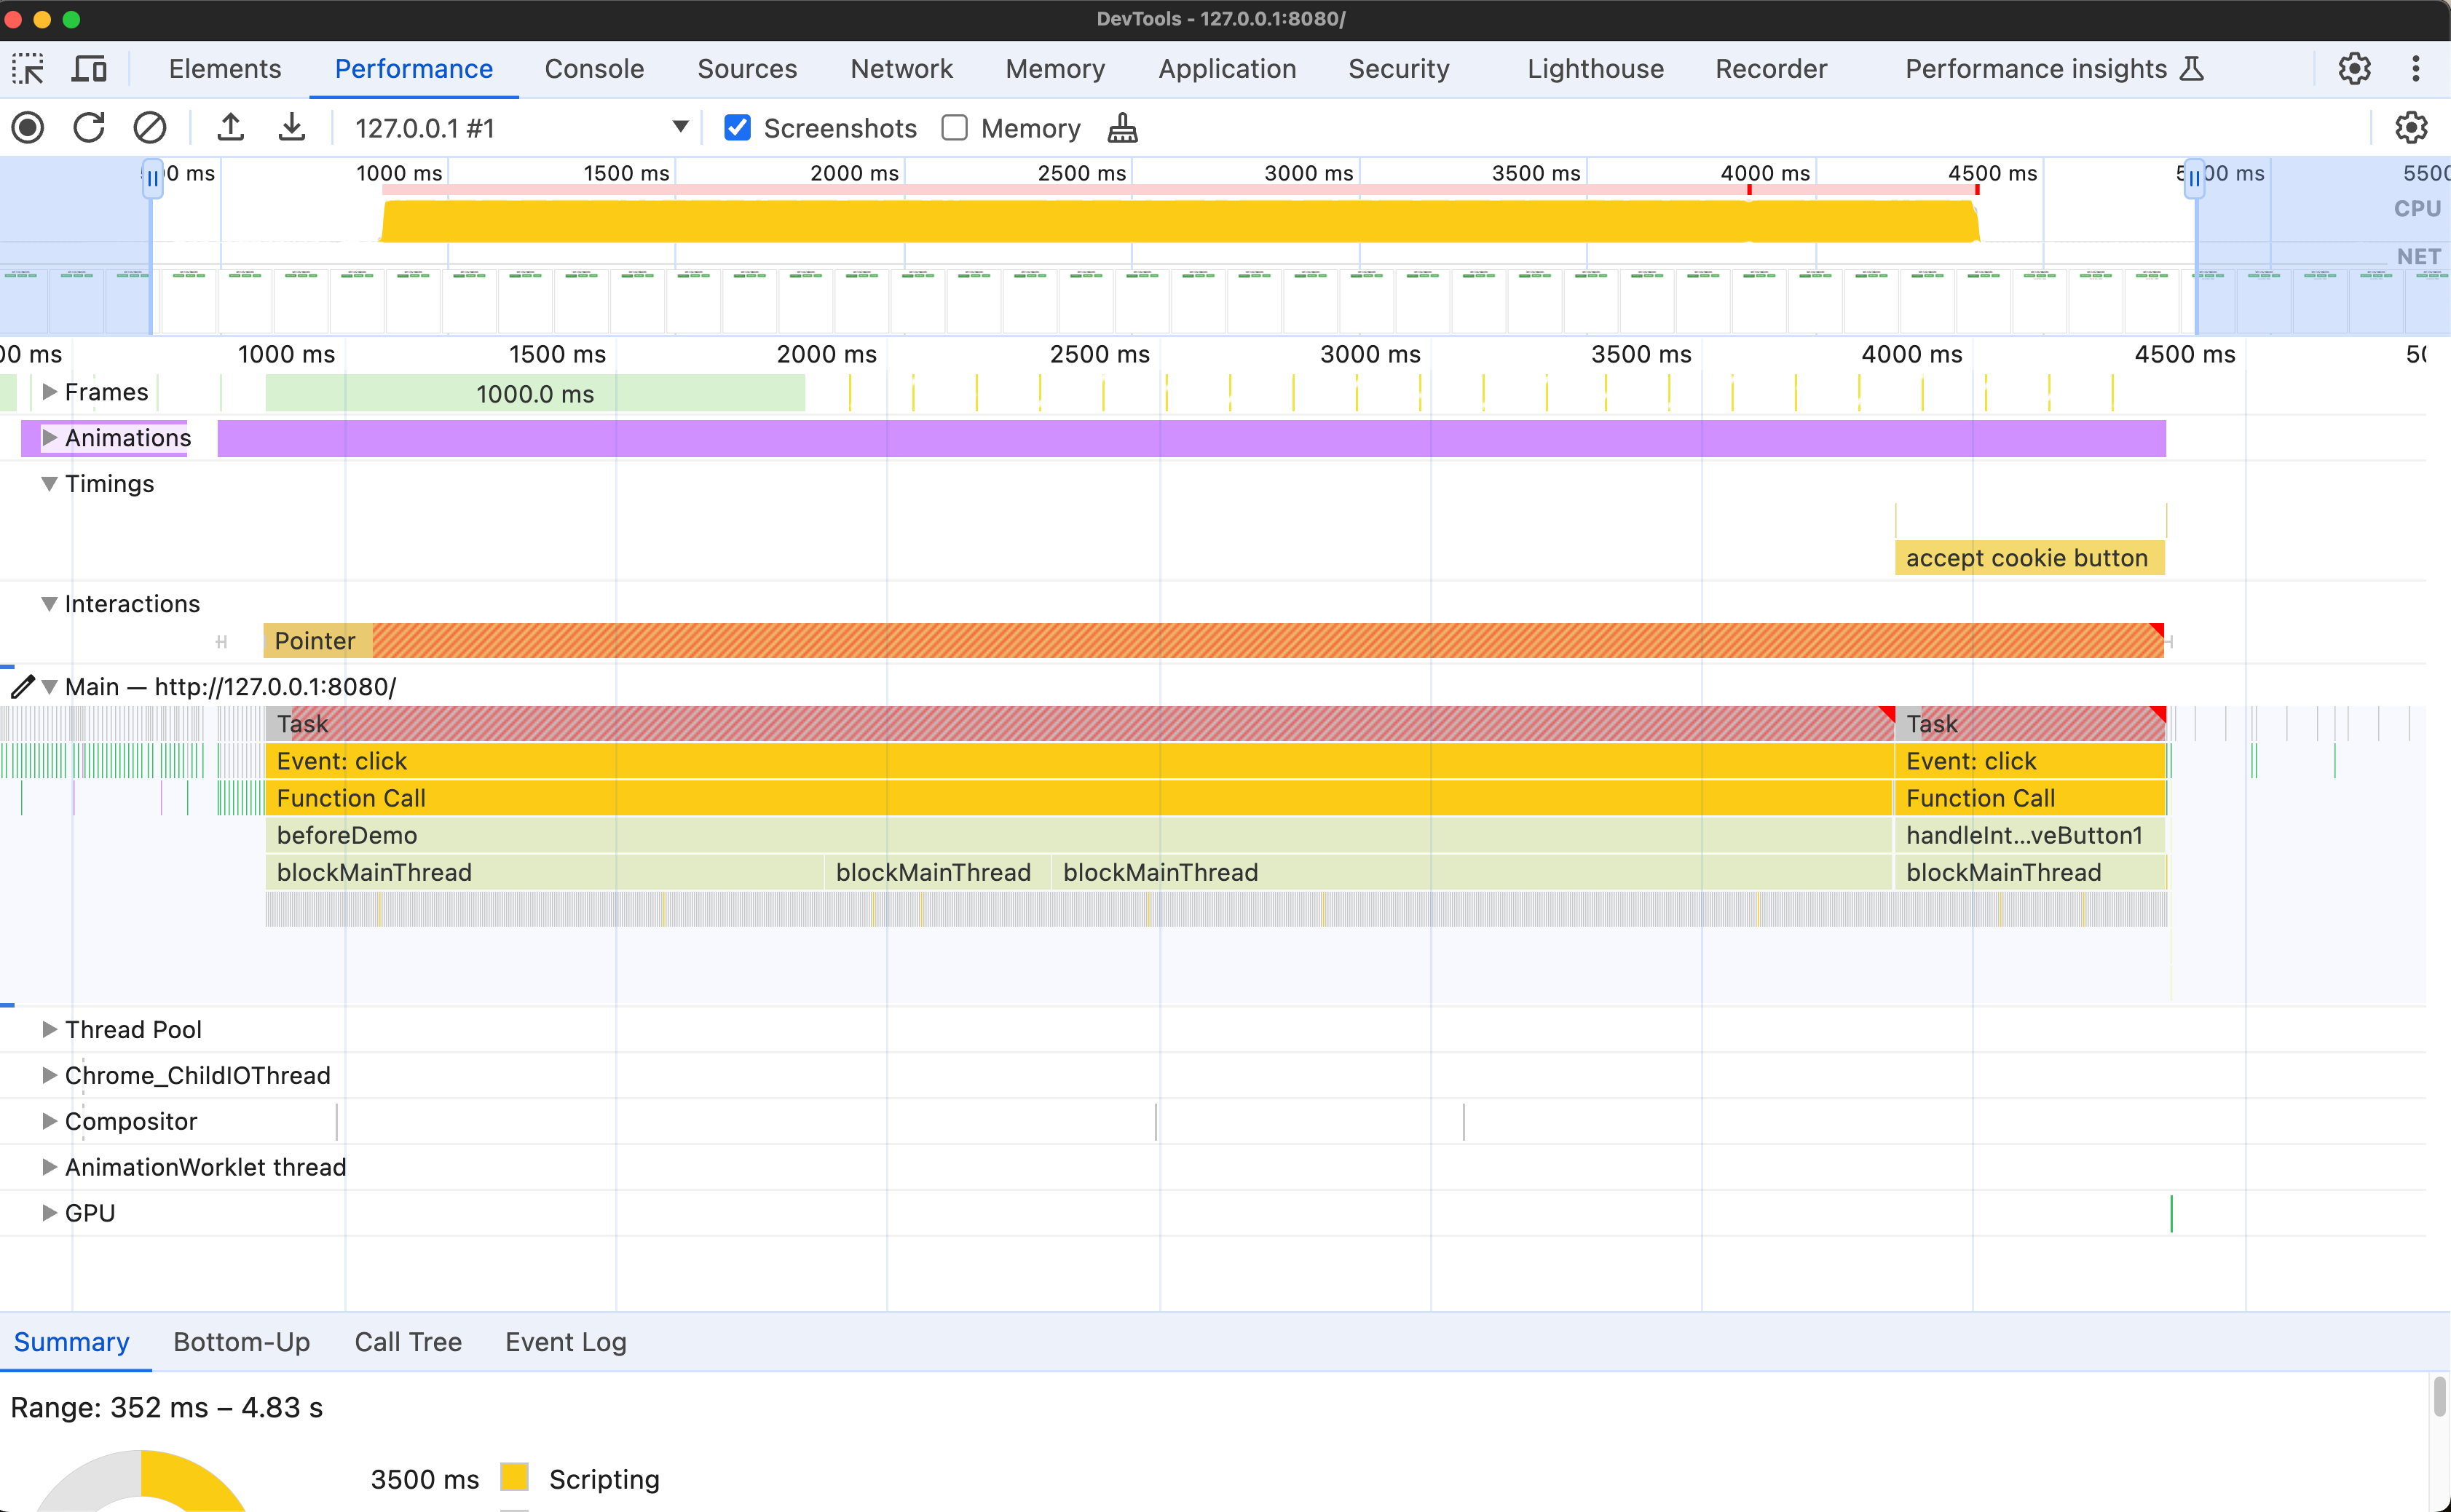
Here's an annotated version of the previous screenshot:
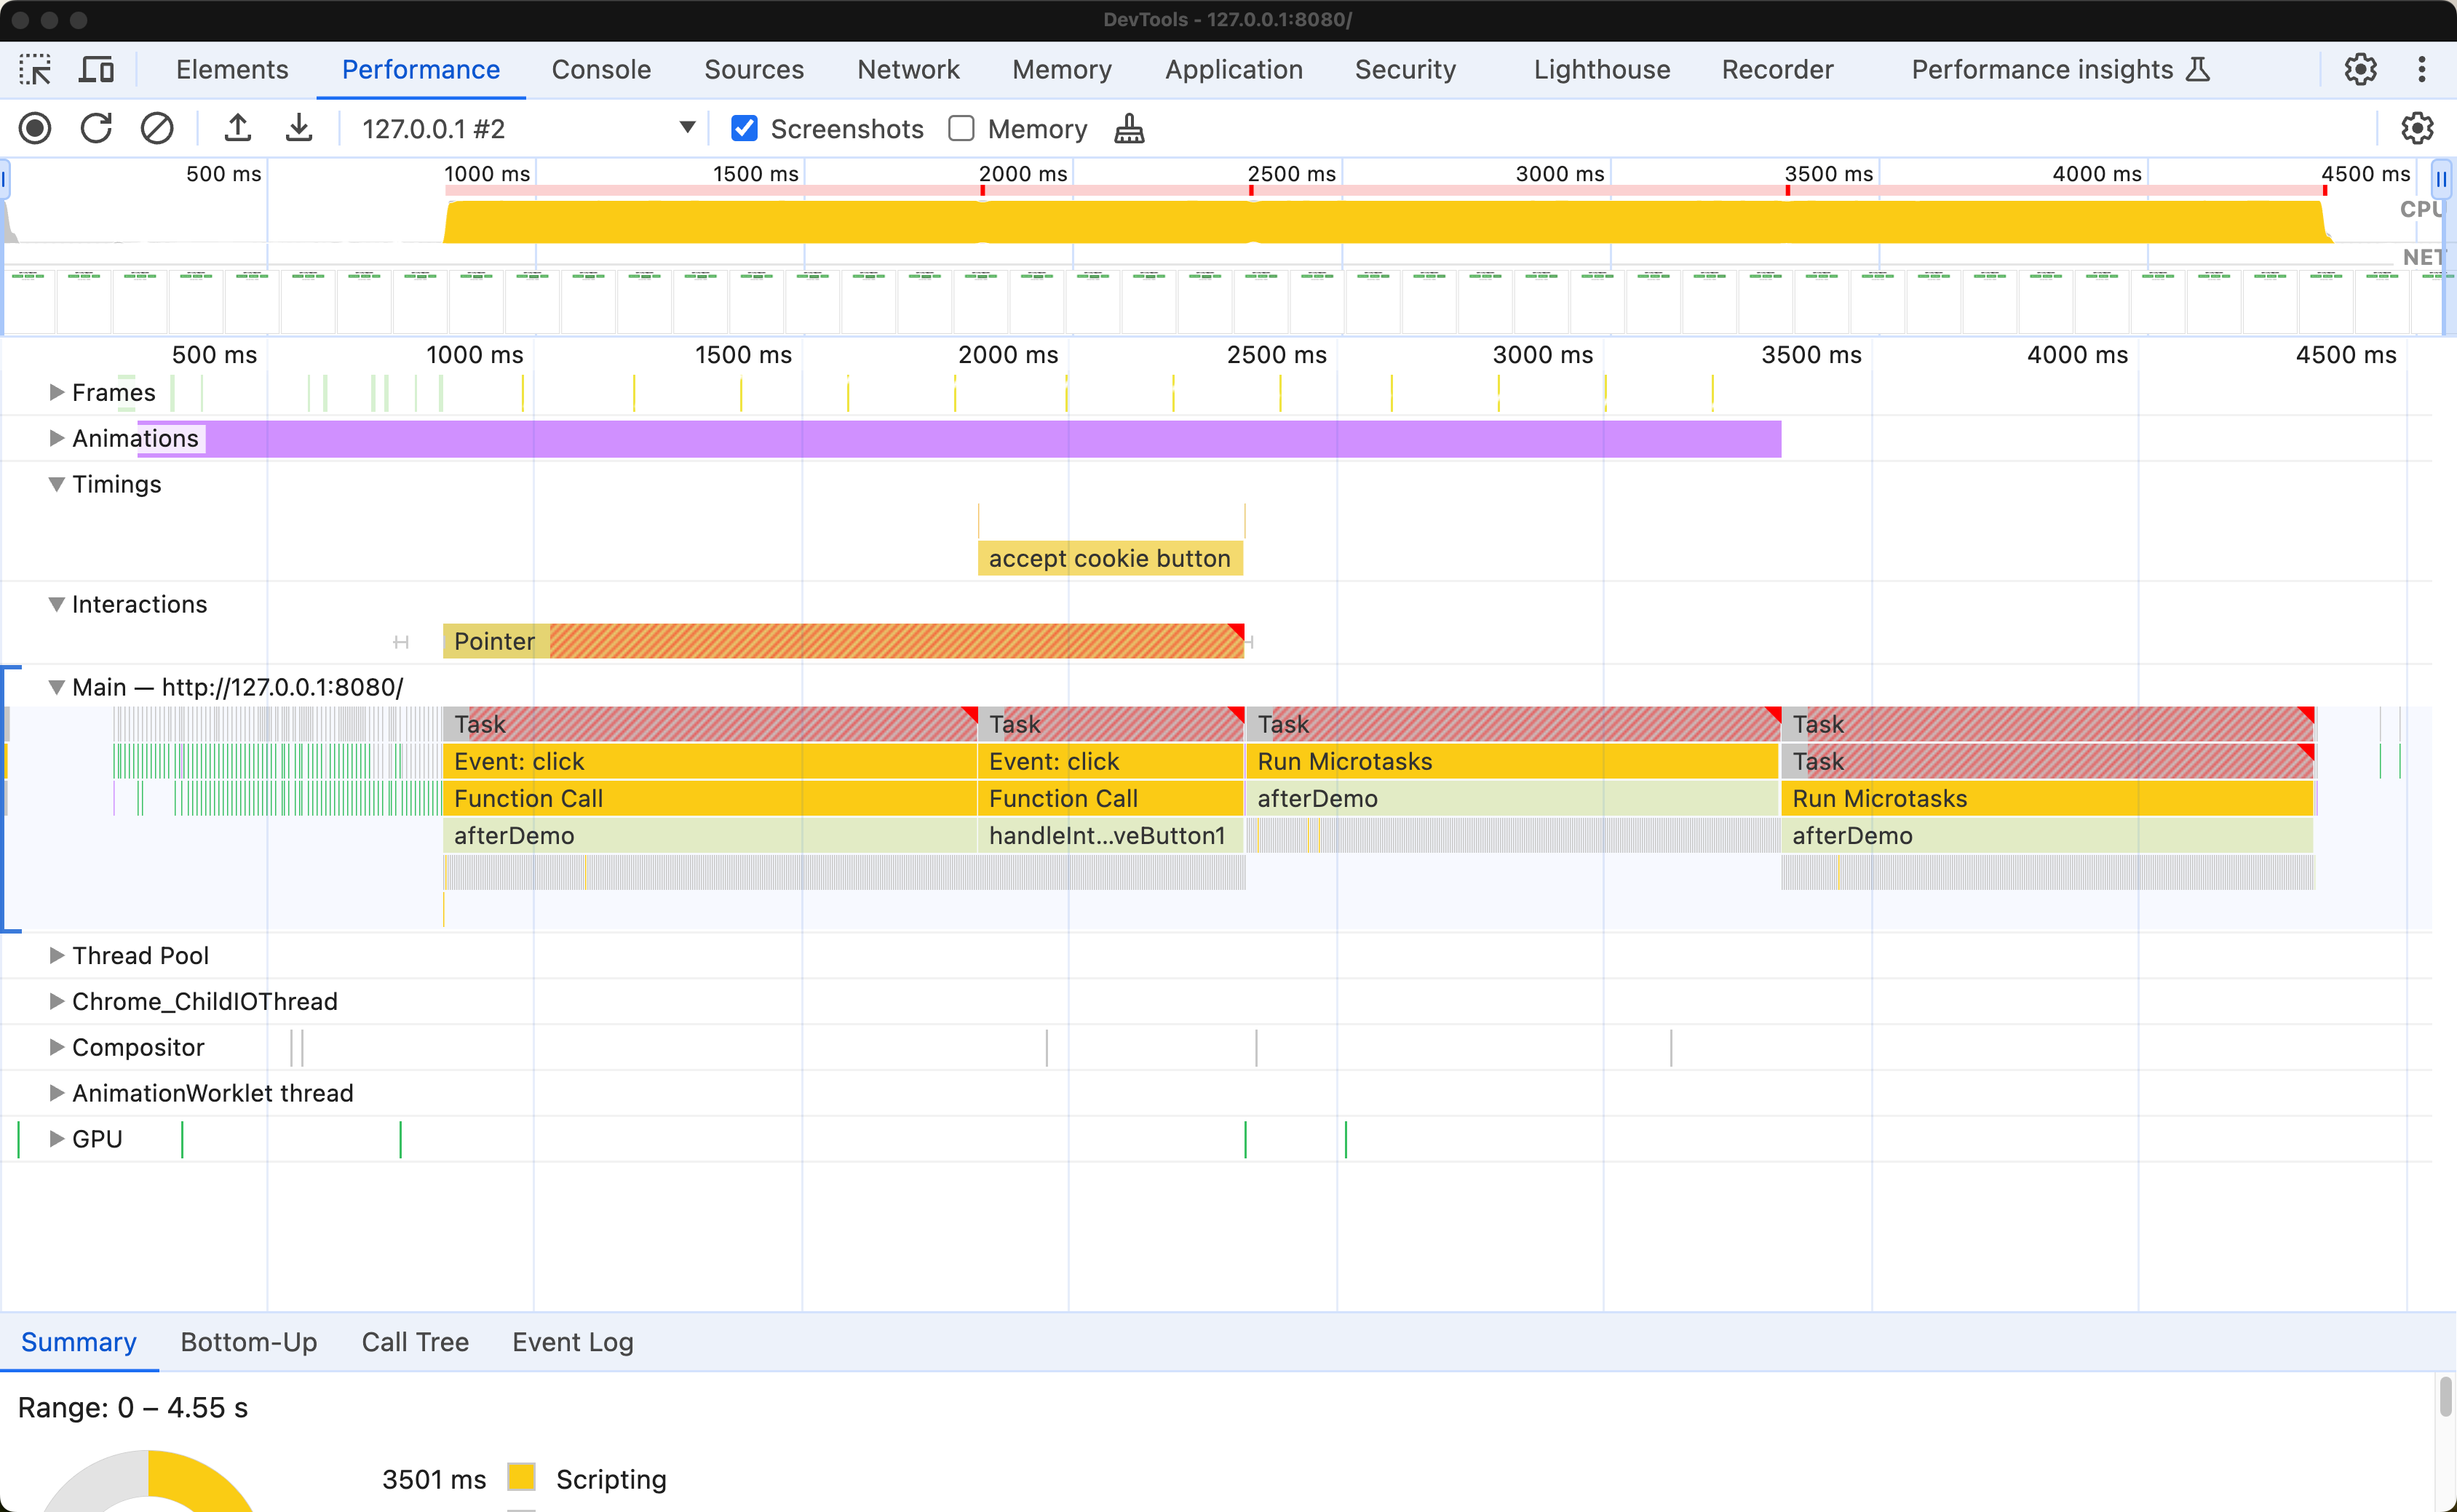
In this next scenario, the long blocking task has been split up into chunks, and scheduler.yield is used throughout. During the task, the user clicks on an "Accept cookies" button. The browser is able to respond to this user input after the first chunk of work is complete.
Note if you are not sure on what to focus on within the following screenshot, skip it, and look at the next one.
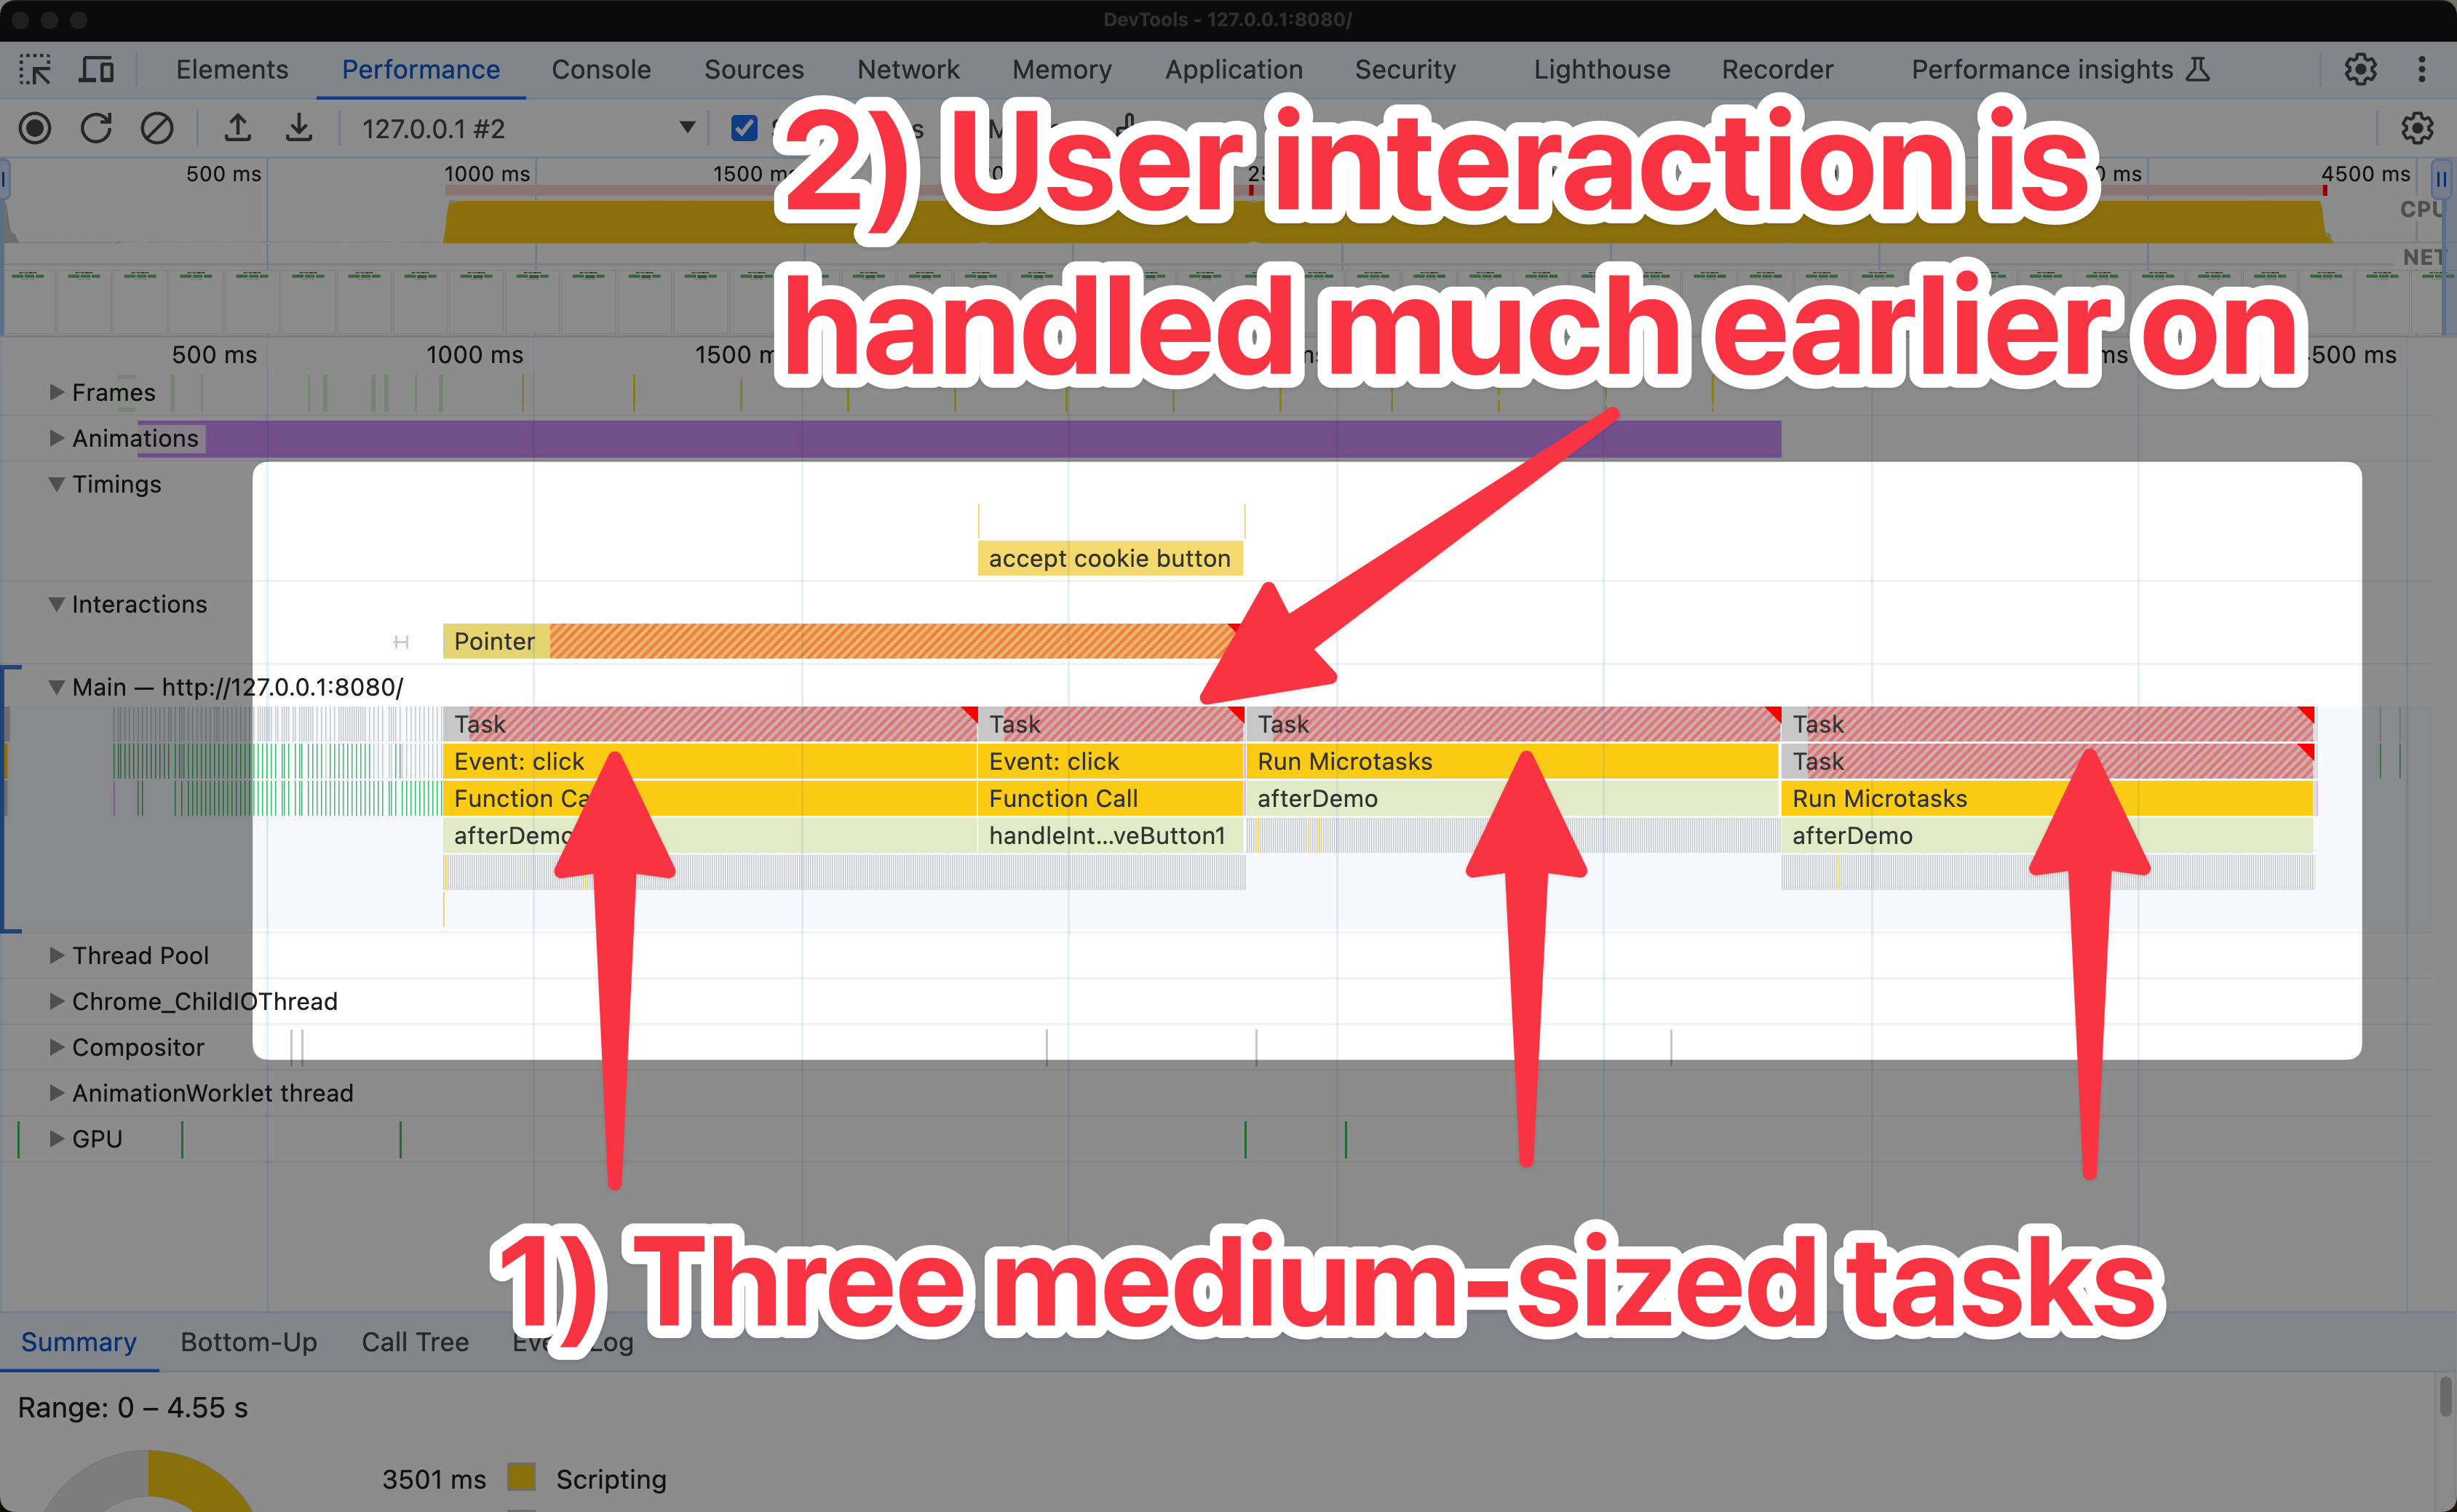
Here's an annotated version of the previous screenshot:
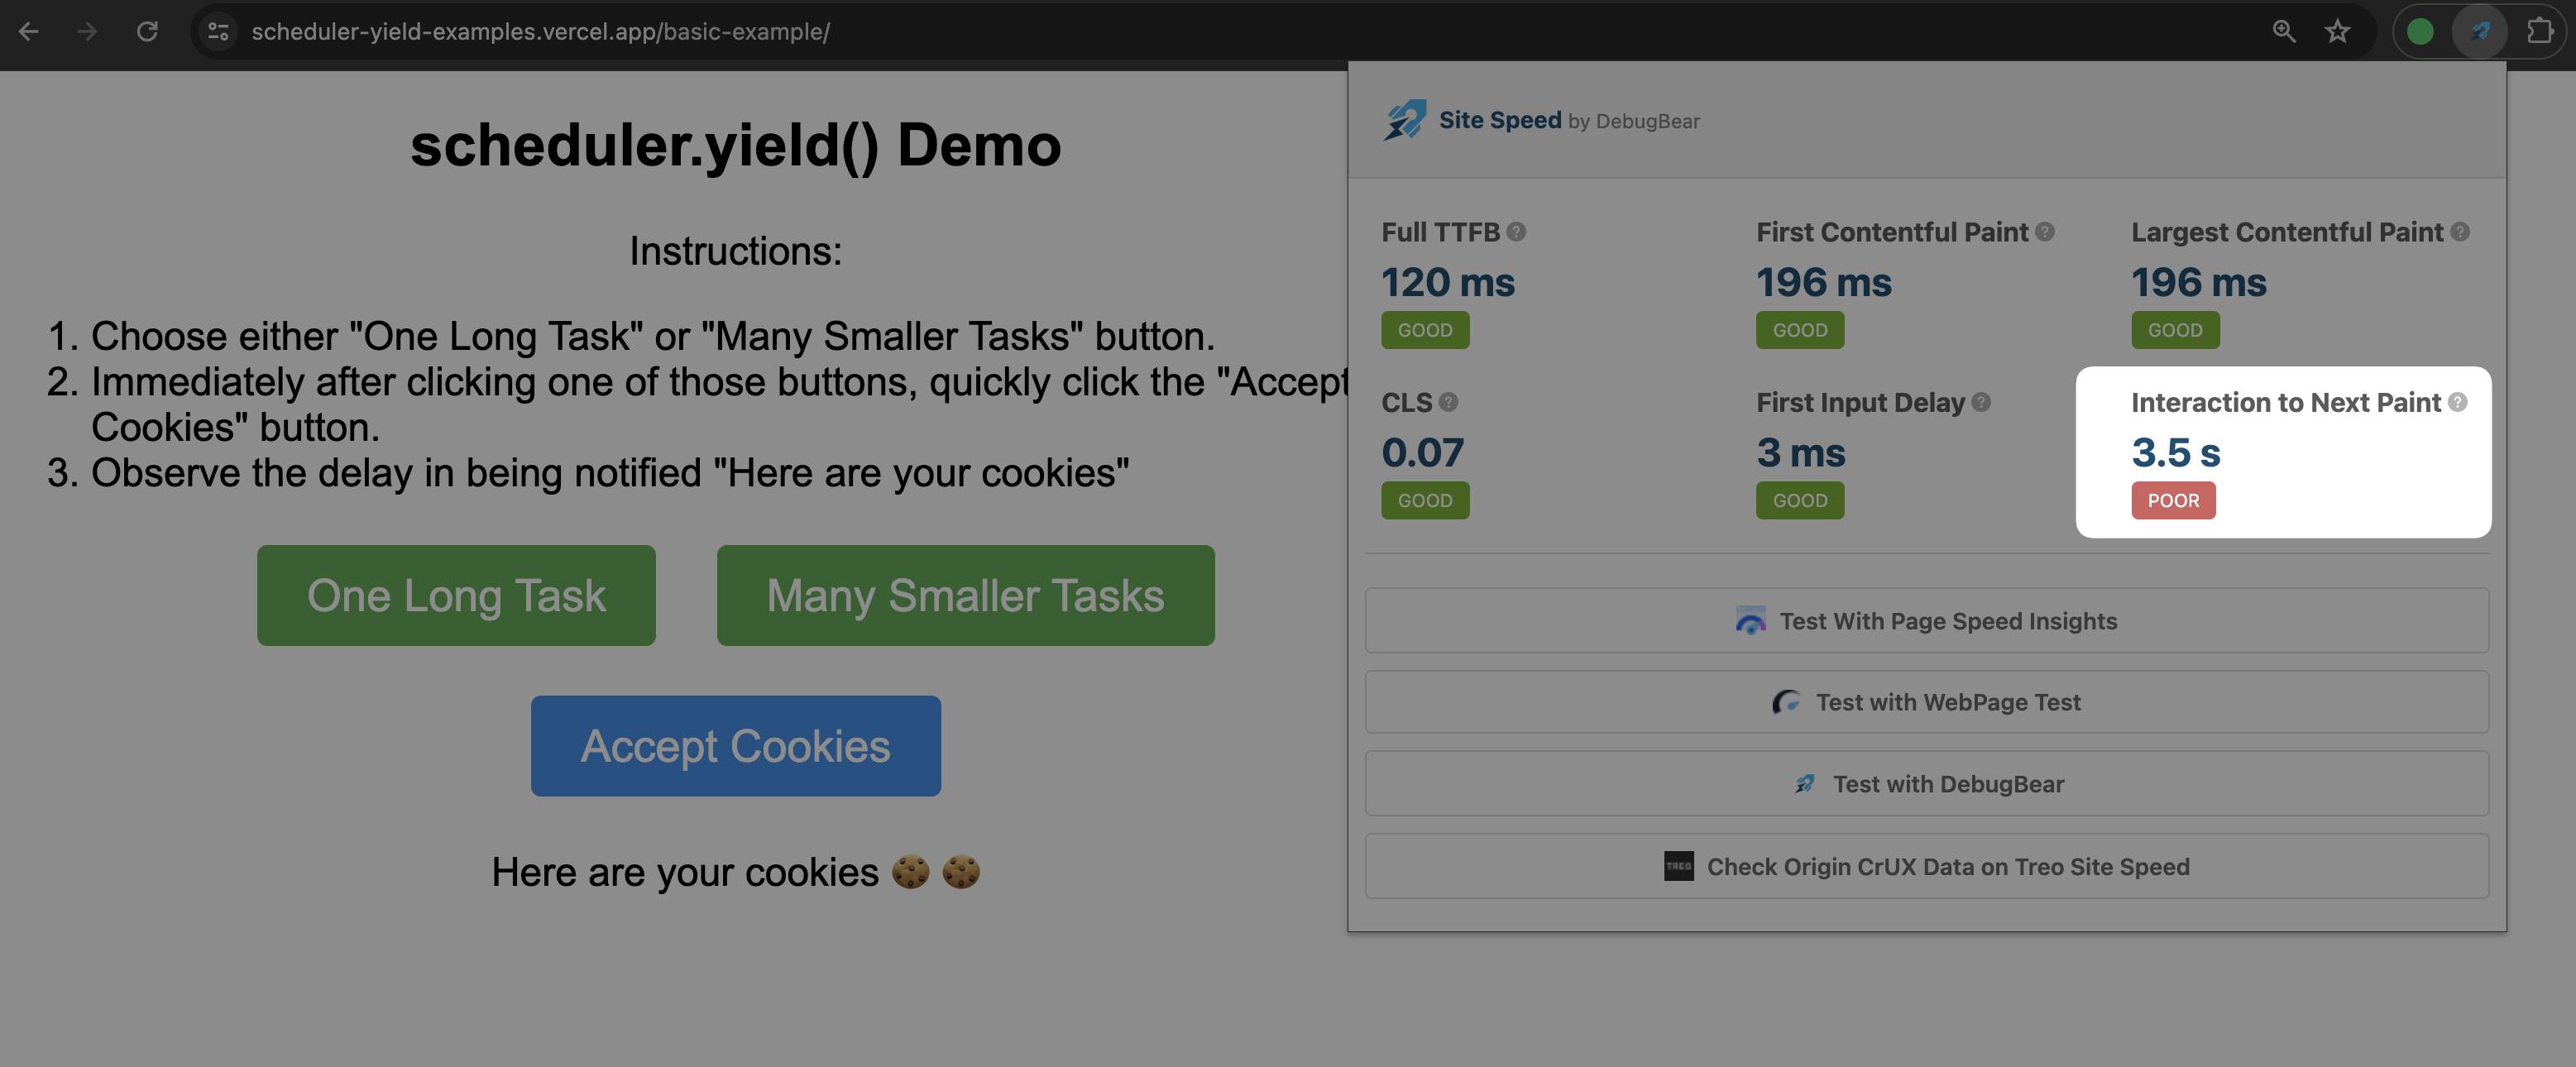
You can install the Site Speed by DebugBear Extension to see an overlay of Interaction to Next Paint (INP) times on your website, amongst other metrics.
Browser support
scheduler.yield is available in Chromium-based browsers like Chrome and Edge.
For other browsers, you can use this JavaScript check to see if scheduler.yield is available:
if ("scheduler" in window && "yield" in scheduler) {
  console.log("scheduler.yield is supported");
} else {
  console.log("scheduler.yield is not supported");
}
Fallback for unsupported browsers
A polyfill is also available for browsers that don't support scheduler.yield. You can find it on GitHub or on npm.
If you don't need all the features of scheduler.yield, you can consider this alternative fallback technique that involves using setTimeout to yield control back to the browser scheduler:
async function blocksInChunks() {
  // Blocks for 500ms
  await blockMainThread(500);

  // Yields to the browser scheduler
  await new Promise((resolve) => setTimeout(resolve, 0));

  // Blocks for another 500ms
  await blockMainThread(500);
}
While the behaviour of setTimeout is not exactly the same as scheduler.yield, you should still see an improvement in your web performance metrics when you use either technique.
The exact differences between scheduler.yield and setTimeout are out of scope for this article, but one important takeaway is:
- With
scheduler.yield, the continuation of work is placed at the front of the task queue. - With
setTimeout, the continuation of work is placed at the end of the task queue.
Generally speaking, scheduler.yield offers more predictable scheduling behaviour than setTimeout.
Consider the following code examples, and take note of their respective outputs:
With scheduler.yield (preferred):
// Adds to the task queue
setTimeout(() => console.log("Timeout callback"), 0);

console.log("Yielding with scheduler.yield");
await scheduler.yield();
console.log("Continuation after scheduler.yield");
scheduler.yieldYielding with scheduler.yield
Continuation after scheduler.yield
Timeout callback
With setTimeout (fallback):
// Adds to the task queue
setTimeout(() => console.log("Timeout callback"), 0);

console.log("Yielding with setTimeout");
await new Promise((resolve) => setTimeout(resolve, 0));
console.log("Continuation after setTimeout");
setTimeoutYielding with setTimeout
Timeout callback
Continuation after setTimeout
In both examples, take note of when the continuation of work occurs.
How DebugBear helps monitor the impact of scheduler.yield
DebugBear is a web performance monitoring tool that helps you track the performance of your web applications. DebugBear shows you:
- Interaction to Next Paint scores from CrUX.
- Specific Interaction to Next Paint data per-page view.
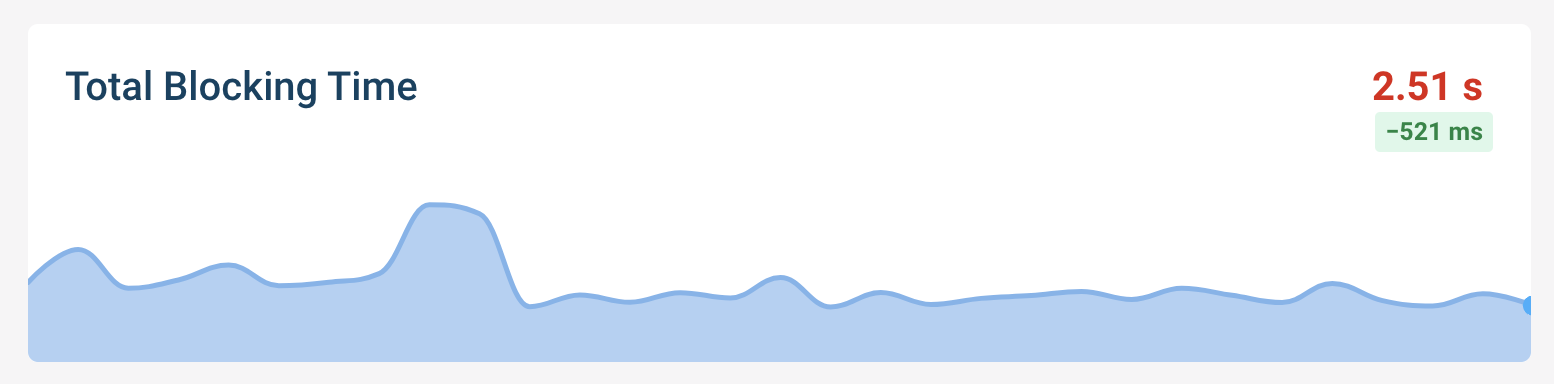
- A visualization of your Total Blocking Time metric.
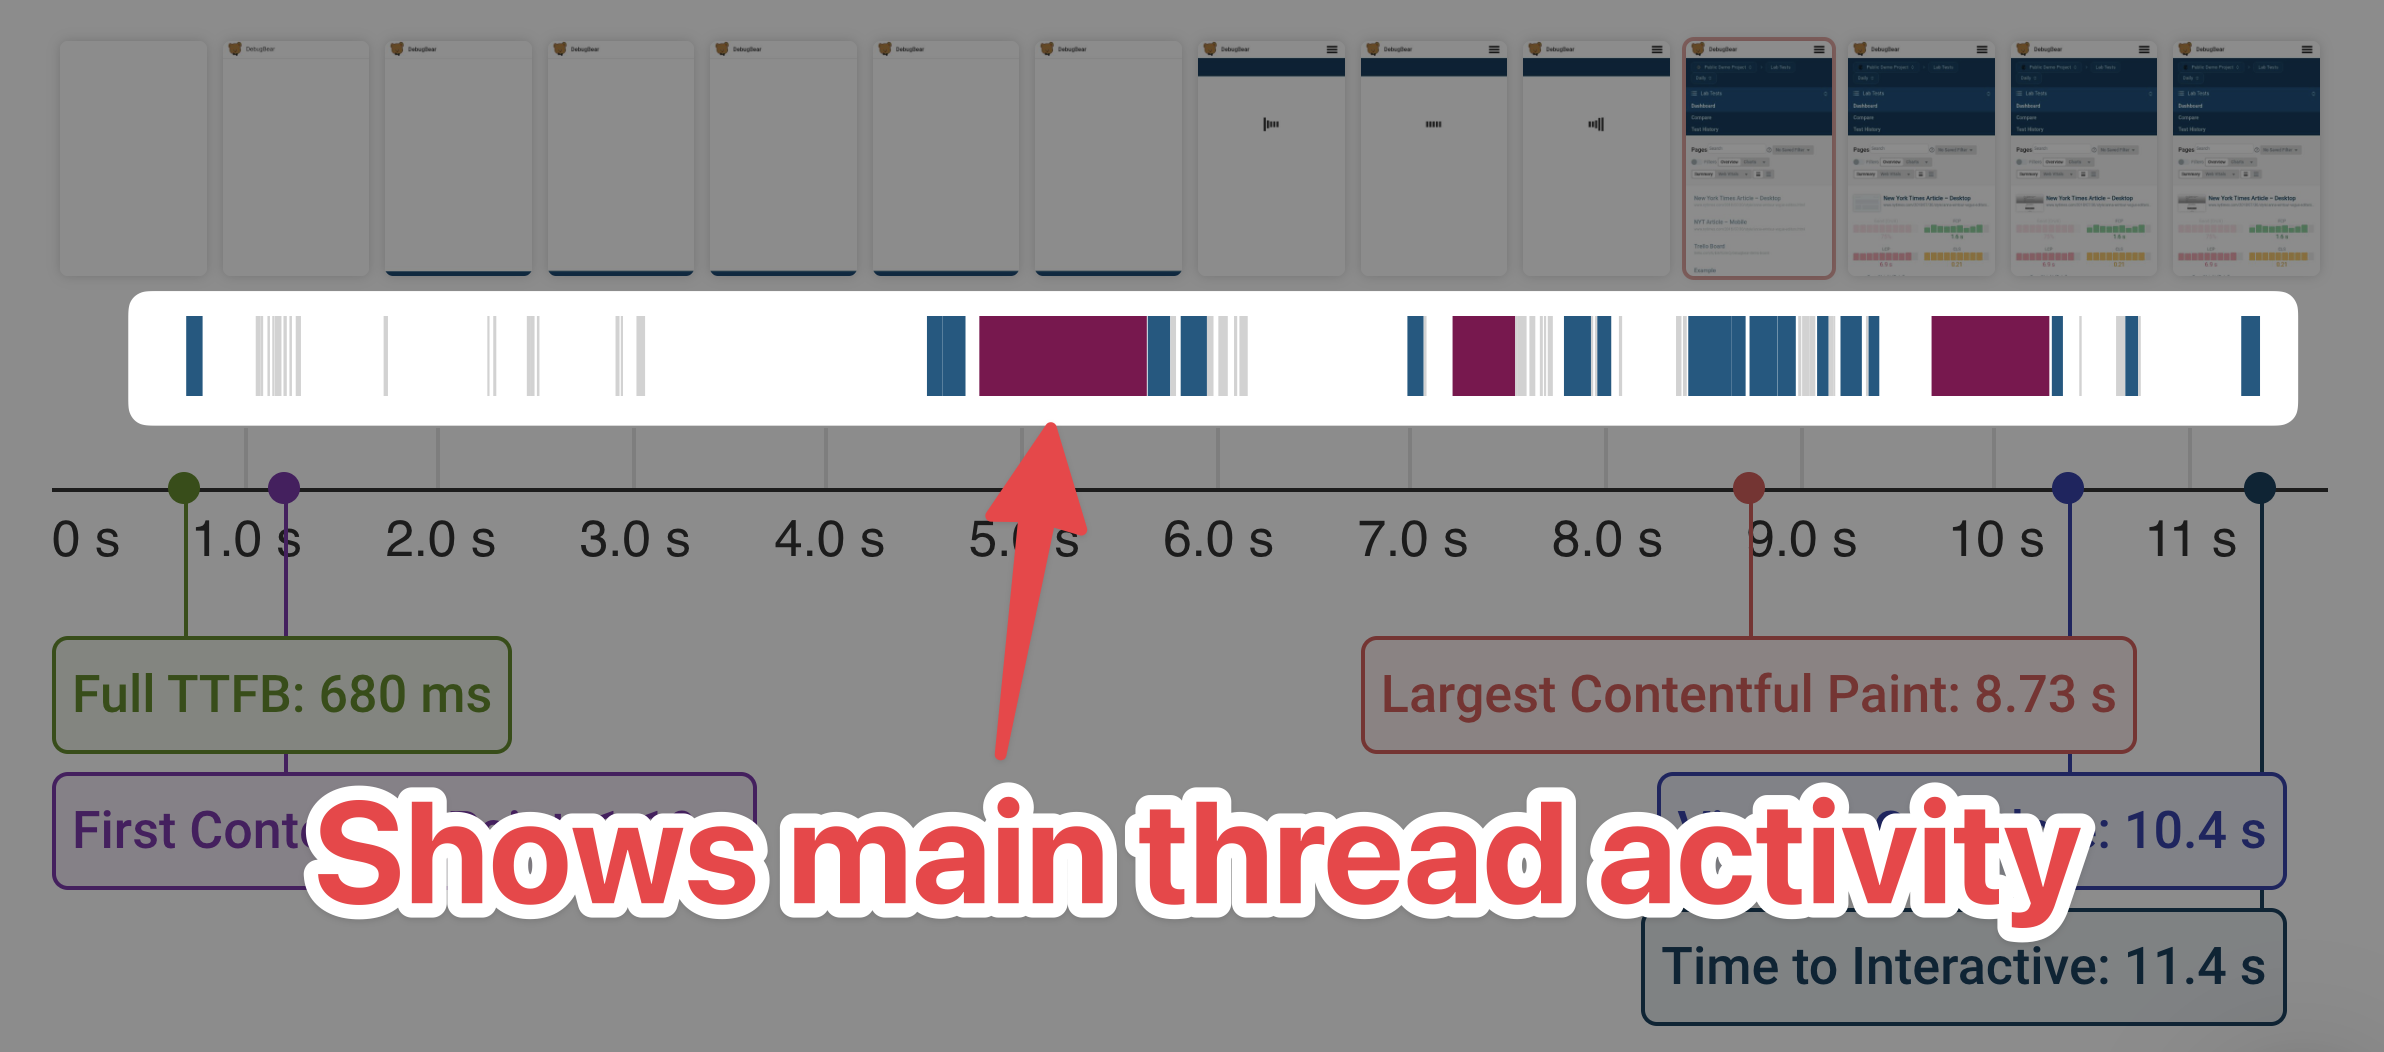
- A visualization of your CPU activity on the main thread.
When you use scheduler.yield, you can monitor the impact on your web performance metrics: your overall Interaction to Next Paint (INP) score should improve, as the browser can respond to user input more quickly as you chunk your work and frequently yield to the browser scheduler.
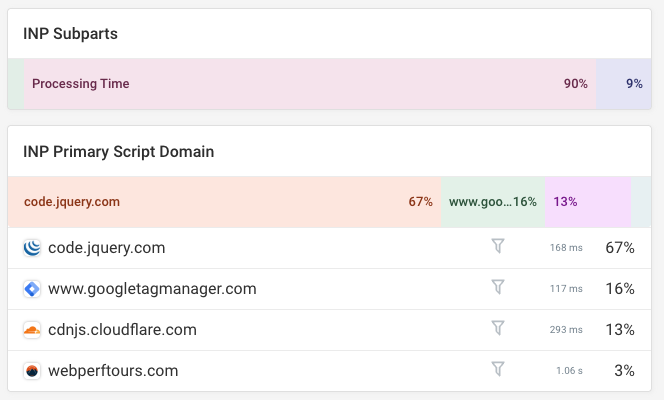
Where available, we display INP data from CrUX in your DebugBear report for scheduled tests. When you use DebugBear's real user monitoring feature, we display INP data per-page view. You also get a component-level breakdown of INP, which can help you identify which parts of your page are causing the most delay.
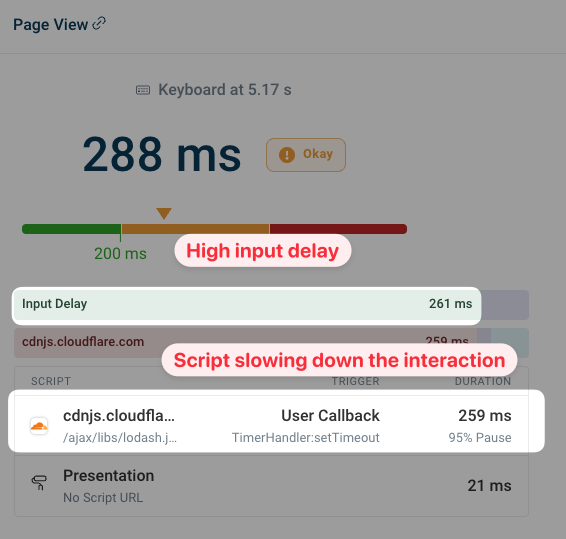
In the previous example, a high input delay is observed. This is because the main thread is blocked and the browser is unable to respond to user input. If you regularly yield back to the browser scheduler, you can reduce this input delay and improve INP.
You can also see how often different scripts cause interaction delays across your website.
When using scheduler.yield your Total Blocking Time score may improve, as you work to better orchestrate your JavaScript work, chunk tasks into smaller pieces, and minimise the tasks themselves.
A DebugBear report shows you activity that was blocking the CPU. You can view this on your timeline.
Conclusion
The scheduler.yield API helps you provide a better user experience for your users by yielding control back to the browser scheduler. This can help prevent your JavaScript code from blocking the main thread and improve your Core Web Vitals scores.
You should aim to split your work into smaller chunks and yield to the browser scheduler frequently, but you should also consider where it makes sense to do so. For example, you might not want to yield control back to the browser scheduler in the middle of a critical operation.
You should consider other scenarios. What happens when:
- The
scheduler.yieldrejects the promise and your work is not completed. - The page is closed before the
scheduler.yieldpromise is resolved. - The delay between the
scheduler.yieldpromise being resolved and the continuation of work is unexpectedly long.
Take note that scheduler.yield is not a magic bullet. For example, when you yield to the browser scheduler, the browser might decide to run another task that blocks the main thread. You should also consider that interspersing your existing code with scheduler.yield calls is not guaranteed to improve performance.
When you make use of scheduler.yield, you should monitor the impact on your web performance metrics. DebugBear helps you monitor the impact of scheduler.yield as experienced by your real users.
Sign up for a free trial to get real-time Core Web Vitals reporting with in-depth debug data for slow interactions.


Monitor Page Speed & Core Web Vitals
DebugBear monitoring includes:
- In-depth Page Speed Reports
- Automated Recommendations
- Real User Analytics Data