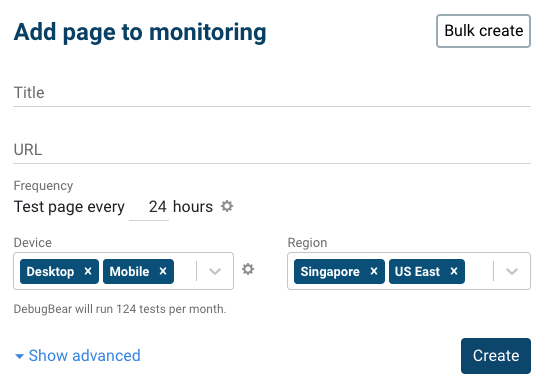
November brought a bunch of UX improvements, including the ability to set up monitoring for multiple test locations and devices at once.
Set up multiple devices and locations in one go
To make setup easier, you can now select multiple device types and test locations and set up monitoring for them in one step.

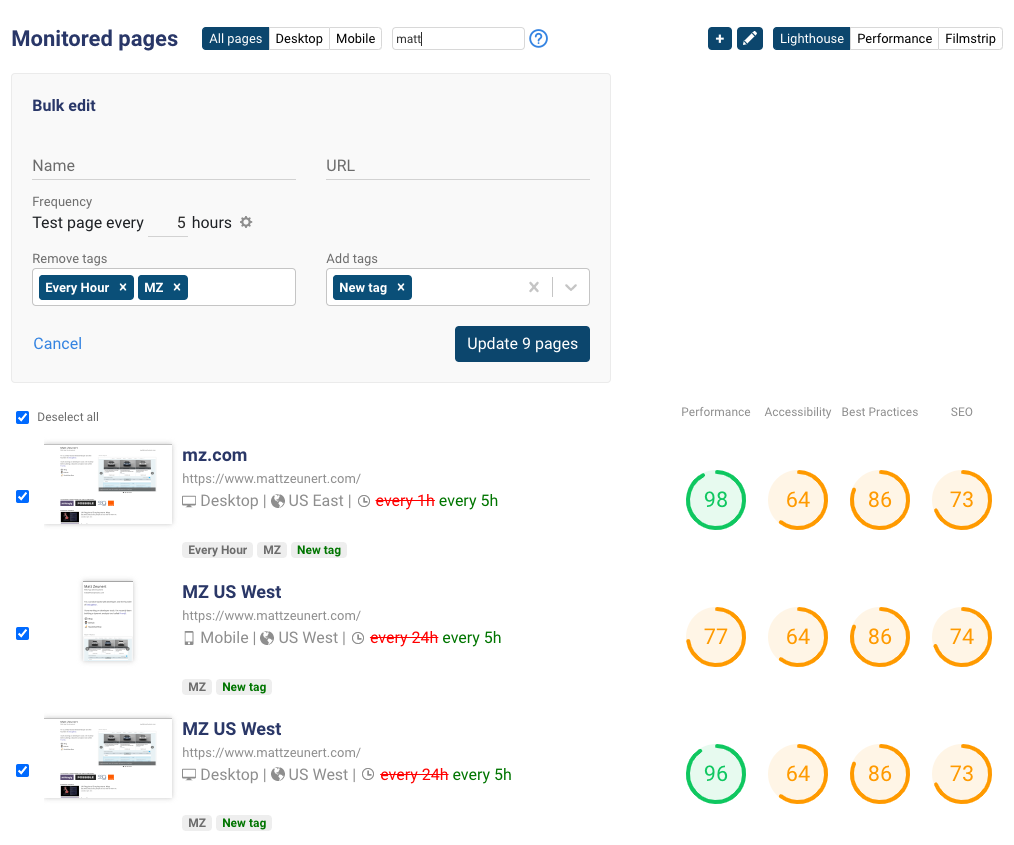
Bulk edit pages
You can now update some properties of multiple pages at once:
- Page Title
- Page URL
- Test frequency
- Tags
First, click the edit icon in the top right of the Project overview page.

Then select the pages you want to update, either by using the standard search filters or by toggling the checkboxes. Then set the new values, and click the Update button.

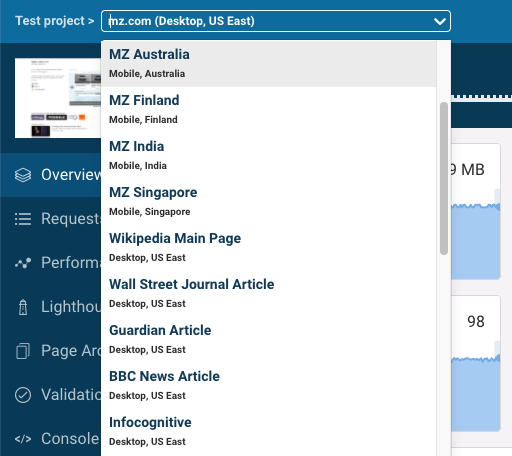
Page switcher
You can now navigate directly from one monitored pages to another. The dropdown normally shows pages with the same URL first, so you can easily switch between Desktop and Mobile monitoring results.

To make space for the dropdown, the "Open tested page" link has moved to the top right, next to the page ID.

New blog posts
Lighthouse automatically tests the Performance, SEO , and accessibility of your website, but you can also add your own audits and audit categories.
Repeating performance tests reduces overall metric variability – this blog post quantifies how by much variance is reduced when running tests 3, 5, or 7 times.
Creating a web performance team can help make site speed a priority in your company. Marc Radziwill explains how to get started and make performance teams successful.
Millions of websites are built using website builders – we took a look at how site performance compares between different site builders.
New metrics documentation
The documentation now contains an overview of the Core Web Vitals, which start affecting Google search rankings next year.
There's also an in-depth look at one of the Core Web Vitals, the Largest Contentful Paint.