DebugBear now makes it easier to show historical metrics data for all monitored pages.
Trendlines
The project overview page now shows weekly averages for the last 10 weeks, rather than just the most recent scores and metrics.
Lighthouse 7.0
DebugBear now runs test using the latest version of Lighthouse.
- The third-party facades audit suggests using a static placeholder for third-party widgets, until the user starts interacting with the widget.
- In some cases Lighthouse now waits longer for the page to load, for example if there's a single XHR request that delays rendering. This makes the metrics more accurate.
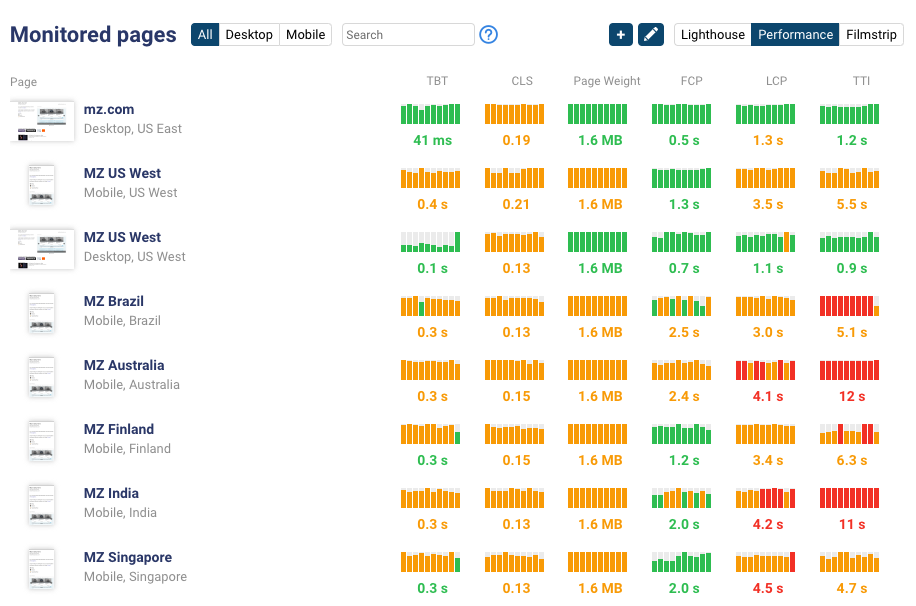
Improved mobile site
The mobile project overview now also shows performance metrics, and you can use the same filters as on desktop.
New blog posts
Why is the Google Cloud UI so slow – a look at a large JavaScript application and what's slowing it down.
Debugging web performance with the Chrome DevTools Network tab – a detailed explanation of the information DevTools provides about network activity.
Updated documentation
Want to script user journeys and measure their performance? This article explains how to do that for single-page apps.