Update: read the 2021 Chrome Extension Performance Report
I tested how the 1000 most popular Chrome extensions affect browser performance.
The main metrics I'll consider are CPU consumption, memory consumption, and whether the extension makes pages render more slowly.
Here's a list of all tested extensions and their results (this link now shows 2021 data).
Update 8 July 2020: I originally reported the simulated FCP metric provided by Lighthouse rather than the First Contentful Paint observed in the browser. I've now updated the charts and the list of extensions.
Performance impact of the Top 100 extensions
Let’s start by looking at the 100 most used Chrome extensions. Each of these has been installed more than 2 million times.
We’ll look at four different metrics:
- Page CPU time How long is the page main thread busy for, and what is it doing?
- Page rendering delays How long does it take until the page displays some content?
- Background CPU time How much processing does the extension do in the background?
- Browser memory consumption How much memory do different components of the browser use?
Page CPU Usage
JavaScript execution or running layout logic blocks the browser main thread. This means the browser can’t respond to user interactions.
If no extension is installed, loading example.com takes around 40ms of CPU time. If you’ve installed Evernote or Grammarly this jumps to over 500ms.
This chart shows the 20 slowest extensions out of the 100 most used Chrome extensions. The other 80 all add less than 100ms of additional CPU time to the page.

Rather than targeting specific sites, these extensions add code to every page opened by the user. Let's take a look at what some of them are doing.
Evernote Web Clipper
The Evernote extension has over 4 million users. It adds a 2.9MB content script to every page. 140ms are spent just parsing and compiling that code.

Once the bundle has been loaded it needs to be evaluated, which takes another 300ms.
Does this code actually do anything? As far as I can tell, no, not unless the user clicks the Evernote extension icon.
The code does set up an event listener that’s fired when the user clicks the icon, but this can be done without loading the full JavaScript bundle.
Grammarly, Clever, Avira Password Manager, Skype
This pattern of loading large amounts of unnecessary code repeats with other Chrome extensions.
| Extension | Page Script Size | Page CPU Time |
|---|---|---|
| No Extension | 0MB | 42ms |
| Evernote Web Clipper | 2.9MB | 559ms |
| Grammarly | 1.3MB | 507ms |
| Clever | 2.6MB | 335ms |
| Avira Password Manager | 1.5MB | 405ms |
| LastPass | 0.8MB | 241ms |
| Skype | 1.5MB | 191ms |
Extensions often need to inject code into every page, rather than only targeting certain domains. Password managers need to check if there's a login form. Spell checkers need to look for text fields.
However, for performance it would be much better if the code that checks the relevant conditions was separated from the primary functionality of the extension. Then most of the code would only be loaded when necessary. Honey made this change last year and it greatly reduced their performance impact.
Interestingly, Skype only adds 150ms of CPU time, even though it has a large JavaScript bundle. My guess is that this is due to the code mostly consisting of static configuration objects and long strings that are easy to parse and evaluate.
Ghostery
I was surprised to see Ghostery relatively high up in the list. Unlike the other extensions it actually does something on the page, namely displaying how many trackers were blocked.
Ghostery loads 160KB of JavaScript and adds 120ms of CPU time – not a huge amount. However some of this code is render-blocking, as we’ll see in the next section.
Page rendering delays
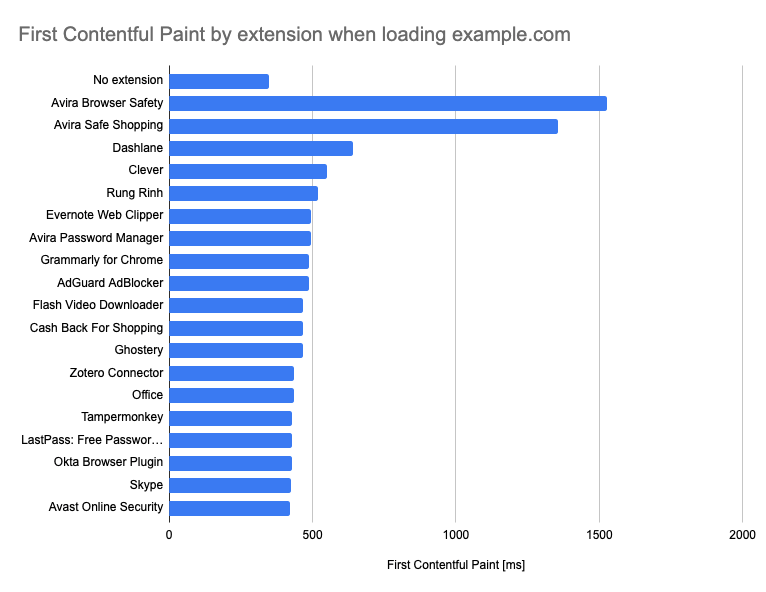
While extra CPU time means the page isn’t interactive for some time, this doesn’t normally completely block the page from rendering. To see if an extension blocks rendering we can look at the First Contentful Paint metric – when the browser starts to display text or images.
Most extensions introduce no or only minor rendering delays. This chart shows the extensions with the largest negative impact on initial content rendering.
Note that the FCP impact of Avira isn't caused by request blocking logic running in the background. We'll see what's going on there in the next section.
Chrome extensions can define scripts and stylesheets that should be injected into the page. By default these are added to the page once the page has finished loading and is idle.
However, extensions developers can decide to load these resources as soon as the page starts loading. For example, the Dark Reader extension changes website content to a dark theme. It would be jarring to first render pages in a bright theme and then suddenly transition. Here it makes sense to run the code before the page starts to render.
The amount of this code should be reduced to a minimum. The good news is that only 12 of the extensions in the chart cause a rendering delay of more than 100ms.
Clever, Grammarly, Rakuten Get Cash Back for Shopping, LastPass
These extensions all run significant amounts of code before the page starts rendering. In the case of Clever, page content only starts showing 300ms later than without the extension installed.
AVG/Avast SafePrice
While SafePrice doesn’t wait until the page is idle before injecting scripts, it does wait until the document has loaded. I'm not sure why, but somehow the JavaScript code still appears to run before the initial render.

Background CPU Usage
Not all processing that a browser extension does happens on a page that's visible to the user. Most Chrome extensions also have something called a background page which lets the extension do things like listen to network requests or update the extension icon.
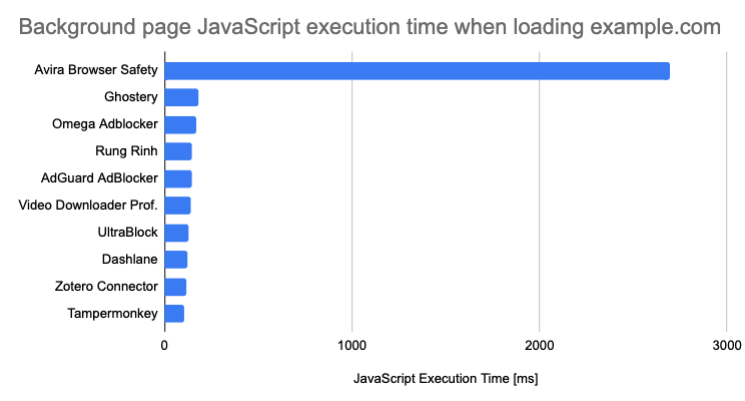
Avira Browser Safety spends almost 3s running code in the background page, while all other extensions spend less than 200ms.
Background pages often run code in response to network requests made by the page that was opened by the user. The page from the previous test only makes one network request, far less than normal. So I ran this test again, this time loading the Apple homepage, which makes around 50 requests.
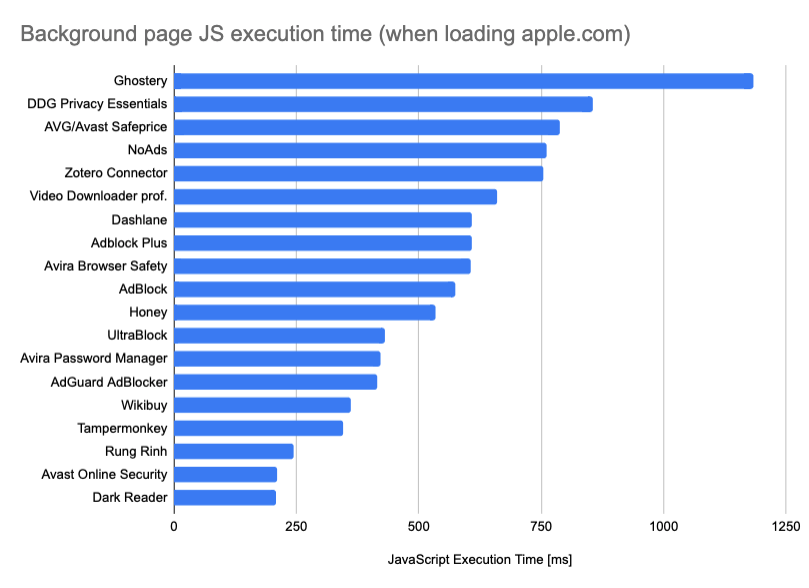
Interestingly Avira is now significantly faster, 600ms instead of 2.7s! What’s going on?
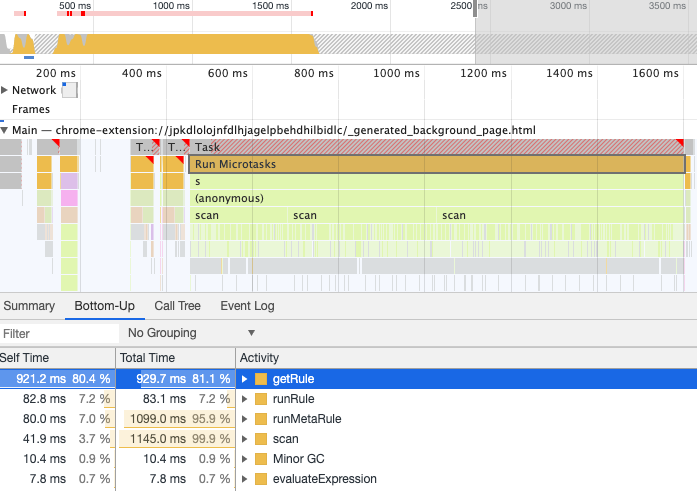
The Avira Browser Safety extension contains a website allowlist with 30k+ regular expressions. When the user navigates to a new page Avira checks if the page URL is in that allowlist:
{
  key: "_isWhitelisted",
  value: function _isWhitelisted(url) {
    return !!this._whitelist && this._whitelist.some(function (pattern) {
      return pattern.test(url);
    });
  }
}
Apple.com is in the allowlist, and because the list is sorted alphabetically the function quickly finishes. Example.com is not in the list, so the extension ends up checking the URL against all 30 thousand regex patterns.
Browser memory consumption
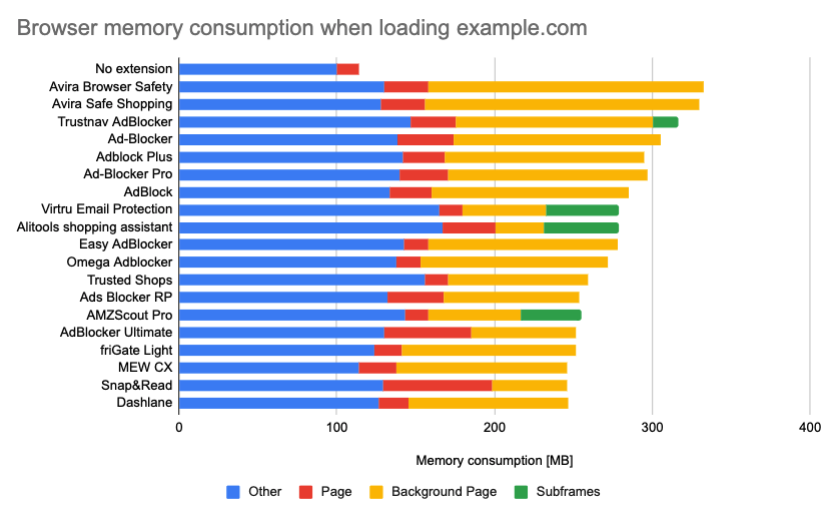
Chrome extensions can increase memory consumption, both in pages opened by the user and in the extension background page.
Again, Avira Browser Safety is at the top of the list, increasing memory consumption by 218MB. This is due to the 30k+ regular expressions – I think they are compiled to bytecode or machine code, which needs to be stored in memory.

Some background pages also contain iframes, for example the Amazon Assistant extension:
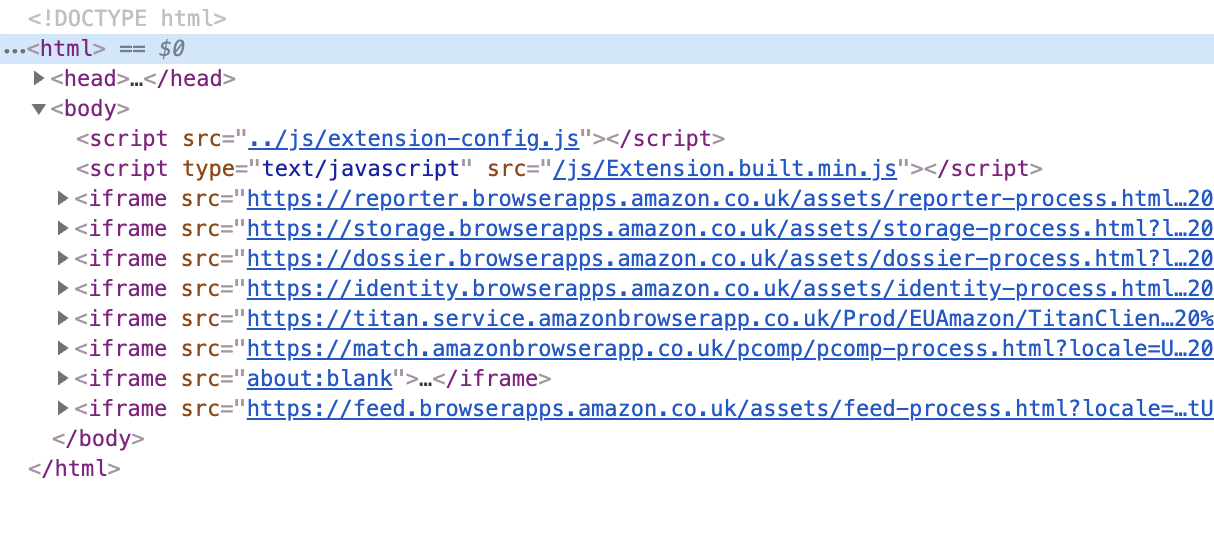
An extension with a background page increases memory consumption by at least 10MB. If there's no background page and only a small on-page script then the extension's memory impact can be minimal.
Performance impact of the Top 1000 extensions
Let’s look at some slightly less popular extensions with 100k+ users.
Page CPU Usage
Previously Evernote had the greatest negative performance impact, increasing CPU times by 560ms. There are 9 extensions among the top 1000 with a greater negative impact than that.

Vigia de Preço
Vigia de Preço is a Brazilian coupon and price watching extension with 200k users. It blocks the main thread for 1.6s.
A big part of this is using fingerprintjs2 to generate a token. For example, this involves rendering an image and generating a data URL for it, in order to detect if certain Canvas features are supported by the browser.

Snap & Read
Snap & Read has over half a million users and helps them read and understand texts. On every page it loads a 3.8MB lexicon.js file, which is where most of the parse and compile time is spent. Parsing this would likely be much more efficient as a JSON file.
It then processes the lexicon and loads a bunch of libraries like compromise, jQuery, pdfmake and citeproc. In total Snap & Read loads 7.5MB of JavaScript code on every page.
壹伴 · 小插件
This is a Chinese Chrome extension with 300 thousand users. It seems to mostly extend the WeChat web editor, but it loads 4MB of code on every page anyway.
MozBar
MozBar is an SEO tool with 700 thousand users. It doesn’t seem to do much unless you actually click the extension icon, but still runs 3MB of code.
Page rendering delays
Do the additional processing block the page from rendering? Most of the time, no.
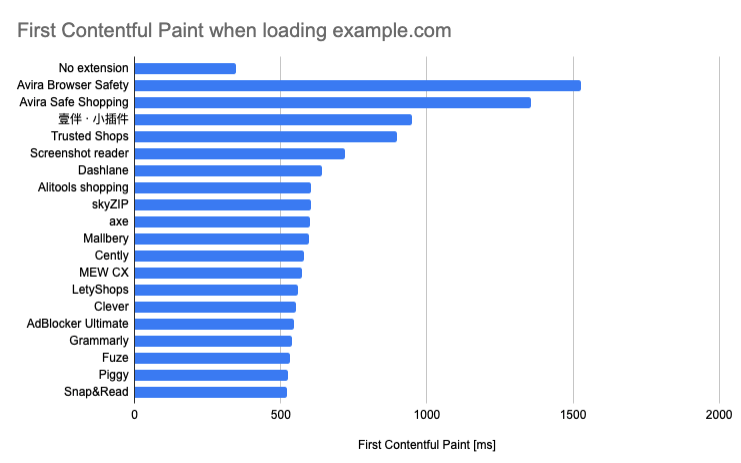
壹伴 · 小插件 loads 14 content scripts that take over 700ms to process before the page rendering starts. Axe loads two content scripts worth 1.8MB before the page is rendered.
Background CPU Usage
Looking at background pages, no other extension exceeds the additional processing introduced by Avira Browser Safety and Avira Safe Shopping.
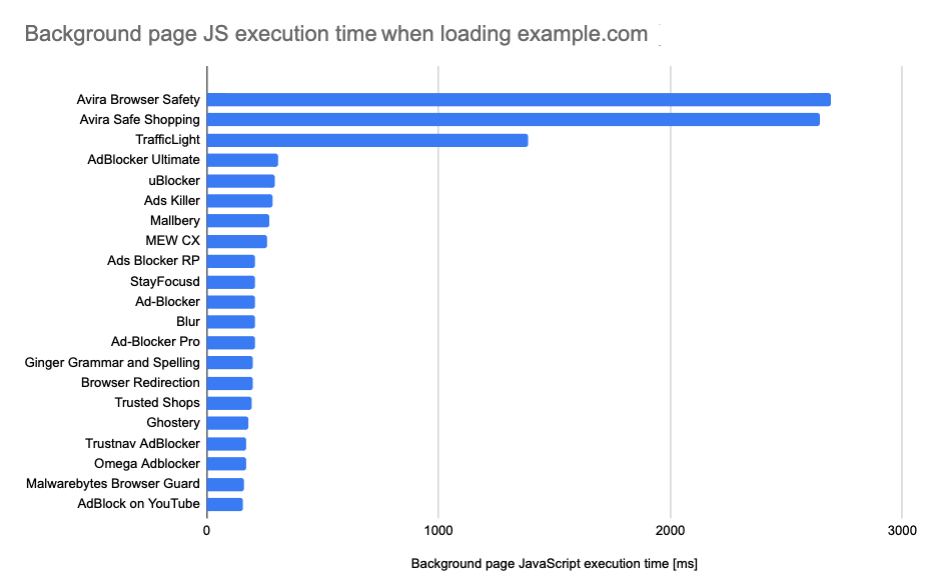
TrafficLight
Bitdefender TrafficLight is a security extension with 600k users. It checks request URLs against a list of several thousand criteria that might indicate a security issue. To do that it needs to iterate over that list and check if the current URL matches.
Browser memory consumption
Interestingly, on a page without ads, ad blockers significantly increase browser memory consumption. This is mostly due to storing large domain blocklists.
Performance impact of ad blockers
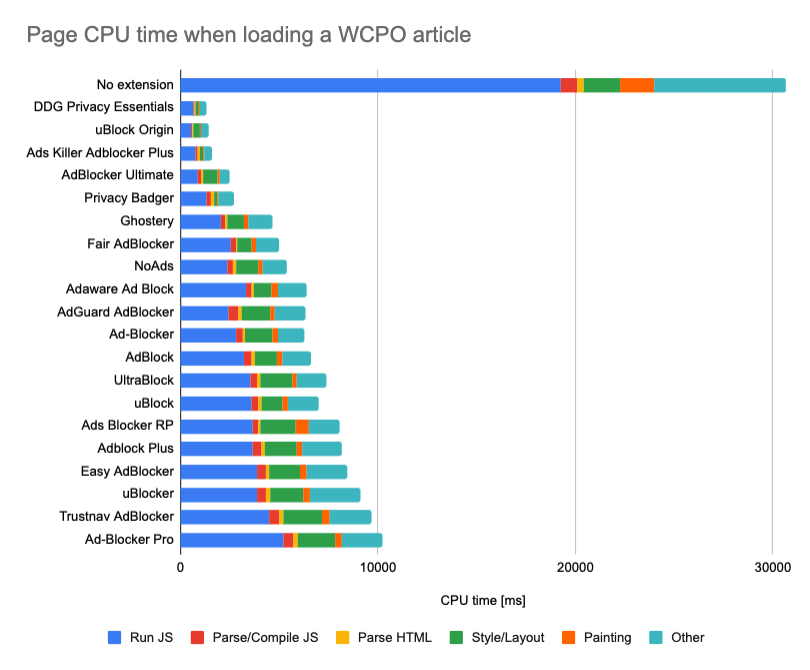
I tested how 20 ad blockers and privacy tools affect performance when loading a WCPO news article.
Page CPU Usage
DuckDuckGo Privacy Essentials reduces the CPU time of the article page from 31s to just 1.6s. All other tested extensions also bring CPU time down to at most 10s.
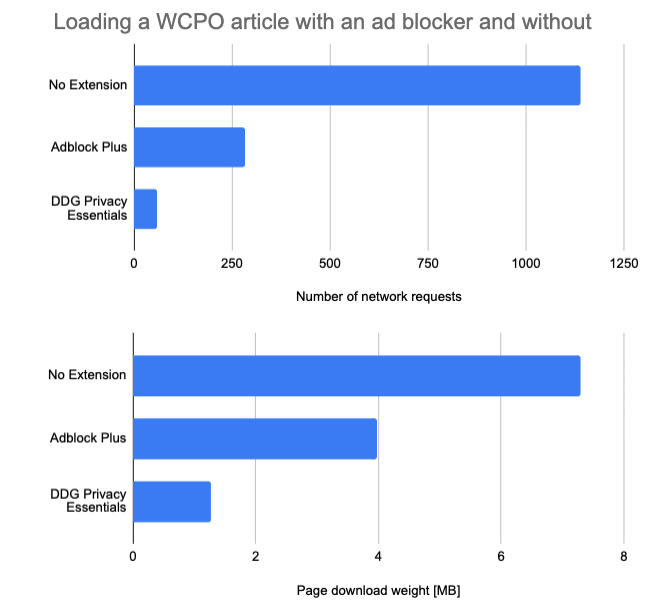
Most ad blockers work by blocking certain network requests that are initiated by the page. DDG Privacy Essentials reduces the number of network requests by 95% and the download weight by 80%.
Background CPU Usage
Chrome extensions need to do some processing to decide what requests to block. This work happens in the background page. So while ad blockers save CPU time on the page, they also slightly increase it in the background.
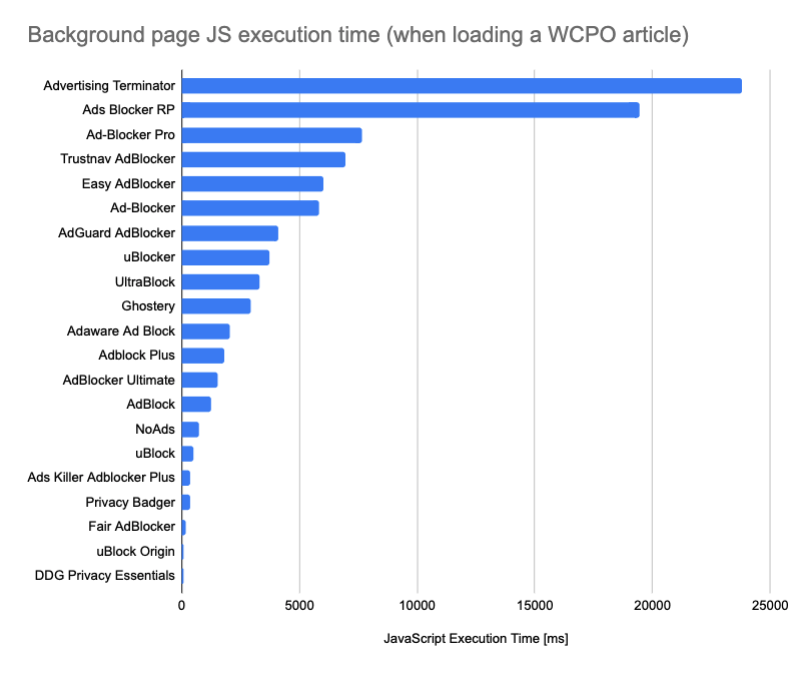
What’s causing these large discrepancies? Ad blockers store a list of criteria for what requests to block, and then need to match request URLs against that list.
Ads Blocker RP iterates over more than a thousand regular expression and checks if they match the request URL. Doing this can take 10s of milliseconds, quickly adding up if hundreds of requests are made.
DDG Privacy Essentials does a simple object property lookup based on the request domain, an operation that is practically instantaneous.
Browser memory consumption
Ads are usually served in iframes that are isolated from the main page content. The subframes of the tested news article use 536MB of memory.
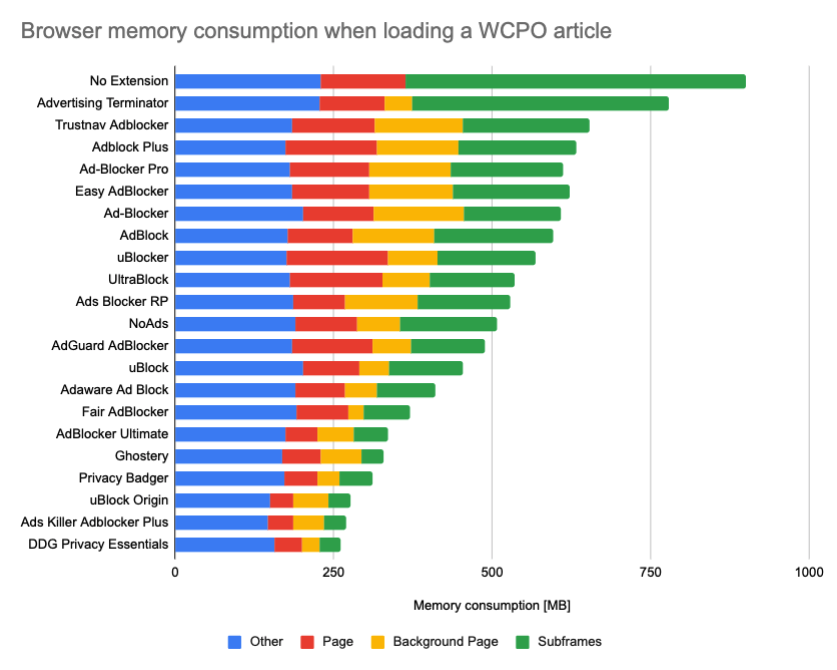
Running the ad blocker background page uses up some memory – up to 142MB in the case of Ad-Blocker.
However, this is greatly outweighed by the reduction in page and subframe memory consumption by up to 640MB.
Performance impact of the Top 100 developer tools
Let’s look at top 100 extensions in the Developer Tools category of the Chrome Web Store.
Page CPU Usage
Only a couple of tools meaningfully increase on-page CPU time.
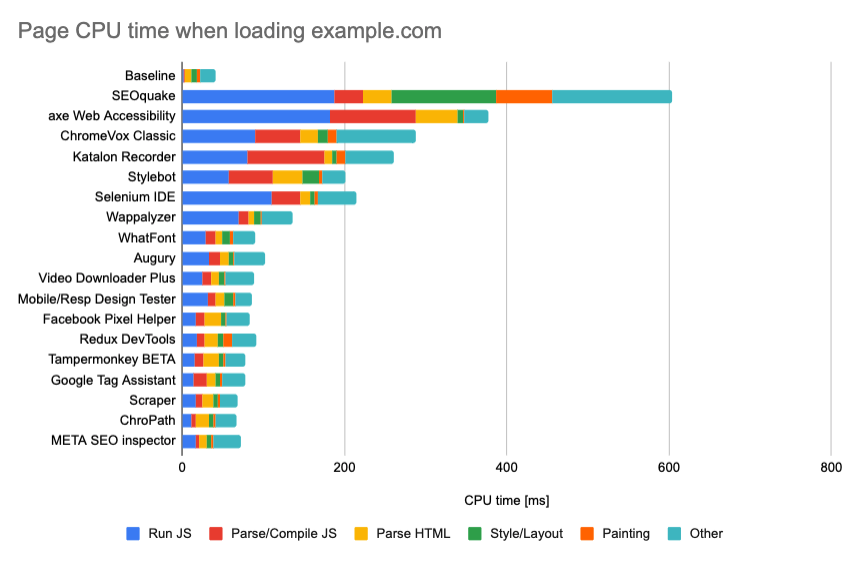
SEOquake displays a bar at the top of the page, causing the page to relayout and repaint.
Selenium IDE injects 700KB of JavaScript, even if you’re not recording a test.
Page rendering delays
Apart from axe, no other developer tool meaningfully delays rendering.
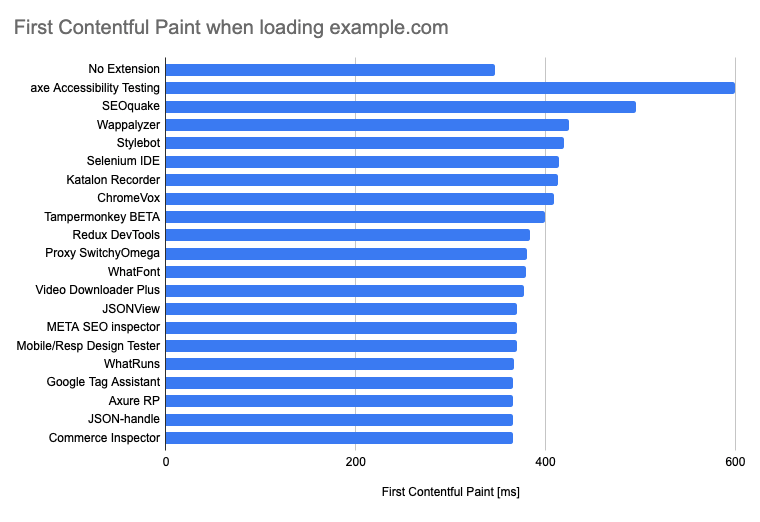
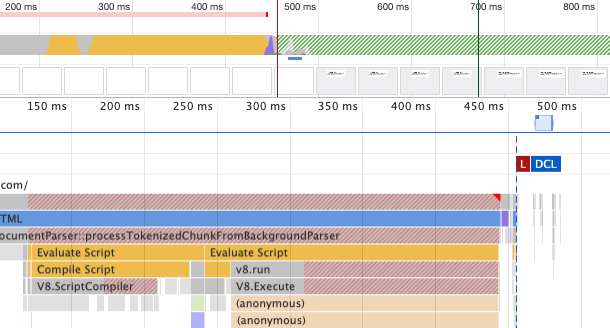
Axe loads three content scripts before the page starts rendering. This can probably be avoided, since the accessibility tests are only run when the user clicks a button in Chrome DevTools.
Background CPU Usage and browser memory consumption
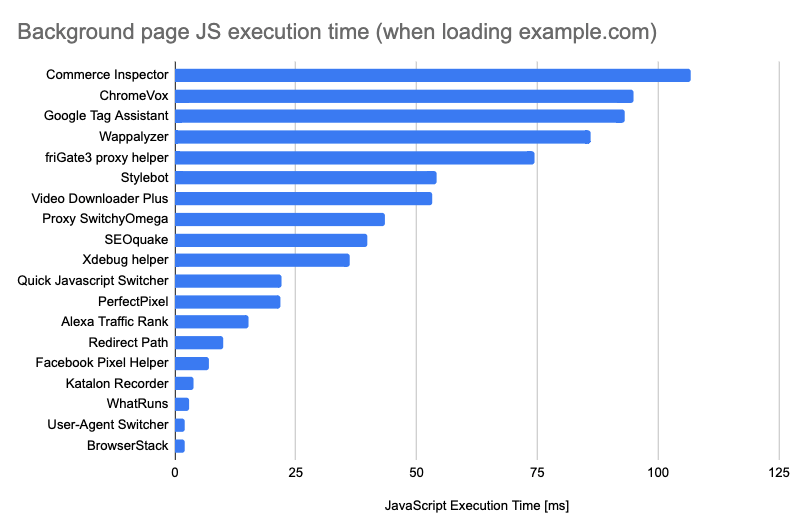
There's nothing too interesting to see here. Background CPU usage was always below 120ms. ChromeVox caused the highest increase in memory consumption, with a moderate 80MB.

What can extension developers do to keep their extensions fast?
Extension developers can limit the performance cost by only loading scripts when necessary. Where possible, use the URL filter provided by the Chrome extension platform.
If that's not an option, use a small script that detects if the extension needs to do anything on the page. If that's the case, the small script can pull in any additional code.
Strongly avoid loading content scripts on document_start. Where necessary, keep their size under 100KB.
Avoid iterating over a list of thousands of URL filtering criteria, especially if the criteria depend on complex logic or regular expressions.
If you programmatically update the extension icon at runtime, debounce this operation. Each update only takes about 25ms, but this adds up if you update the icon 10 times while loading a page.
Conclusion
Most websites take at least a second to load, so if an extension adds another 100ms the user might not even notice. However, doing this on every single page adds up.
Many users have several extensions installed, so a small performance impact can add up to a large negative effect on user experience.
I ran these tests on an n2-standard-2 Google Cloud instance, the numbers in this report show the median of 7 runs.
About 20 extensions were excluded because I couldn't get them to run correctly in the test environment. A large percentage of extensions only modify the New Tab screen – I excluded those extensions from the test as well.
I tested the how the 1000 most popular Chrome extension impact browser performance. Here are the results. Thread 1/N...
— DebugBear (@DebugBear) June 15, 2020
➡️ https://t.co/chyqyRiMAs