This report investigates how 1000 of the most popular Chrome extensions impact browser performance and end-user experience.
Check the 2024 version of this report for more up-to-date data.
Key findings of the 2021 report:
- Popular extensions like Honey, Evernote Web Clipper, and Avira Browser Safety can have a significant negative impact on website speed
- On ad-heavy websites, ad blockers and privacy tools can greatly improve performance
As the performance impact varies between different websites, five different pages were included in the test: a simple test page, apple.com, toyota.com, and news articles by The Independent and the Pittsburgh Post-Gazette.
Want to find out if any of the extensions you use are slowing you down? Look up the extension here.
Contents
- Increasing website CPU usage
- Impact on page rendering times
- Background CPU usage
- Browser memory consumption
- How do ad blockers and privacy tools affect browser performance?
- What happens if I have more than one extension installed?
- How do these browser performance results compare to last year's?
- A look at individual extensions
- Methodology
Increasing website CPU usage
Many Chrome extensions have the ability to run extra code on every page you open, although well-built ones only run code where necessary.
Among the 100 most popular Chrome extensions, Evernote Web Clipper has the biggest negative impact on performance. It spends 368 milliseconds running code on every page you open. If you try to interact with the page during this time the response will feel sluggish.
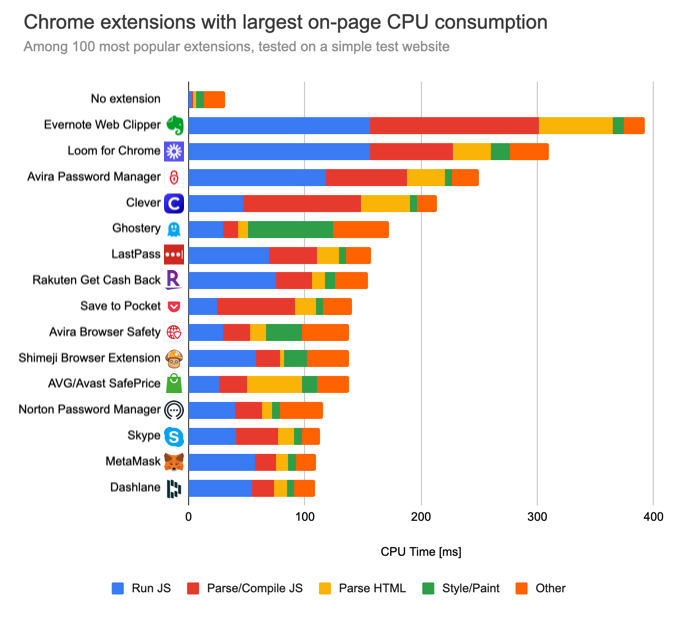
Each of these browser extensions has been installed over a million times. While a few hundred milliseconds may not sound like much, if multiple extensions are installed this can have a significant impact on user experience.
The speed impact of a browser extension depends on the website opened by the user. The results above were collected on a very simple website and generally represent the minimum per-page performance impact of a Chrome extension.
When testing extensions on the Apple homepage we can see that a dark mode extension called Dark Reader spends 25 seconds analyzing and adjusting images so that they better fit into a dark theme. As a result the page loads much more slowly, as we'll see later on.
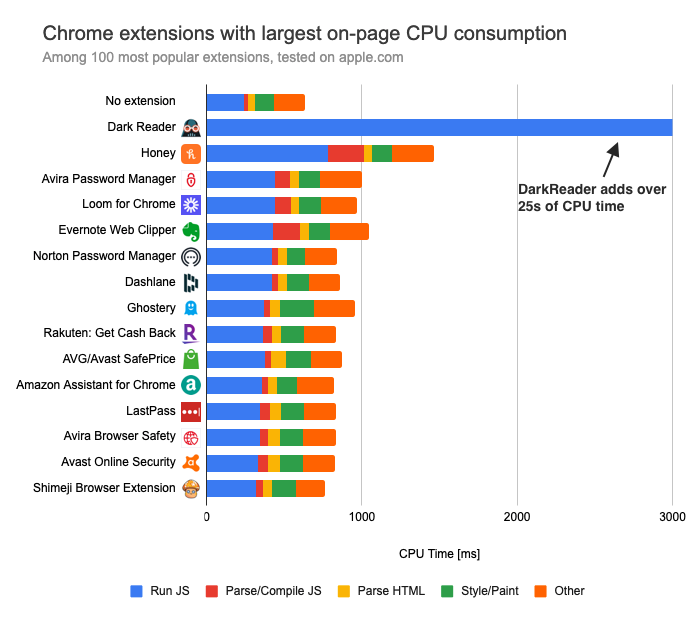
Coupon code finder Honey also significantly impacts site speed on ecommerce websites, adding 825 ms of CPU processing time.
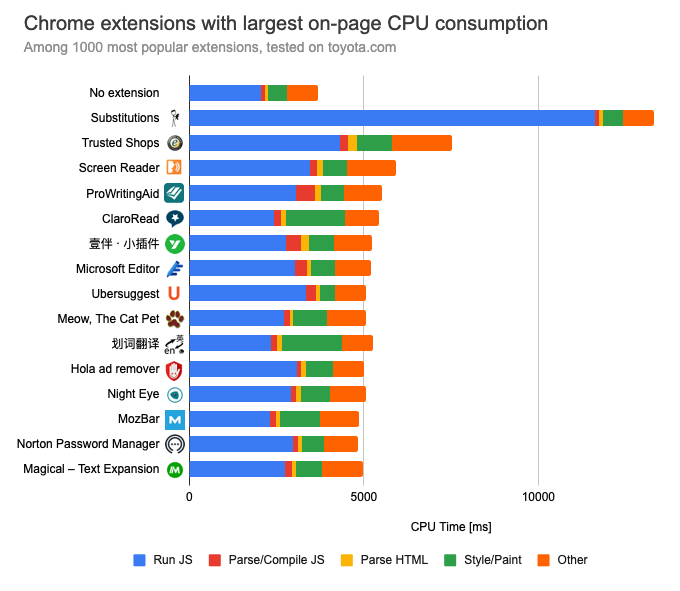
Finally, when running the tests on the Toyota homepage, we can see that Norton Password increases CPU activity the most, adding about 1 second of CPU time.
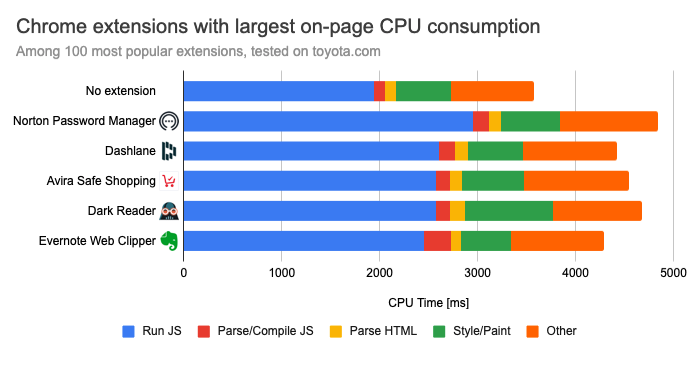
This chart only shows the 5 extensions with the biggest impact on performance. Even without any extensions installed, toyota.com uses over 3 seconds of CPU time, so it's harder to separate random variation from the impact of an extension.
Top 1000 extensions
Let's look at some other extensions that are less popular, but still have more than 100,000 installs each.
Ubersuggest, a marketing tool with over 200,000 users, adds 1.6 seconds of CPU activity to every page.
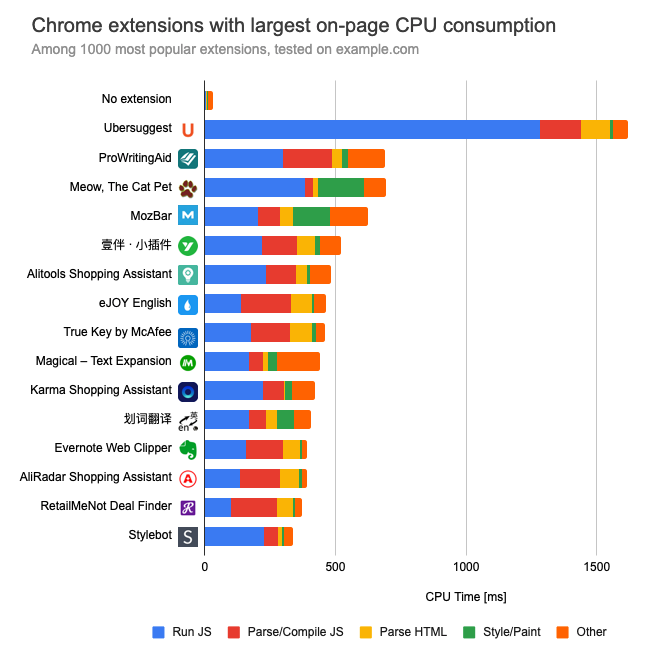
Substitutions is a Chrome extension that automatically replaces certain words on a page. On a small website it has little performance impact (adding about 10 ms of CPU time), but on a larger page like toyota.com it adds 9.7 seconds of CPU activity.
Impact on page rendering times
CPU activity can cause a page to hang and become unresponsive, as well as increasing battery consumption. But if the processing happens after the initial page load the impact on user experience may not be that big.
Several extensions like Loom and Ghostery run a large amount of code without impacting when the page starts rendering.
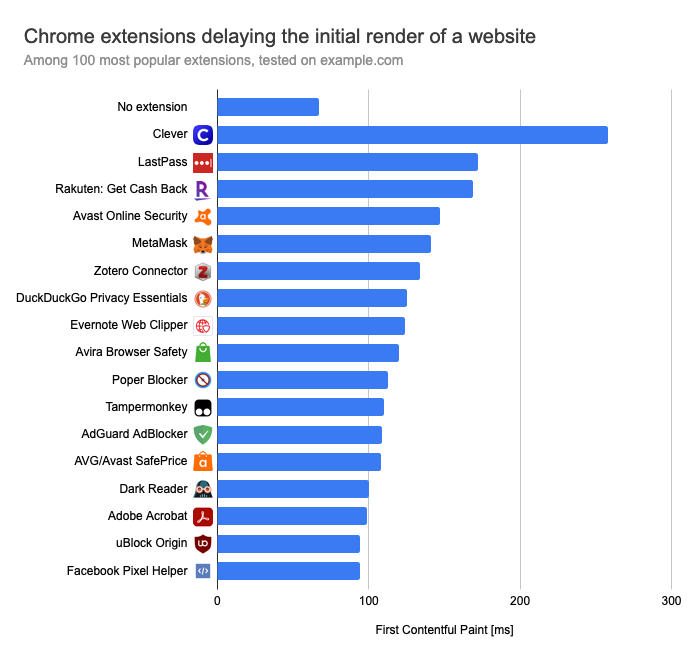
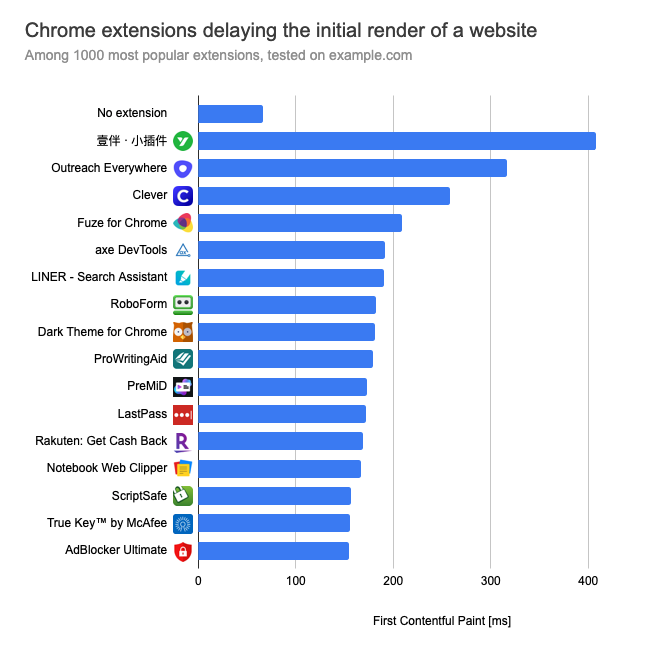
However, other extensions like Clever, Lastpass, and DuckDuckGo Privacy Essentials run code as soon as the page starts loading, delaying the point at which the user is first able to view page content. The chart uses the First Contentful Paint metric to measure this.
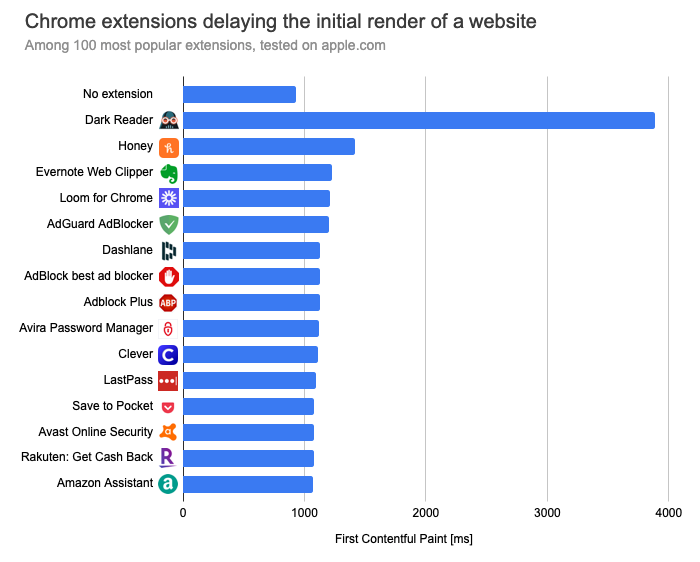
While the Apple homepage normally renders in under a second, with Dark Reader installed it takes almost 4 seconds.
On an ecommerce website, Honey also delays the appearance of page content by almost half a second.
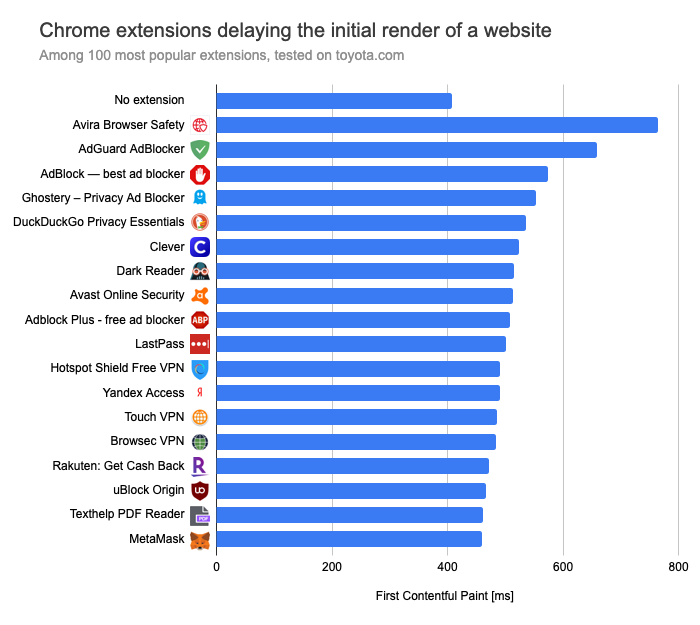
Avira Browser Safety and some ad blockers can also delay when page content starts to appear.
Top 1000 extensions
Looking at the 1000 most popular extensions shows that a social media tool called 壹伴 · 小插件 delays rendering times by 342 milliseconds and a sales tool called Outreach Everywhere adds a 251 millisecond delay.
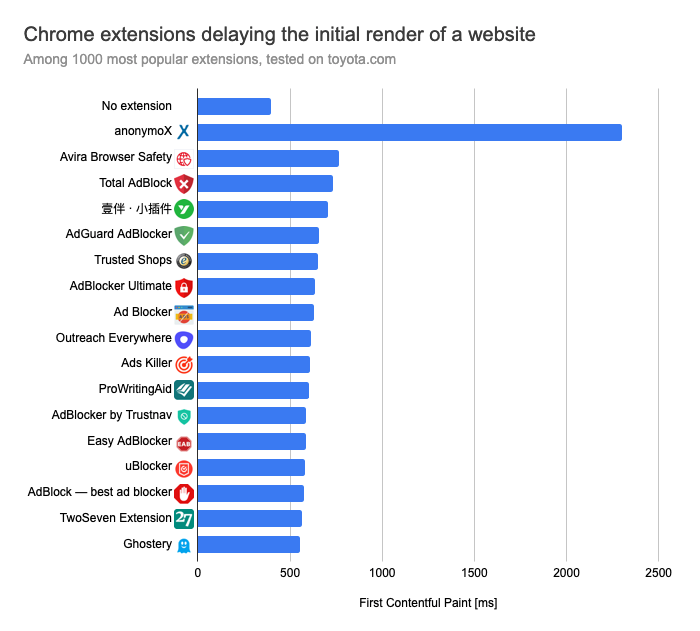
When loading the Toyota homepage an anonymous browsing proxy called anonymoX delays rendering by over 2 seconds – however this isn't surprising as traffic is routed through another server.
Avira Browser Safety delays rendering by 369 milliseconds. This is not caused by code running on the visited page but by the background work performed by the extension, as we'll see in the next section.
Background CPU usage
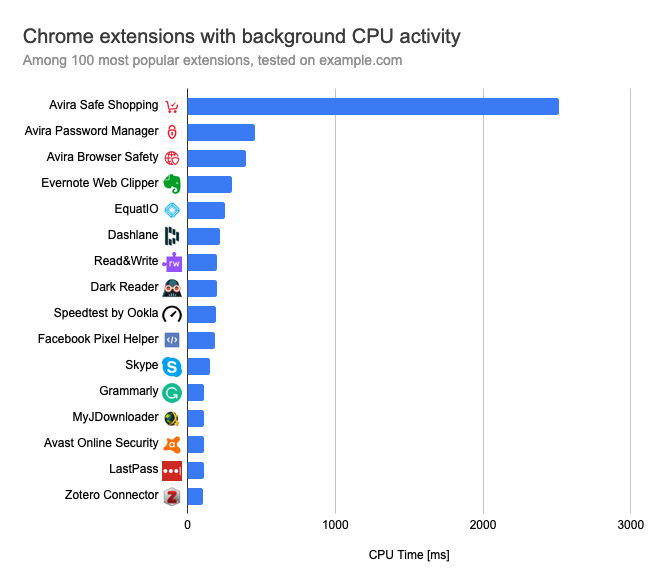
Chrome extensions can run code not only on the pages you visit but also on a background page that belongs to the Chrome extension. For example, this code can contain logic that blocks requests to certain domains.
Even when visiting a simple page, Avira Safe Shopping keeps the CPU busy for over 2 seconds.
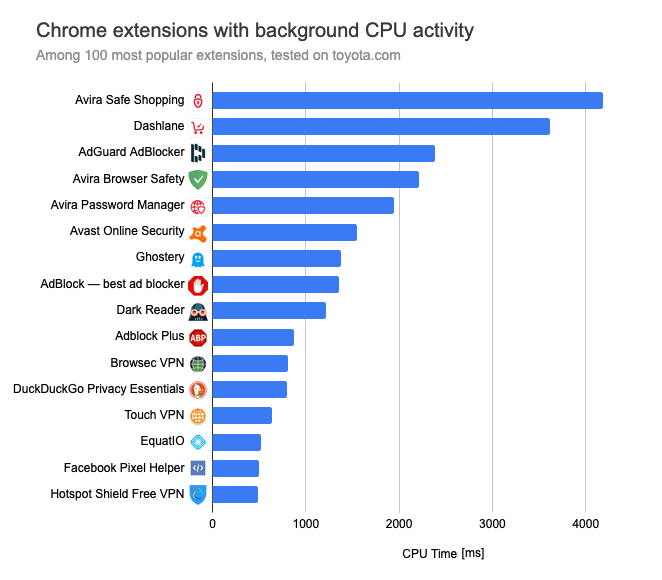
On a more complex page – in this case the Toyota homepage – the Dashlane password manager and AdGuard AdBlocker also spend over 2 seconds on background activities.
Top 1000 extensions
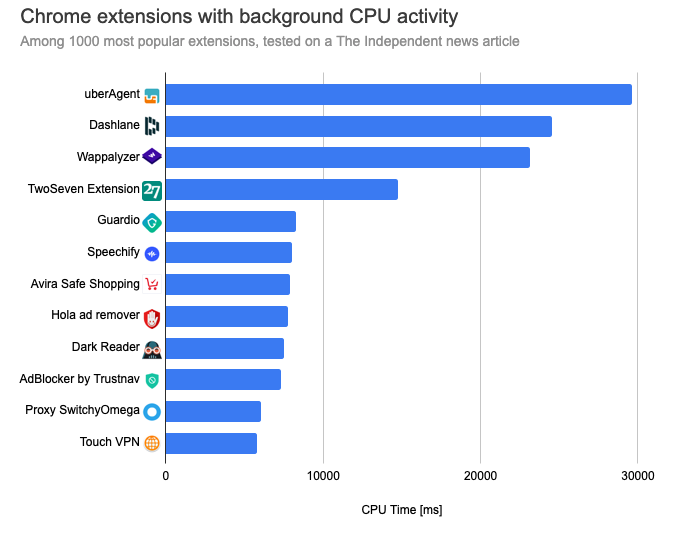
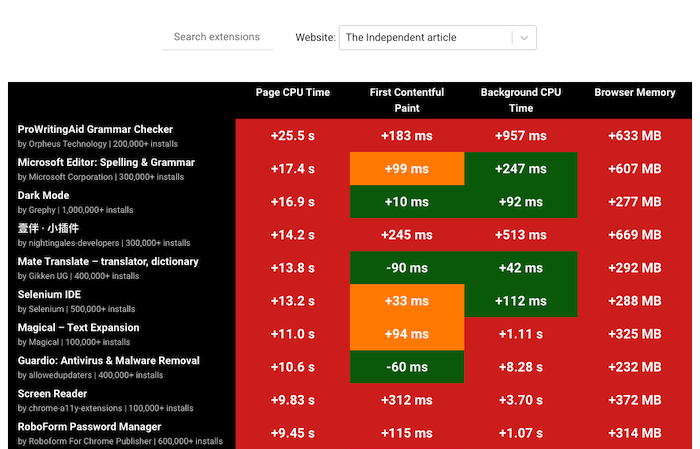
When viewing a news article from The Independent, three extensions cause more than 20 seconds of CPU activity: uberAgent, Dashlane, and Wappalyzer.
Browser memory consumption
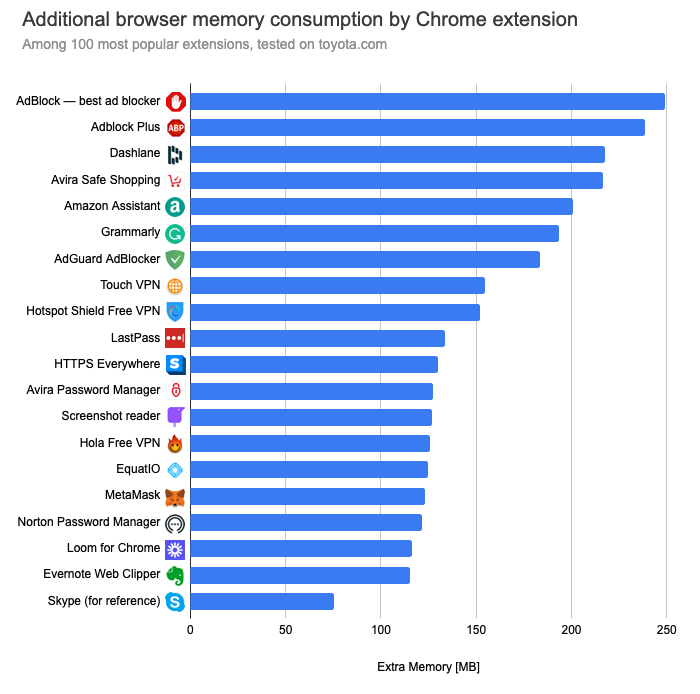
Chrome extensions can increase the memory usage of every page being visited, as well as memory being spent on the extension itself. This can hurt performance, especially on low-spec devices.
Ad blockers and privacy tools often store information about a large number of websites, requiring a large amount of memory to store this data. That being said, they can also reduce overall memory consumption when many ad-heavy pages are open in the browser.
Top 1000 extensions
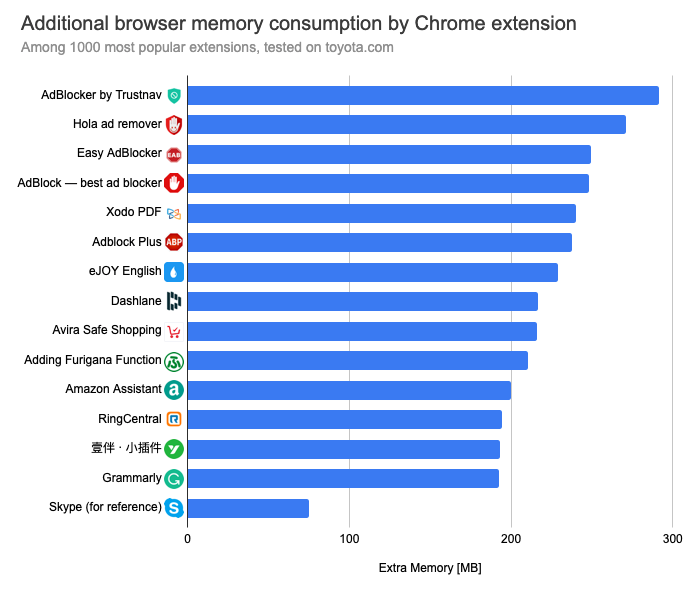
When looking at the Top 1000 extensions, ad blockers continue to take up a significant amount of memory, with the Trustnav ad blocker adding almost 300 MB of memory consumption.
How do ad blockers and privacy tools affect browser performance?
While ad blockers can cause additional processing on ad-free websites, they can significantly speed up ad-heavy pages. This section looks at 15 ad blockers that have more than 500,000 installations each.
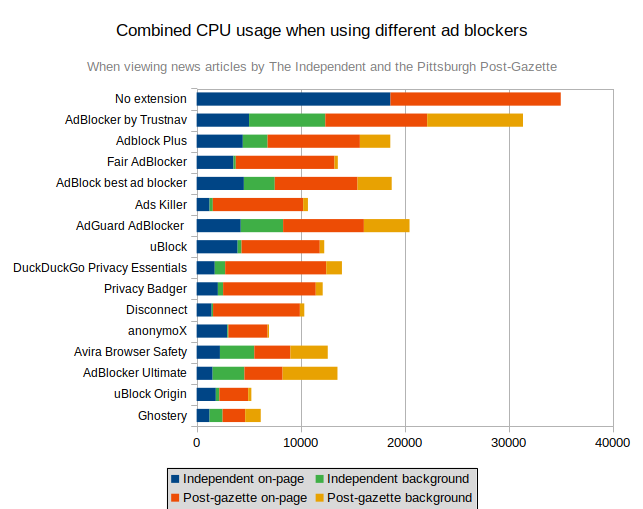
Loading trackers and rendering ads is often CPU-intensive, although the exact impact varies by website. News websites are often particularly ad-heavy, so this report will look at the CPU usage of two news articles: one from The Independent and the other from the Pittsburgh Post-Gazette.
Without ad-blockers per-page CPU time is 17.5 seconds. Even the lowest-performing blocker (by Trustnav) reduces this by 57% to 7.4 seconds.
Ghostery, the best-performing ad blocker in this test, reduces CPU activity by 90% down to just 1.7 seconds on average.
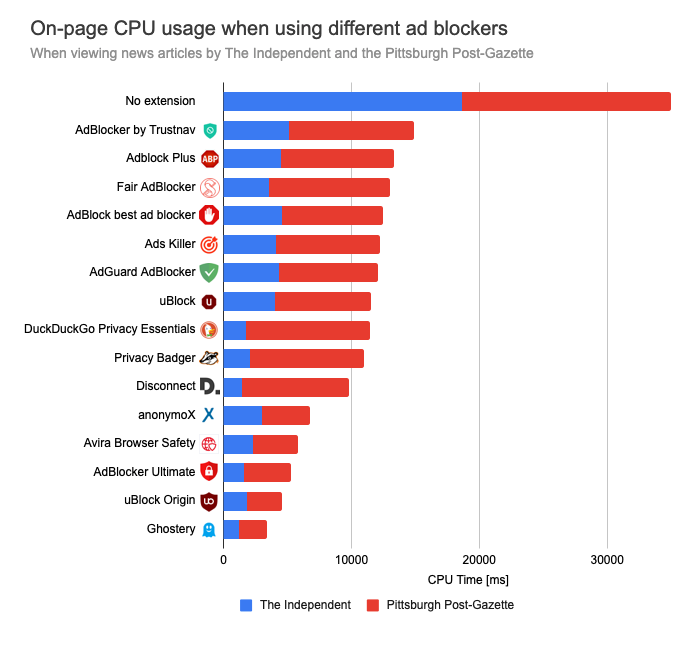
Raymond Hill, author of uBlock Origin, points out on Twitter that while all extensions reduce on-page CPU activity some also introduce a significant amount of CPU activity in the extension's background page, cancelling out some of the savings.
Work that's done in the background is less likely to impact the performance of the web page itself, but it does still slow down your computer overall.
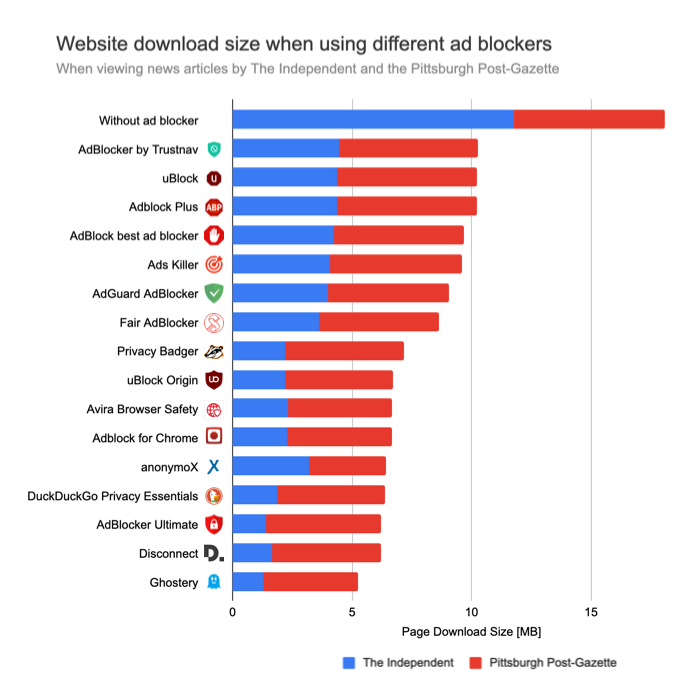
Ad blockers and privacy tools also reduce data volume by 43% to 66%.
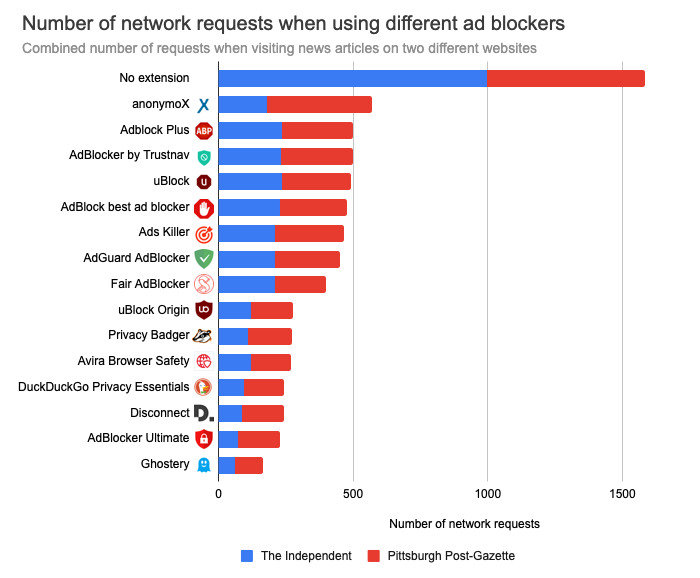
Without an ad blocker, each article makes on 793 network requests on average. With Ghostery this goes down 90% to just 83.
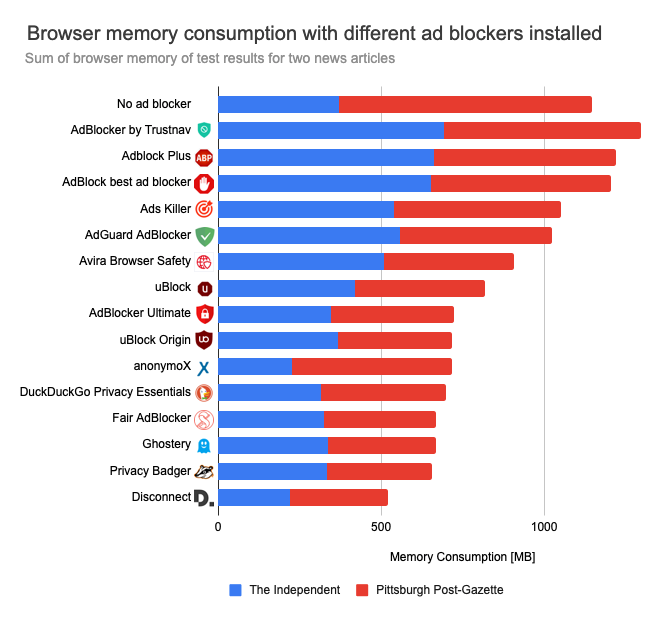
Without ad-blockers installed, the average total browser memory consumption with one of the news articles open is 574 MB. Disconnect reduces this by 54% to just 260 MB.
However, as browser extensions always take some memory to run, other ad blockers like the one by Trustnav slightly increase memory consumption. In this case the savings from blocking ads don't outweigh the additional cost of the ad blocker.
However, keep in mind that this only applies if you have a single ad-heavy page open. If you have 10 tabs open, all showing news articles, then you'll see 10x the memory savings but generally no equivalent increase in the memory consumption of the ad blocker.
What happens if I have more than one extension installed?
In the majority of cases the effect of multiple Chrome extensions will be cumulative.
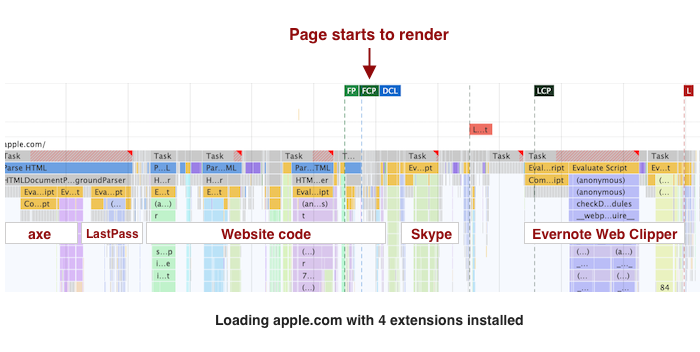
This screenshot shows a Chrome DevTools page performance profile for apple.com when four extensions are installed: axe Web Accessibility Testing, Evernote Web Clipper, LastPass, and Skype.
You can see that CPU tasks run one after the other. If an extension is configured to run as soon as the page starts loading, this delays the initial render of the page.
How do these browser performance results compare to last year's?
I looked at 96 of the most popular extensions that were included both in this year's tests and in last year's.
Taking the average across all the changes shows that on-page CPU time went down by 28 milliseconds.
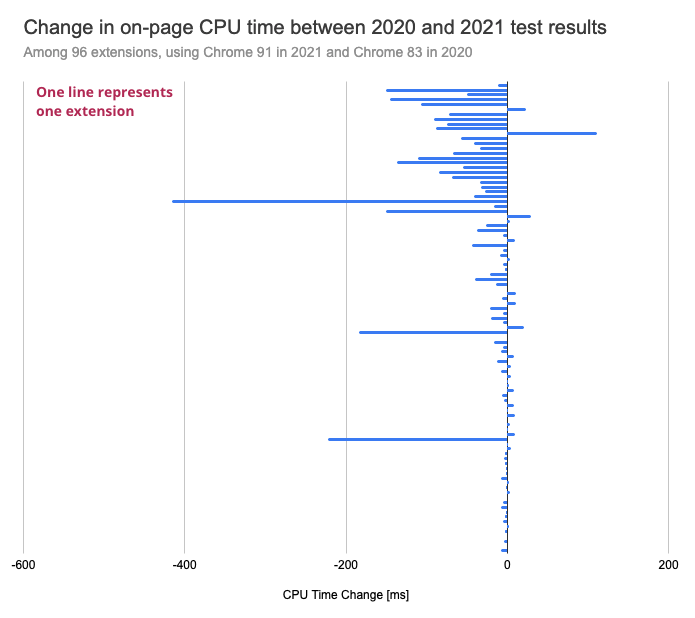
However, the tests in 2021 were run using Chrome 91 and the 2020 tests used Chrome 83. As Chrome gets faster over time these improvements might not necessarily mean that the Chrome extensions themselves have been optimized.
When running this year's tests with the old version of Chrome the average improvement is only 13 milliseconds.
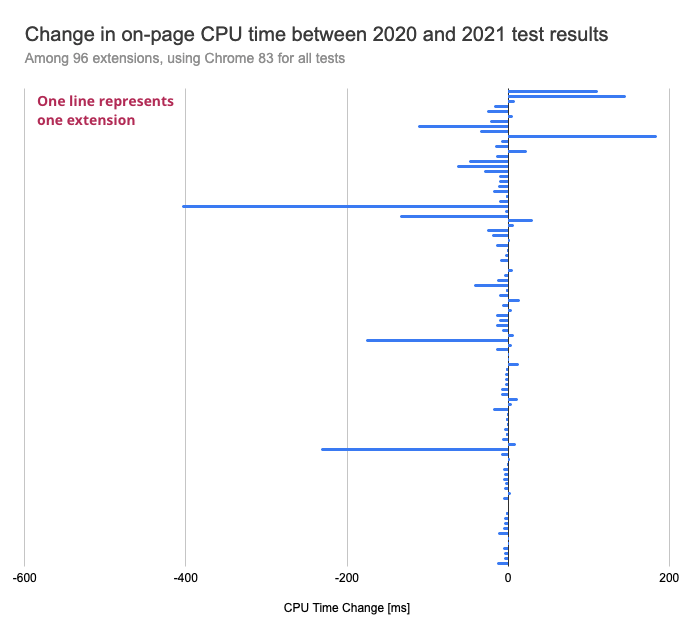
Note that this comparison only looks at one metric on one website (the simple test page).
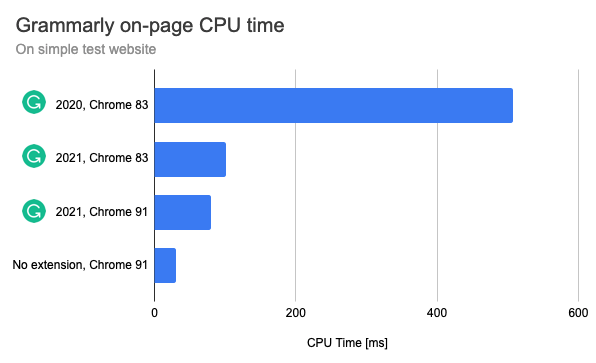
Grammarly, Microsoft Office, Okta Browser Plugin, Avira Safe Shopping, and Avira Browser Safety all showed reductions in on-page CPU time of over 100 milliseconds. The biggest regressions were seen in Save to Pocket, Loom, and Evernote.
A look at individual extensions
Improvement in Grammarly
Last year, Grammarly was loading a 1.3 MB Grammarly.js file on every page. Now on most websites only a 112 KB Grammarly-check.js script is loaded. Only if, for example, the user focuses on a text area does the extension load the full Grammarly.js file.
However, some websites still always load the full-size script. This list includes Gmail, Twitter, YouTube, LinkedIn, Medium, Slack, Reddit, Upwork, Zendesk and other websites where text entry is common. On these websites the performance impact will be greater than that shown in these tests.
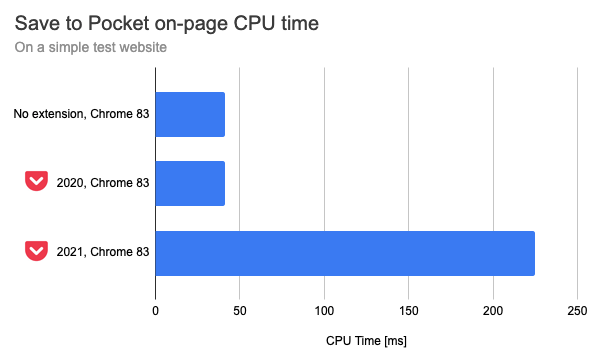
Regression in Save to Pocket
In last year's tests, Save to Pocket injected one small stylesheet into every page, but this had no noticeable impact on performance.
However, Save to Pocket now always loads a 2 MB JavaScript file, adding 110 milliseconds of CPU time.
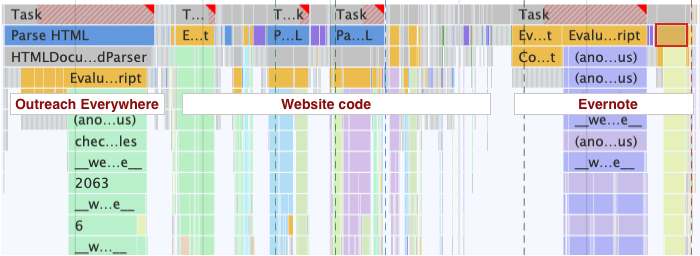
Evernote, Outreach Everywhere, and Ubersuggest
Evernote loads 4.3 MB of content scripts on every page, up from 2.9 MB a year ago. Accordingly parsing, compiling, and running this code takes a good amount of time.
Outreach Everywhere loads 4.5 MB of code on every page. However, the performance impact of this code is far greater as it's loaded on document_start rather than on document_idle. That means the code runs before the visited page starts to render, thus delaying when page content shows up.
This image shows a Chrome DevTools performance profile where both extensions are installed.
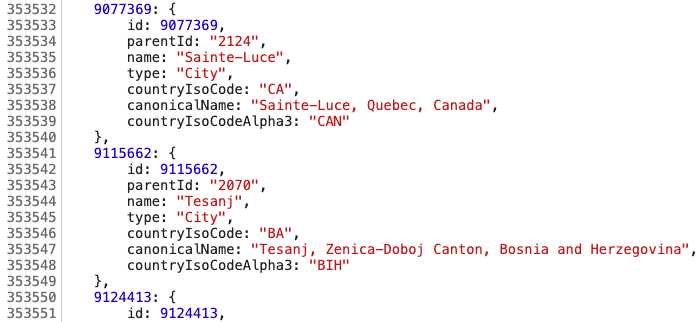
Ubersuggest loads a 7.5 MB JavaScript file on every page. A lot of this appears to be geo data – for example, this list of 38,279 different locations.
Avira Safe Shopping
Avira Safe Shopping has over 3 million users. Why does it sometimes delay page rendering by almost half a second?
The extension contains a safelist of 39,328 websites. When navigating to a new website Avira iterates over this list, causing the website to load much more slowly.

Dashlane and uberAgent
Dashlane and uberAgent both had more than 20 seconds of background CPU activity when viewing an article by The Independent.
For every network request, uberAgent sets up a timer that fires every 50 milliseconds to check if the page has finished loading. For a page that makes almost 1000 requests this means many timers are created and the computer is slowed down significantly.
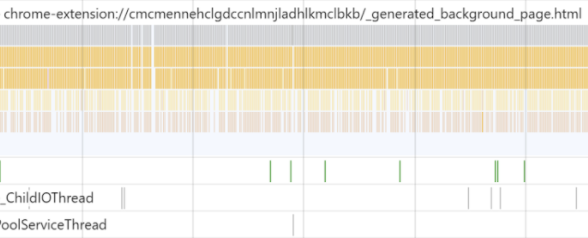
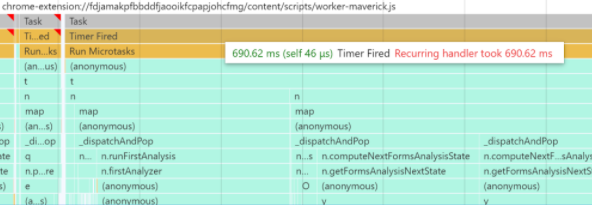
While uberAgent runs many small tasks, Dashlane runs occasional long tasks taking over 500 milliseconds.
Look up the performance impact of a specific extension
Wondering if an extension you're using affects performance? Look it up here.
Methodology
Tests were run on an n2-standard-2 Google Cloud instance; the numbers in this report show the median of 7 test runs.
Data was collected using Lighthouse, and the results in this test show unthrottled observed metrics rather than simulation results.
A total of 1004 extensions were included in the test. A large percentage of extensions only modify the New Tab screen; these generally don't hurt performance and so most aren't included in the results. Some extensions where test results had errors are also not included.
What impact do Chrome extensions have on browser performance? I tested 1000 popular extensions to find out.
— DebugBear (@DebugBear) July 6, 2021
A thread looking at the main findings below👇https://t.co/oLwdFMlrYY
