Measure And Optimize First Contentful Paint (FCP)
The First Contentful Paint (FCP) page speed metric measures how long it takes for content to start appearing on a website.
This article explains how the First Contentful Paint is defined, and how to measure and optimize it. We'll also look at how it relates to other page load speed metrics.
What is the First Contentful Paint?
The First Contentful Paint metric measures how quickly after opening a website the user can see some content on the page. Usually this means that text or an image is visible.
FCP is called a rendering milestone timing, because it measures a visual aspect of the page load process. When this rendering milestone is reached the visitor can tell that something is happening and that the page has started to load.
What is the First Paint?
The First Paint marks the time when the page first starts displaying something, even if that's not content. For example, a box with a background color might start to show, but the browser might still be loading the necessary web fonts to display the text content for that box.
The First Paint and the First Contentful Paint often happen at the same time.
First Contentful Paint vs. Largest Contentful Paint
The Largest Contentful Paint (LCP) marks the time when the largest content element on a page is rendered. That often means most of the page content is now visible to the user.
The FCP and LCP can happen at the same time, especially if the LCP resource type is text. If the LCP element is an image then loading the image often takes additional time after the page content has started to render.
FCP in the page load process
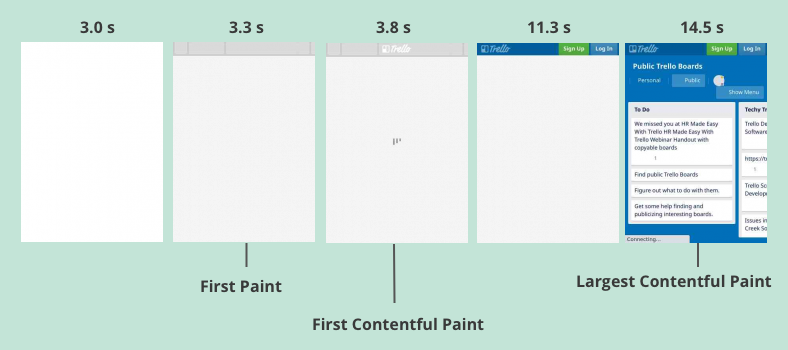
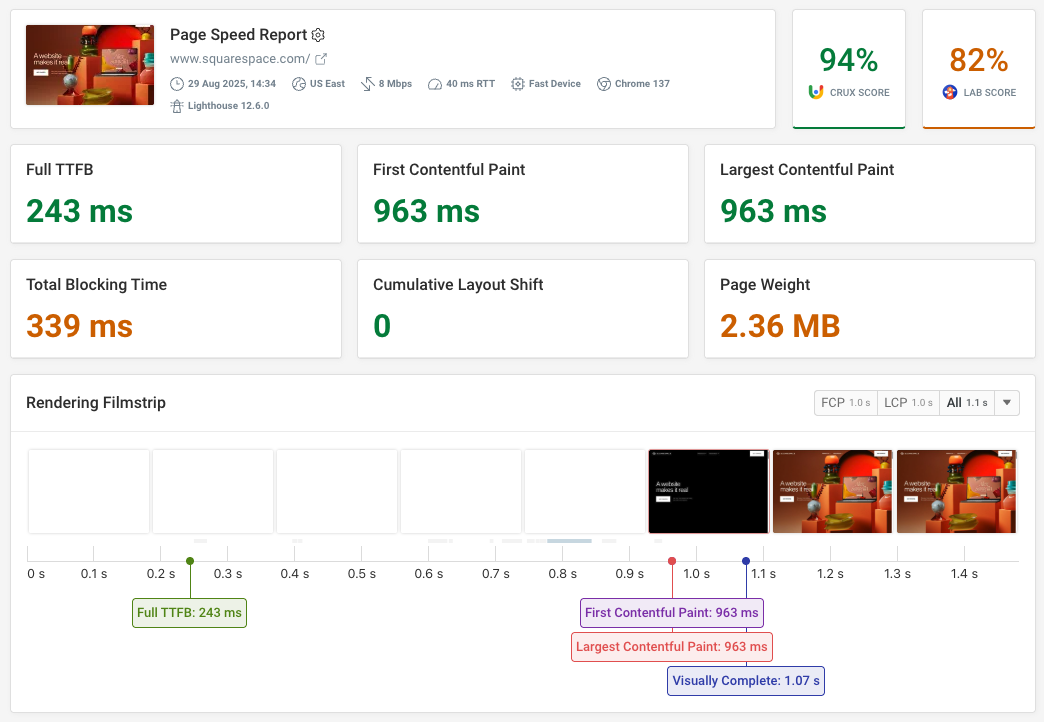
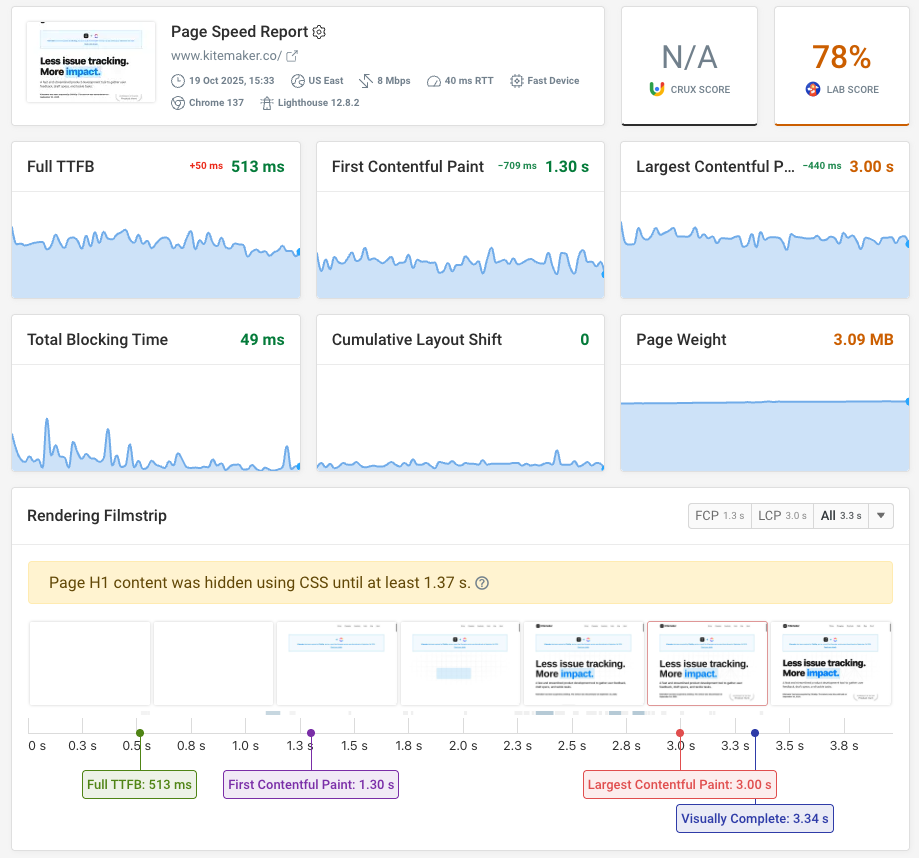
This diagram below shows the rendering progress of an example website:
- TTFB: The server has responded with the HTML document
- FCP: Some page content becomes visible
- LCP: The main image is displayed
- Visually Complete: The page is fully loaded and there are no more visual updates
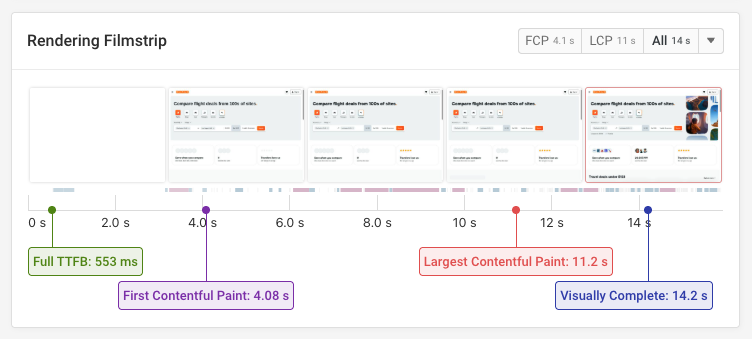
Use our free website speed test to get a rendering filmstrip and performance analysis for your own website.
Three other page load milestones are also highlighted:
- Time to First Byte: the initial server response, before content is ready to render
- Time to Interactive: when the CPU and network are idle
- Visually Complete: when the UI stops updating
FCP explained: a video
We've recorded a video explaining the First Contentful Paint metric and what you can do to improve it. We look at several concrete examples of what holds back page rendering and what can be done about it.
Run a website speed test
Using a free website speed testing tool can tell you not just how fast your website is but also improve your understanding of why content shows up when it does.
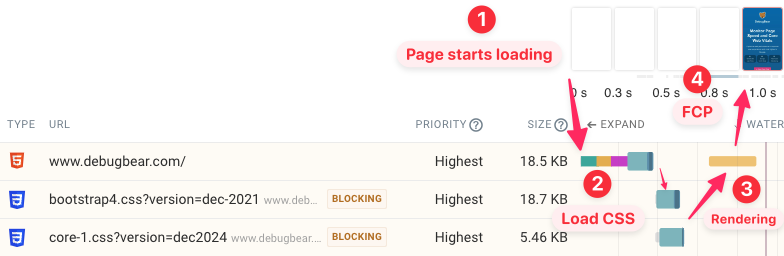
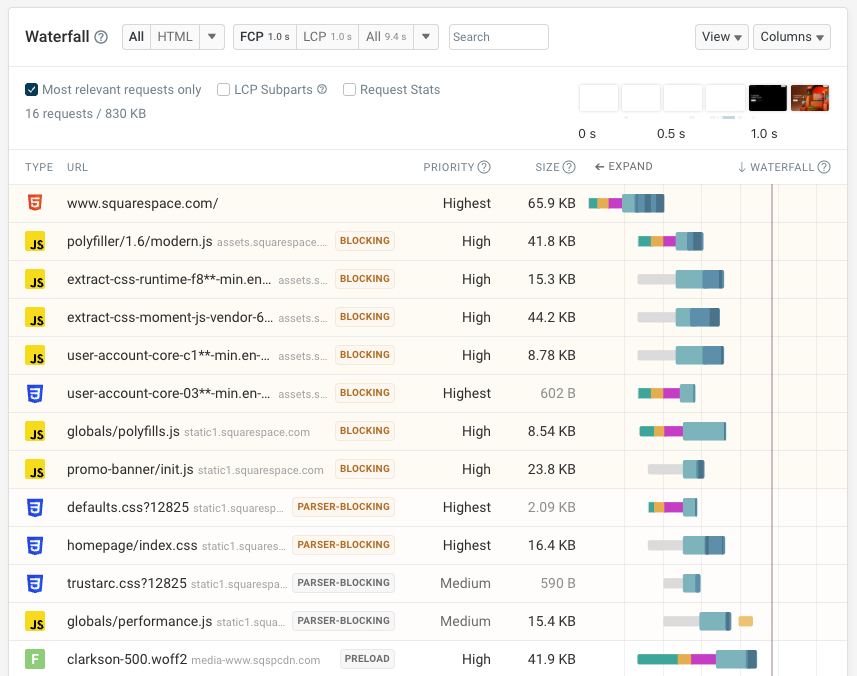
For example, in this request waterfall you can see that content appears after these steps:
- Loading the HTML document
- Loading a render-blocking stylesheet
- CPU processing by the browser to render the page
What is a good First Contentful Paint score?
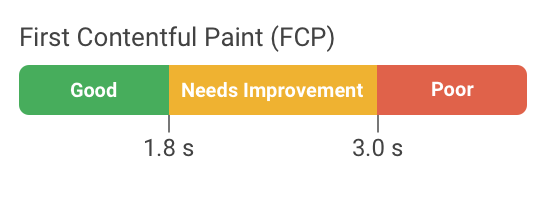
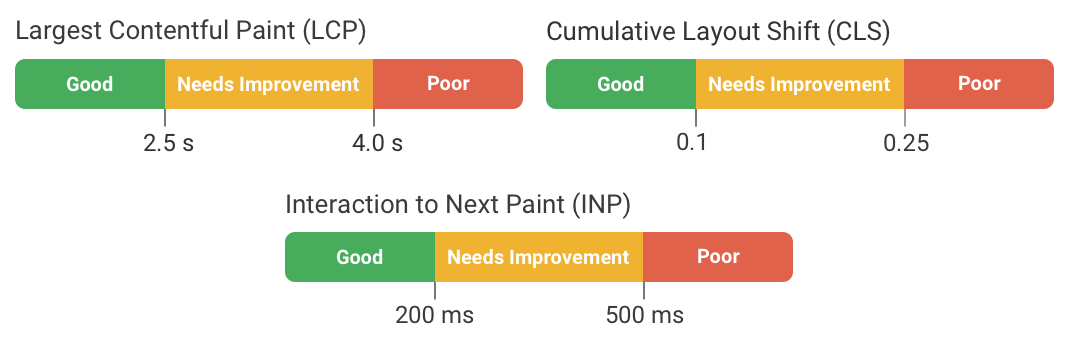
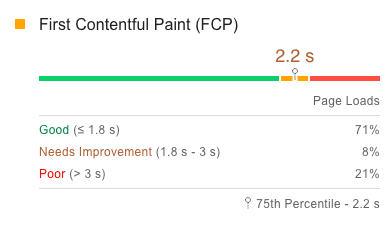
Websites should have an FCP of 1.8 seconds or less. If visitors on your website wait more than 3 seconds for any content then this is considered poor.
Google uses the following rating thresholds for the First Contentful Paint score:
Learn more about typical website load times.
Is First Contentful Paint a Core Web Vitals metric?
First Contentful Paint is a web vital, but it is not one of the Core Web Vitals that impact Google rankings. However, FCP does represent a lower bound for the Largest Contentful Paint score, which is a Core Web Vital.
The three Core Web Vitals metrics are:
- Largest Contentful Paint (LCP)
- Cumulative Layout Shift (CLS)
- Interaction to Next Paint (INP)
You may sometimes find that improving FCP results in more layout shift, as content that appears early may move around on the page as the page continues loading.
Sometimes INP can also increase, as having content visible on the page suggests to the visitor that they can start interacting with the page, even though some additional page initialization work may still be in progress.
How does First Contentful Paint affect the Lighthouse performance score?
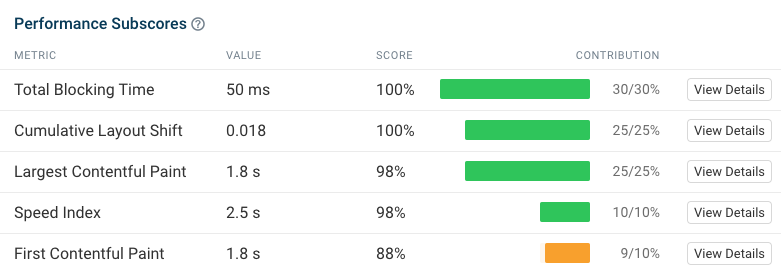
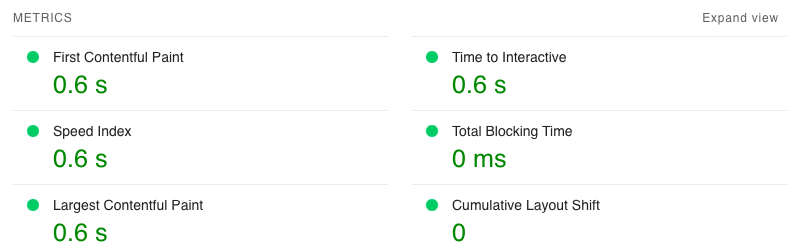
The First Contentful Paint metric accounts for 10% of the overall Performance score. It also impacts the Speed Index and Largest Contentful Paint metrics that also contribute to the overall score.
You can see the performance subscore for the FCP metric is visible in the DebugBear Lighthouse monitoring dashboard.
The initial document request requires at least 4 network round trips on an HTTPS connection (DNS, TCP, SSL, and HTTP). Lighthouse simulates a round trip time of 150 milliseconds on mobile, so a perfect mobile Lighthouse FCP would be 600 milliseconds.
This does not include your server response time or time the data spends traveling from your ISP to the website's data center.
On desktop Lighthouse uses a roundtrip time of 40ms, so the minimum FCP would be 160ms.
Does the First Contentful Paint impact SEO?
FCP is not by itself a Google ranking factor. However, the Largest Contentful Paint (LCP) metric is one of the Core Web Vitals that do impact Google rankings, and LCP can never be better than FCP.
Therefore, looking at the First Contentful Paint metric and optimizing often also means that the LCP will improve.
How to improve First Contentful Paint
These are some concrete steps you can do to improve your website's FCP score:
- Improve Time to First Byte
- Optimize render-blocking stylesheets
- Reduce render-blocking scripts
- Ensure web fonts don't delay text
- Check page content isn't hidden with CSS
Improve Time to First Byte
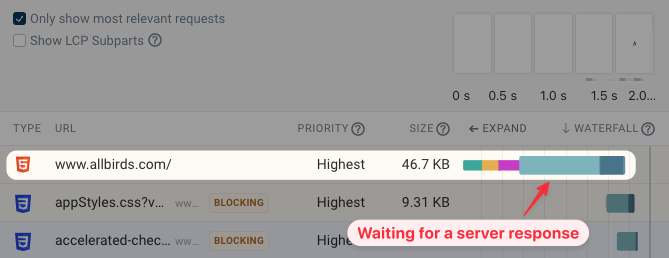
Loading the HTML document is the first step to displaying page content and discovering what other resources are required to start the rendering process. The Time to First Byte measures how quickly the first byte of the HTML is available to the browser.
The waterfall chart below shows an example of slow server response time. The browser connects to the server, which takes up three round-trips on the network. Depending on the network latency, each round trip requires a certain amount of time. After that the actual HTTP request is sent and the server takes some time to process it. Finally the HTML response is downloaded, as indicated by the dark blue shaded section of the bar.
Here are some steps you can follow to reduce TTFB:
- Avoid redirect responses
- Reduce latency with a Content Delivery Network (CDN)
- Reduce server response time
The exact steps involved in reducing server response time will depend on what's actually delaying the response in the backend code. You may be able to make your code run faster, optimize database queries, or reduce third-party API requests.
Slow server responses are more likely if the backend is responsible for rendering the full page content. For example, if you have a WordPress site with lots of plugins this can cause significant rendering delays. On the flip side, rendering content on the server also reduces processing time in the browser and avoids unnecessary network round trips later on.
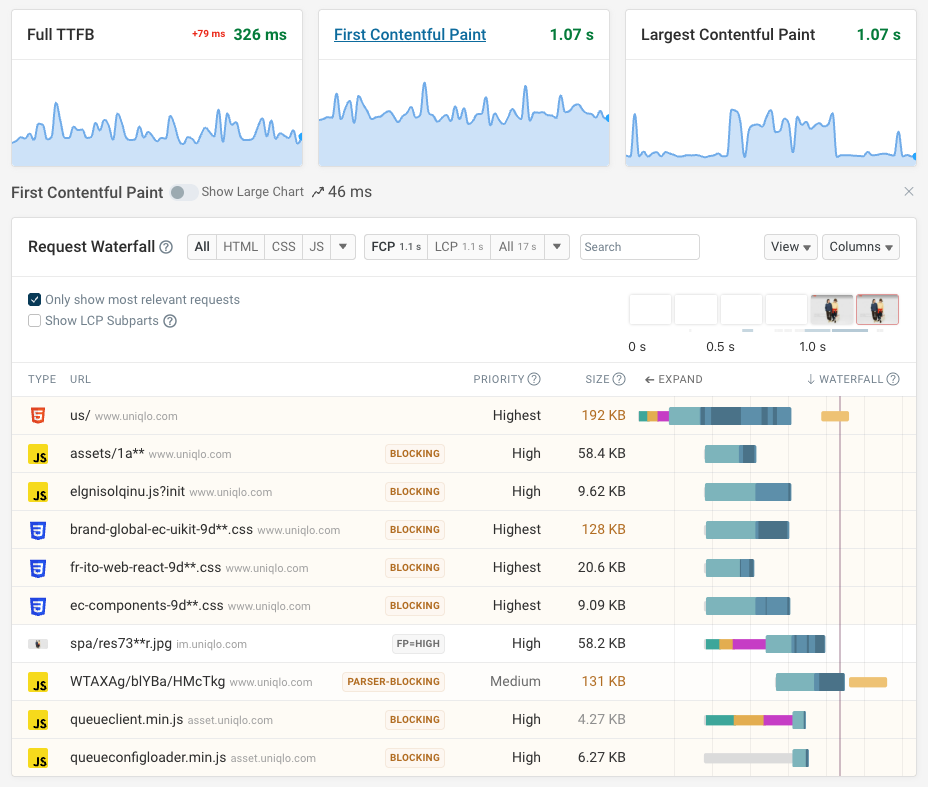
Optimize render-blocking stylesheets
Loading the HTML code usually isn't enough to start rendering page content. Most websites also rely on CSS stylesheets to tell the browser how to display the content. Because of that, stylesheets are usually render-blocking resources.
The screenshot below shows that in action. Several stylesheets need to be downloaded, and one of them is over 100 kilobytes large. Once loading CSS is complete, the browser can start rendering. And then the page content becomes visible.
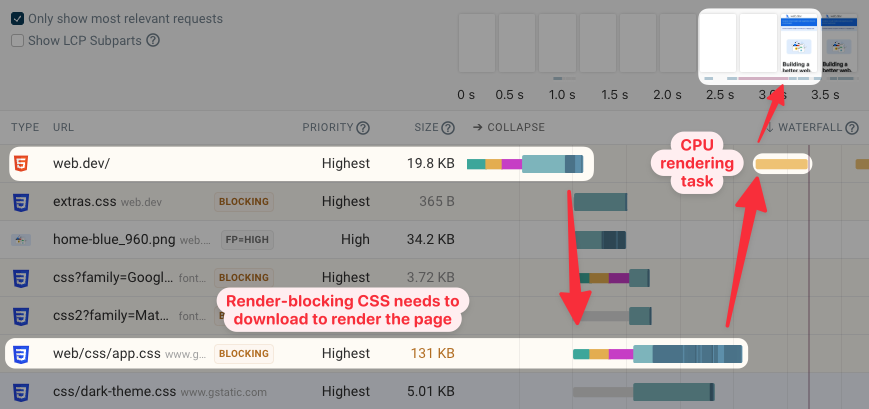
The HTML document and render-blocking files form a sequential request chain. This chain forms the core of the critical rendering path, which describes how the most important resources on a page load.
In some cases you can completely remove the CSS code or load it lazily. However, most of the time this will break the page layout.
Instead you can follow these tips:
- Load the stylesheet from the same domain as your HTML, to avoid needing to connect to a new server
- Reduce the CSS size, for example by using text compression and removing unused CSS
- Serve static resources from a local CDN cache
- Avoid using CSS
@import
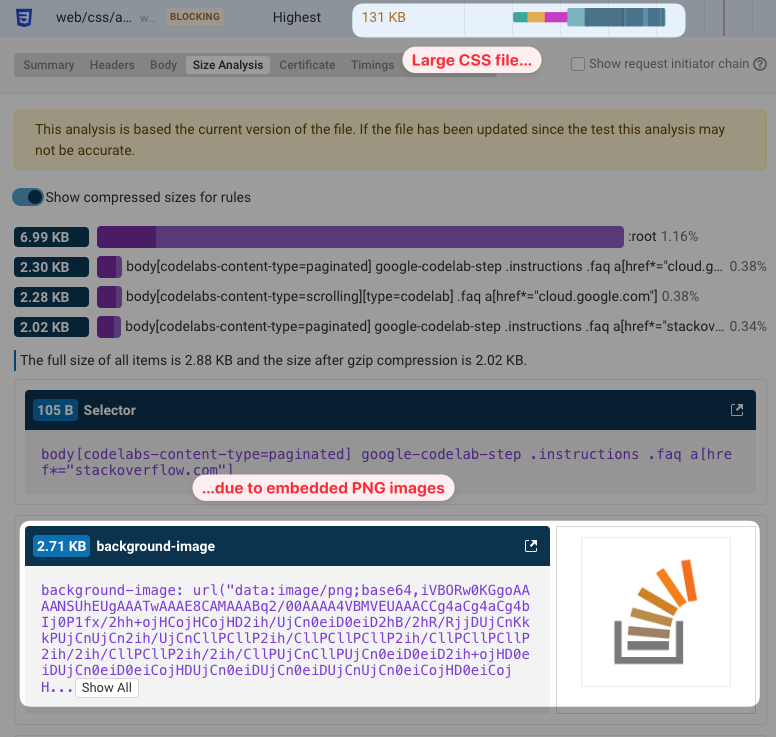
When running a test with DebugBear or using our CSS Size Analyzer, you can also inspect the CSS to see if fonts or images are embedded in it. For example, here we can see that most of the CSS file size comes from PNG images embedded in the CSS.
Embedding images in CSS makes them render-blocking, while images that are loaded using URL references or <img> tags can be loaded after the First Contentful Paint has taken place.
Reduce render-blocking scripts
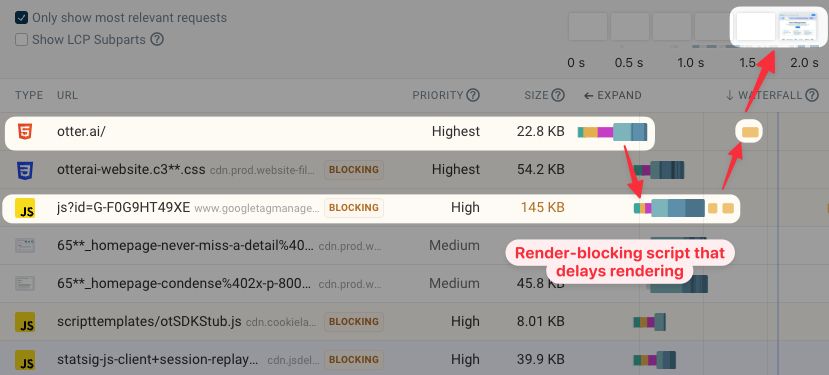
Script tags in the website HTML also block rendering by default. We can see an example here, where the JavaScript URL needs to load, triggers two short main thread tasks as it runs, before the page can finally render.
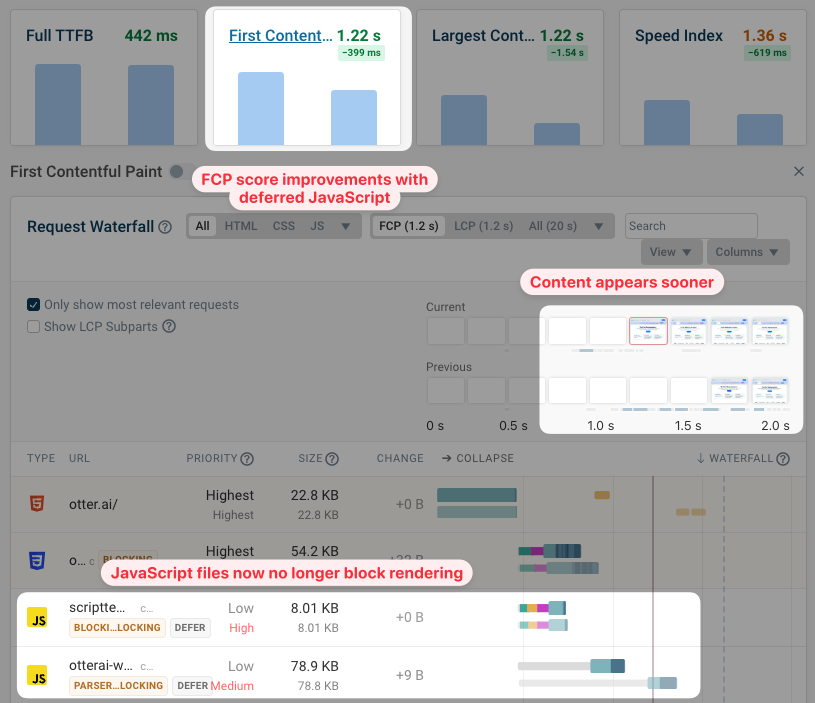
You can usually defer running JavaScript code, using the async or defer attributes. That makes JavaScript files not block rendering, and also reduces the priority of these requests so that more bandwidth is allocated to more important files that hold back the FCP.
We can run an experiment on DebugBear to measure how much the FCP score would improve if we were to defer JavaScript loading. In the result we see the FCP going down from 1.6 seconds to 1.2 seconds.
Ensure web fonts don't delay text
Web fonts are fonts that need to be downloaded before the text using that font is displayed. By default, web font text is invisible until the font file has loaded.
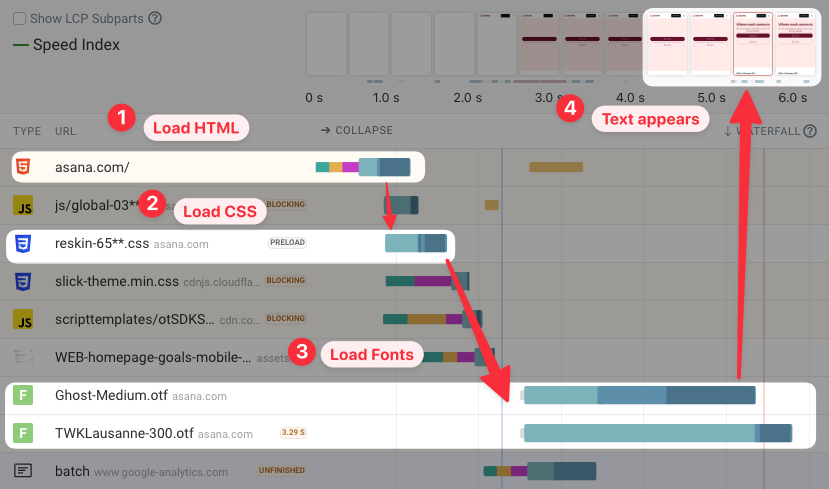
Here's an example of a website that first needs to load two web fonts before most of the text content on the page becomes visible.
You can use the font-display: swap CSS property to tell the browser to use a fallback font before the web font is loaded and keep text visible while the website is loading. On Google Fonts you can achieve this by appending &display=swap to the CSS file URL. To reduce how long the fallback font is displayed you can preload web fonts on your website.
Check page content isn't hidden with CSS
Finally, even when all render-blocking resources are loaded you'll sometimes find that content still doesn't appear. That's often because of A/B testing tools that hide the page content using CSS, in order to reduce flicker on the page when the test is applied.
DebugBear performance tests can automatically detect this:
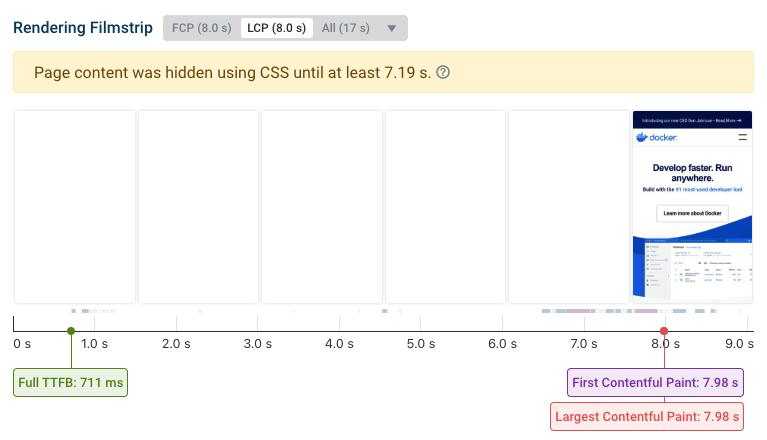
To fix this, one option is to accept the flicker and just display the content. Alternatively, you can look at the loading process for the A/B tests and optimize that.
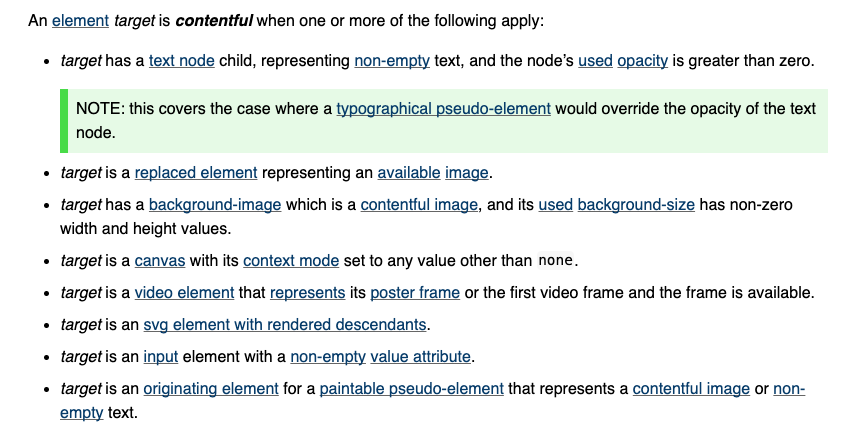
First Contentful Paint definition
The exact meaning of the FCP metric is defined in the Paint Timing API.
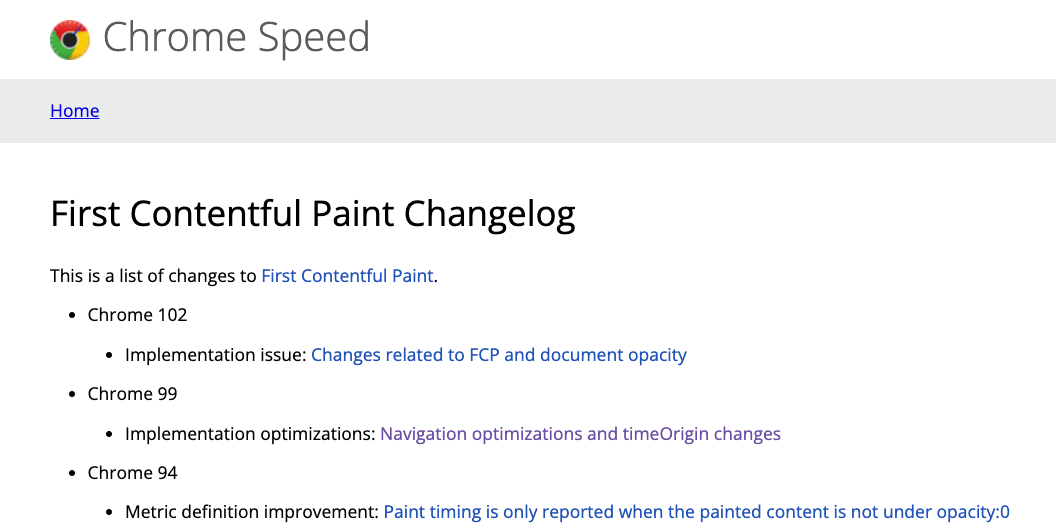
Different versions of Chrome also measure FCP slightly differently. Google also maintains a changelog of these changes. When users upgrade to a new version of Chrome you may see changes in your metric without an underlying change to your website.
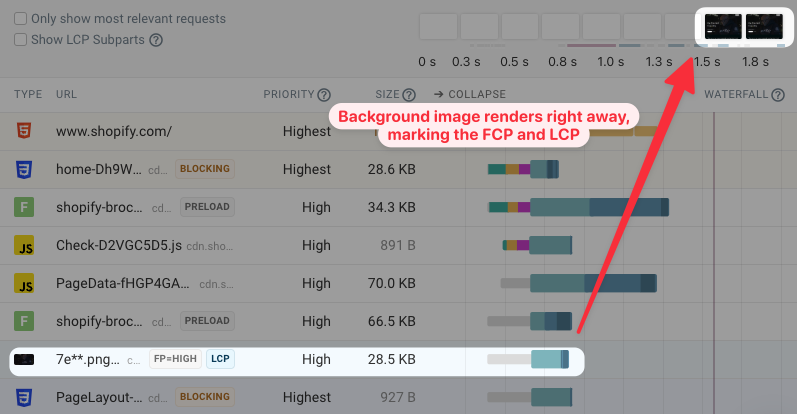
Do background images count as content for First Contentful Paint?
Yes, if a background image is rendered the paint will be considered contentful.
You can see an example of the First Contentful Paint including a background image in the waterfall and rendering filmstrip below. The image is preloaded, and as a result it loads before the render-blocking resources on the page.
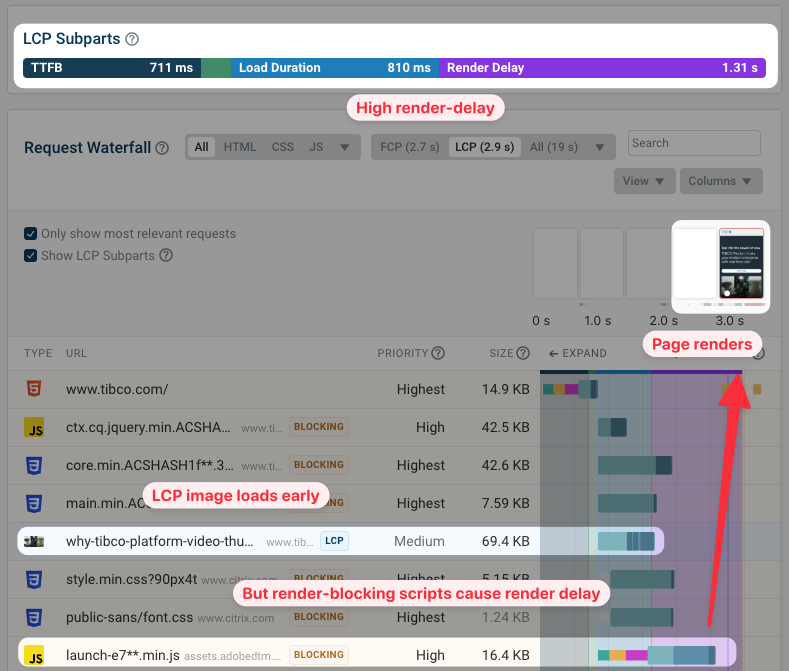
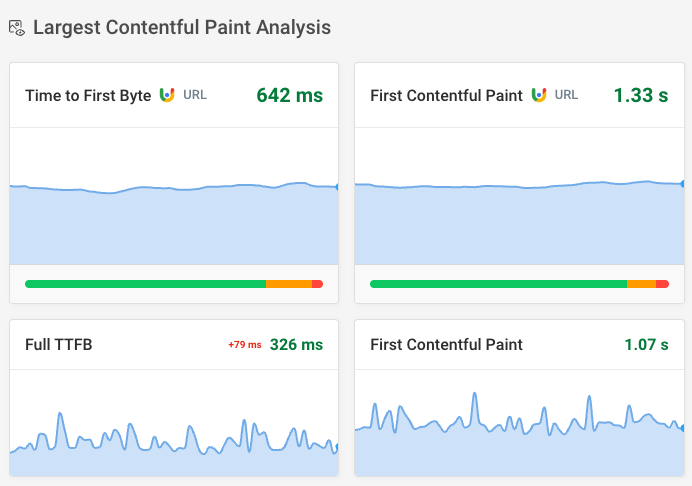
How does FCP relate to element render delay?
Element render delay is one of the four LCP subparts that can help you diagnose performance issues on your website.
For text elements, TTFB and render delay together often match the First Contentful Paint timing. For images, ideally the page should already have been rendered when the image finishes loading, at which point the image can be displayed right away without further rendering delay.
However, that's not always the case, as can be seen in the example below. The LCP image loads before the FCP, and as a result the render-blocking script causes further render delay before the image can be displayed.
This can also happen if rendering is delayed not by render-blocking request but by client-side rendering for websites that rely on JavaScript execution to display content.
How to measure First Contentful Paint
There are many different tools that can measure FCP. The data is collected in different environments, so the reported metrics can differ between tools.
To measure FCP you can use:
- Google's PageSpeed Insights tool
- The DebugBear Speed Test
- Lighthouse in Chrome DevTools
- The
Performanceweb API
First Contentful Paint in PageSpeed Insights
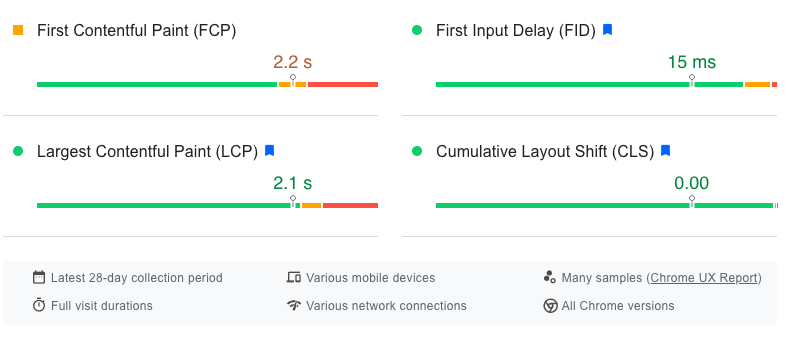
Google PageSpeed Insights can provide both aggregate data from real Chrome users and run one-off lab-based tests. The real user data is taken from the Chrome User Experience Report (CrUX).
The number shown in the FCP section of the real-user data shows that 25% of users experienced an FCP worse than this value. In this example, this means 25% of user experiences had an FCP of 2.2 seconds or worse, while 75% of user experiences were faster than 2.2 seconds.
If you click on Expand view you can see a more detailed breakdown of Good, Ok, and Poor experiences.
When testing a page, PageSpeed Insights also runs a one-off test from a Google server. This allows them to provide additional debug information that's not available for the real-user metrics.
The lab-based data is also useful if the page you're testing doesn't receive enough traffic to provide real user metrics.
Testing website speed and FCP with DebugBear
The free DebugBear site speed test analyzes your website and helps you understand First Contentful Paint and other performance metrics.
You can also visually see how content gradually appears on your page.
You can click on the FCP metric to view details about why the page renders at that point. The request waterfall shows what resources need to be loaded before the page can render.
The FCP milestone is indicated by the blue line. The page can only render after the render-blocking resources have been loaded.
First Contentful Paint in Lighthouse
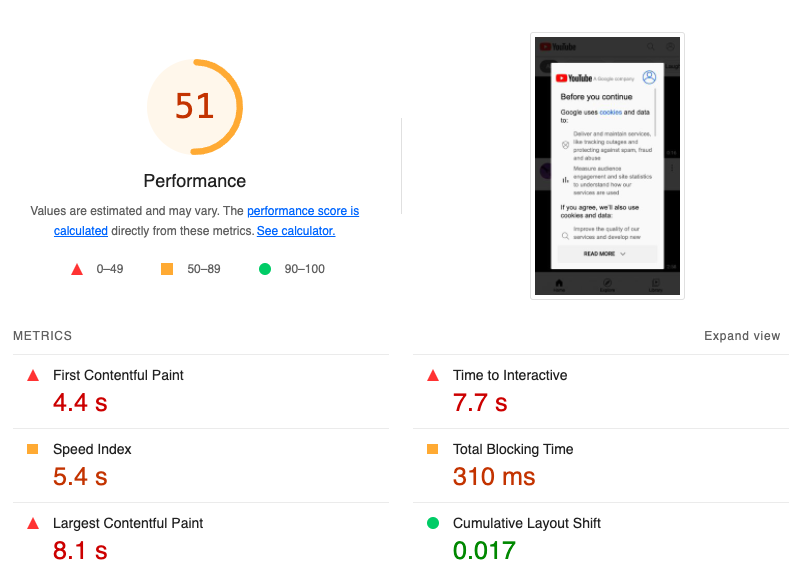
After running a test with Google's Lighthouse tool you can find the FCP in the top left of the Lighthouse Performance section.
Lighthouse also powers Google's PageSpeed Insights tool, so you can also see the Lighthouse metrics there.
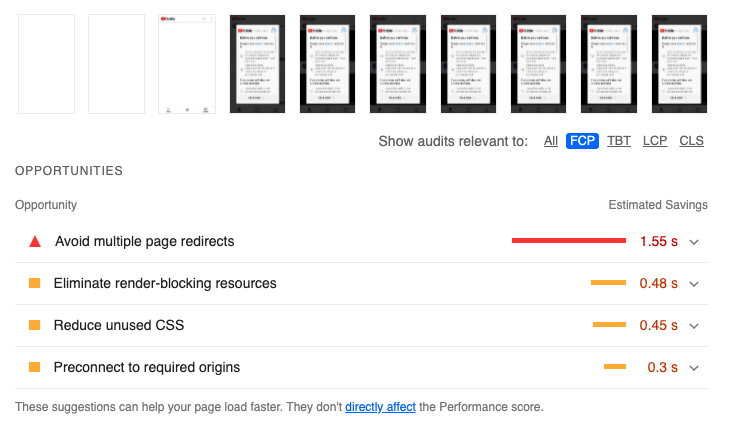
To find opportunities to improve First Contentful Paint you can select FCP in the Show audits relevant to options.
For example, you can avoid redirects to load the HTML document more quickly, or reduce unused CSS to speed up stylesheet loading.
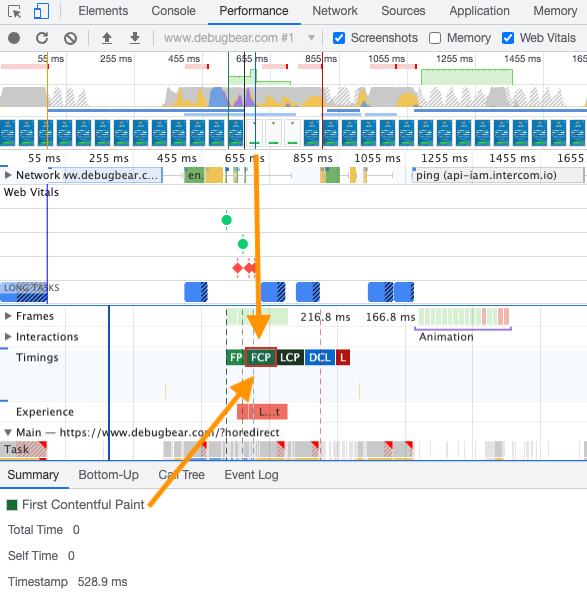
First Contentful Paint in Chrome DevTools
You can measure FCP in DevTools by creating a Performance recording.
FCP is marked in both the Timings lane and in the Web Vitals lane if you have it enabled. You can also see the rendering progress in the filmstrip.
Measuring First Contentful Paint programmatically
You can measure First Contentful Paint for the current page in JavaScript using the Paint Timing API:
performance.getEntriesByName("first-contentful-paint")[0].startTime;
// 581.8749999743886
You can also use Google's web-vitals JavaScript library to collect real user data for FCP and other web vitals metrics.
Monitoring First Contentful Paint
DebugBear makes it easy to monitor and optimize FCP as well as other page speed metrics.
You can find the First Contentful Paint metric in the page Overview tab of your synthetic test results.
The Web Vitals tab shows both the DebugBear lab data and Google's real world web vitals data that's used as a ranking signal.
This tells you how actual visitors experience your website. You can also see if slow server responses delay how quickly the rest of the page can start loading.
Click on the First Contentful Paint chart title to view the FCP debug view, which highlights render-blocking resources that are holding back rendering in a request waterfall.
This visualization shows you when different resources load and how that impacts rendering. You can also see what contributes to the duration of each resource request.
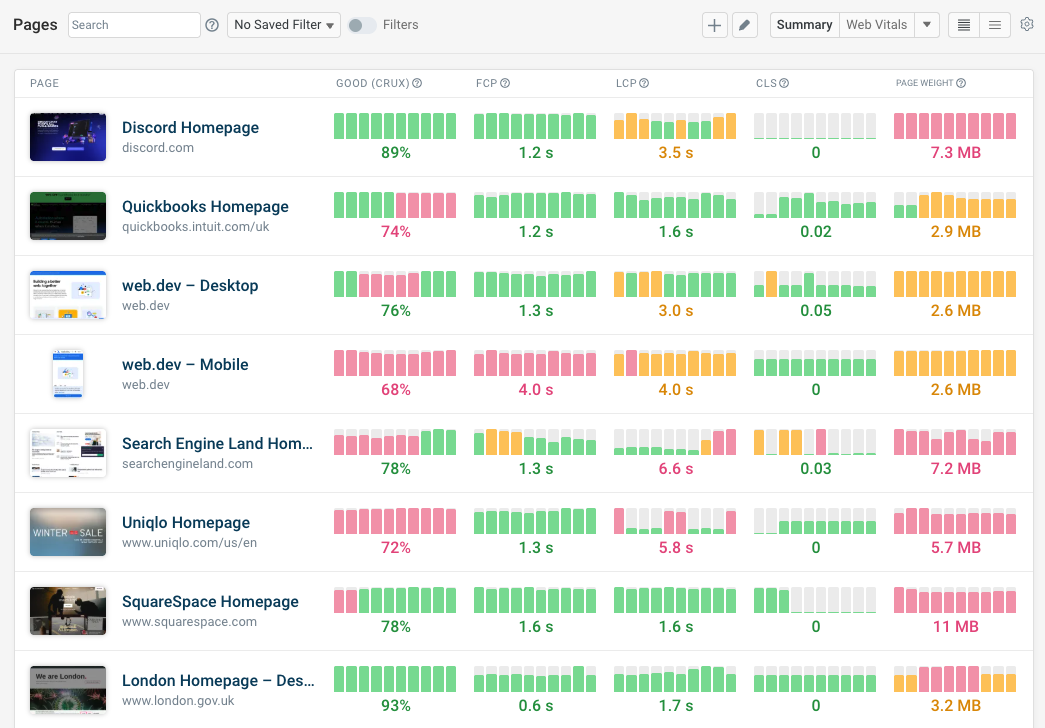
Use the project overview to view historical web performance trends including the First Contentful Paint metric.
You can also select other metrics to provide context on your FCP score, for example TTFB, Largest Contentful Paint, or page weight.
Benchmarking FCP with Google CrUX data
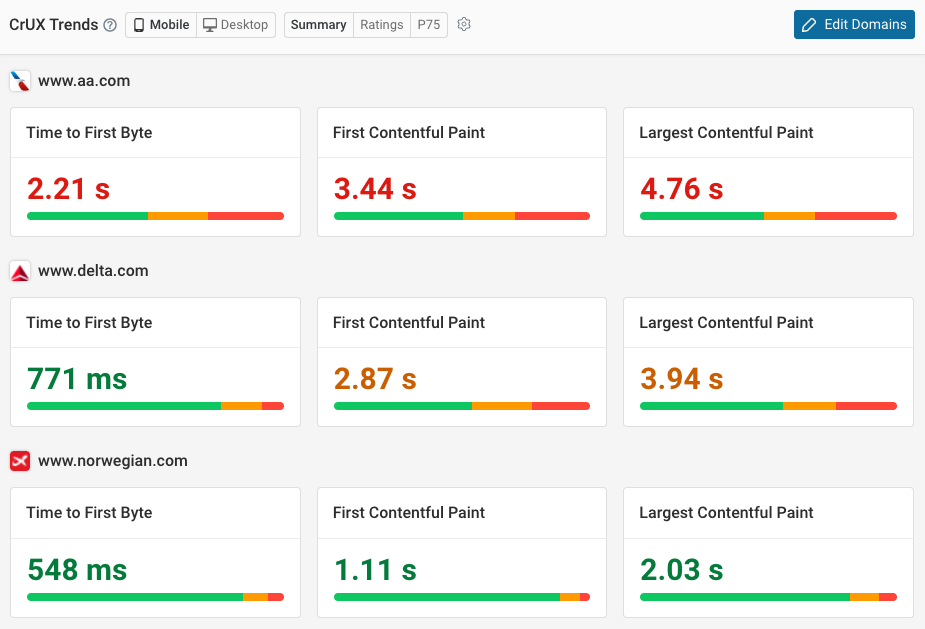
Google collects data from real Chrome users as part of the Chrome User Experience Report (CrUX). This data is then used for rankings, but it also includes diagnostics like the First Contentful Paint score.
CrUX data is great for benchmarking your website performance against competitors. DebugBear includes a CrUX Trends dashboard that makes it easy to compare performance in your industry.
First Contentful Paint in real user analytics
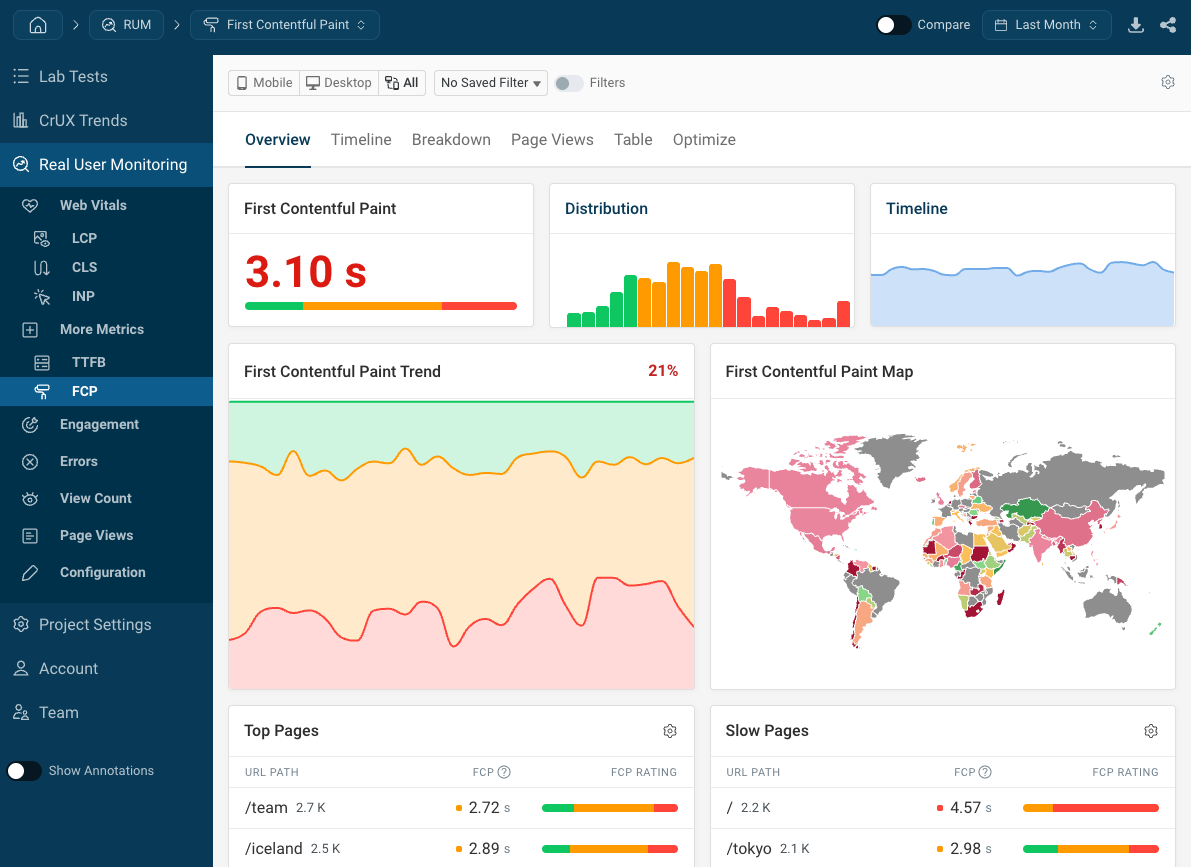
Tracking FCP for real visitors lets you see how fast your site is in the real world and what resources take the longest to load.
DebugBear real user monitoring (RUM) includes a dashboard just about First Contentful Paint. You can view what specific render-blocking requests most often prevent content from appearing quickly.


Monitor Page Speed & Core Web Vitals
DebugBear monitoring includes:
- In-depth Page Speed Reports
- Automated Recommendations
- Real User Analytics Data