
Maybe you’ve run into one (or all) of these as a developer:
- Your site isn’t loading as fast as it should.
- Your marketing team is panicking over a drop in conversions.
- Lighthouse scores are slipping.
- You've been handed a vague directive to "improve performance" but aren't sure where to start.
The consequences of poor performance are well-documented: every extra second of load time increases bounce rates and lowers conversion.
With users accessing sites from all kinds of devices and network conditions, optimizing performance is no longer optional.
This article will tackle common web performance issues and how to address them in Next.js.
What is performance, and why does it matter?
The writers at web.dev put it best:
Web performance is a crucial aspect of web development that focuses on the speed at which pages load, as well as how responsive they are to user input.
Put simply, performance is about reducing the time between a user's first click and their ability to interact with your site. That experience should be fast, seamless, and intuitive.
Nobody likes buffering or slow pages. People want to see and do what they came to see and do!
The modern web demands strong performance for three key reasons: search rankings, user experience, and conversion rate.
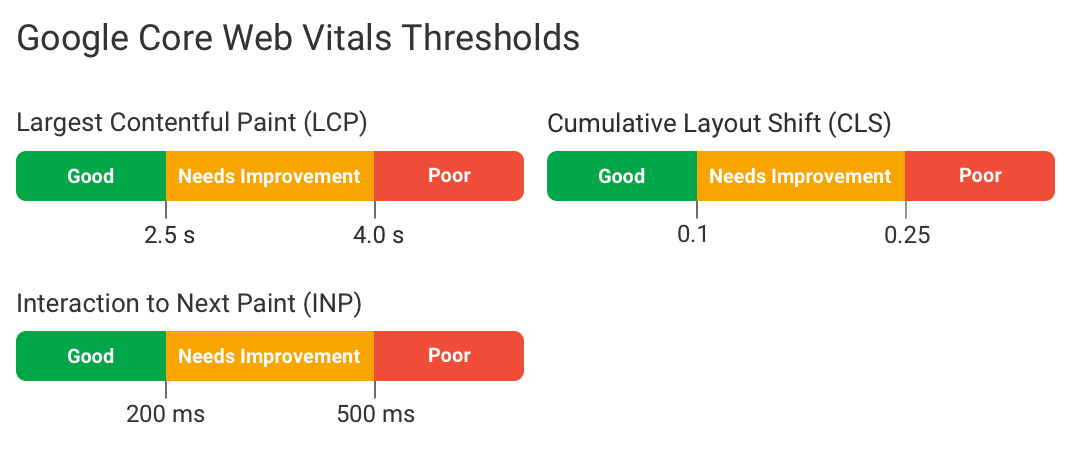
Google and other search engines and tools constantly crawl every website on the internet. If they determine your site is slow or unresponsive, Google will rank you lower when people search for relevant keywords, based on the Core Web Vitals assessment. You don’t need to be a marketing expert to understand how costly that can be.
It’s no longer just about keywords. If your site loads slowly, you get punished. End of story.
Performance is also a courtesy to your users. For many, your website is their first interaction with your brand. If you sell a product or service, your marketing site is your #1 salesperson. A fast, frictionless experience increases the chance of a purchase, a return visit, or a recommendation.
In short, performance work is not a luxury. Performance must be a core part of your development workflow.
Performance with Next.js
If you've made it this far, you're either already invested in the Next.js ecosystem or at least interested in the framework. So let's dive right in. (Here’s a great introduction to Next.js if you need it!)
Next.js comes with powerful performance optimizations out of the box. While these built-in features provide a strong starting point, knowing how and when to use them is crucial for building truly performant websites.
A few tips before we get started:
Tip 1: Stay as up to date as you can
This may seem basic, but keeping Next.js updated ensures you take full advantage of its performance improvements. Vercel prioritizes speed and optimization in every release, so even minor updates can make a difference.
Tip 2: Read the freakin' manual
Staying up to date also means reading the documentation. It’s not always exciting, but in a fast-moving front-end world, small changes can have a big impact.
Documentation is your friend, even when it seems boring.
Understanding the tools you use is what separates good developers from great ones. Copying and pasting from Stack Overflow or Reddit will only take you so far.
Fortunately, Next.js has excellent documentation, including dedicated sections on performance. Spend time reviewing and bookmarking key pages—you’ll thank yourself later.
What causes poor Next.js performance?
Next.js is a framework that sits on top of React. It inherits, adds to, and fixes some of the intrinsic issues that can commonly occur with React.
In any case you'll want to keep an eye on some of the primary ways you might run into performance bottlenecks:
- Large bundle sizes. Next.js runs unbelievably fast out of the box and it's easy to lose track of how much you're importing. Check out Vercel's documentation on how to analyze your bundle sizes and find what's too big.
- Complicated state leading to too many unnecessary re-renders of components. This is more of a React problem inherited by Next.js, which doesn't include its own optimized method for state management.
- Not using built-in methods to handle various things like fonts, scripts, and images. It has the tools; use them!
- Installing and using too many dependencies. When things are fast, it's easy to think, "One new package couldn't hurt it!" but after a while of this thinking, cold-starts and builds will take exponentially longer.
- Images being poorly (or not at all) optimized either in the file or in the code. Large and unoptimized images are incredibly expensive to performance.
Not an exhaustive list but primarily the areas I've seen performance take a hit. The goal is to train our developer minds to keep our eyes open for where these bottlenecks can occur and architect our websites to perform as best they can for our visitors.
Static vs Server-side
Next.js has three ways of rendering your content to your users: static, dynamic, and streaming. You can set up your project (or individual pages) to take advantage of the specific use-case you need.
- Static pages are pre-rendered at build time and served as cached HTML, making them almost always the fastest to load.
- Dynamic pages are generated on the server for each request, ensuring the latest content but with higher latency.
- Streaming pages also render on the server but send content in chunks, allowing faster initial loads while waiting for data and serving it as soon as it can.
As you develop pages, Next.js automatically determines what sort of rendering method is best for your page (unless of course you specify otherwise).
Note: in this article I'll be primarily addressing the Next.js App Router as opposed to the Pages Router, but the principles will be mostly the same.
Here's a small tooling site example. When we run yarn build, we see Next.js work through the build and then finish with this sort of output:
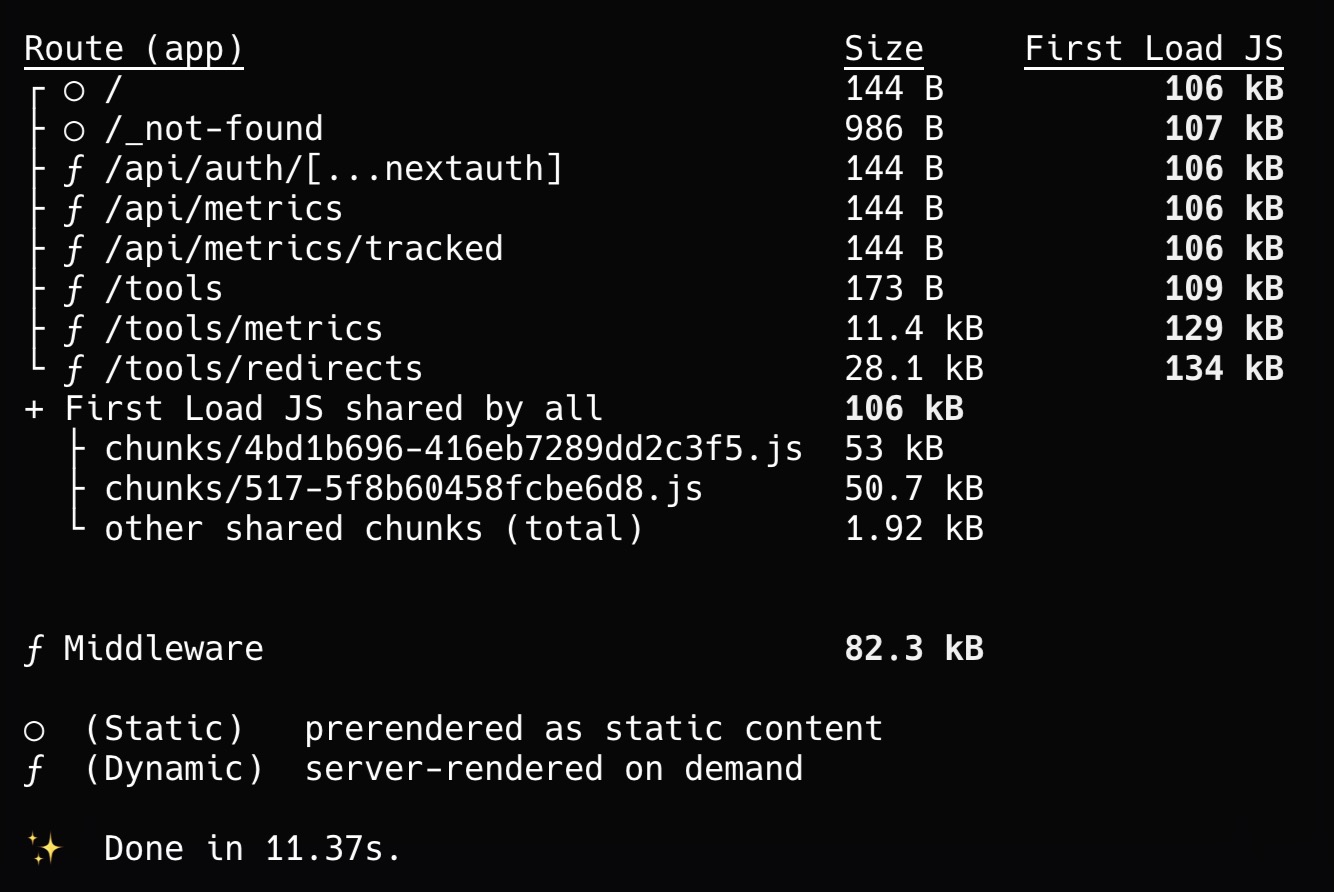
This is a great way to see your overall bundle size, what's static or not, and overall what might need improvement.
In the above example, you can see that the homepage and 404 page don't have any dynamic or server-fetched content and are therefore built "static". In contrast, API routes and tools that rely on server requests or dynamic content are rendered on request.
Here's a ridiculously simple example of a static page:
// app/about/page.tsx
export default function AboutPage() {
  return <div>This is a static about page!</div>;
}
This page is stupid simple and since it has no external data dependencies, Next.js will generate it at build time and serve it to browsers as a cached HTML file.
Static pages are your first line of defense toward improving site performance. If your page is already cached HTML, the server is doing less work, the browser is doing less work, and that means faster loading times for everyone.
But what if you need to regularly refresh content on those pages?
Using revalidation with static pages
Revalidation is useful when you want to generate a static page but also refresh the page content periodically without requiring a full rebuild.
For our About page, let's say we're fetching all of our teammates from our CMS and every so often they make changes to their profile pictures or personal bio.
We don't want to push new code or rebuild the entire site every time there's a change, so we can very easily add revalidation:
// app/about/page.tsx
export default async function AboutPage() {
  const team = await fetch("https://api.example.com/team").then((res) =>
    res.json(),
  );

  return (
    <div>
      <h1>Meet Our Team</h1>
      <ul>
        {team.map((member) => (
          <li key={member.id}>
            {member.name} - {member.role}
          </li>
        ))}
      </ul>
    </div>
  );
}

// We can optionally tell Next.js we want to override its decision making and force it to be a statically generated page
export const dynamic = "force-static";
// Revalidate the data every hour
export const revalidate = 3600;
We're still telling Next.js to generate and cache the page at build time, but we're also instructing it to get fresh data after an hour.
This is obviously a super simple example, but you can extrapolate this to pages that don't typically need updating:
- Marketing pages
- Blog posts (with revalidation time depending on your methods)
- Product documentation
- Landing pages
In most cases you'll want to use static rendering, especially for your run-of-the-mill websites and marketing pages.
We can also force pages that don't have to be dynamic to render as static with revalidation.
Every modern browser has tools to view the waterfall of network requests a page makes, helping you analyze performance.
- Chrome: Use the
Networktab in the Chrome Developer Tools (Cmd + Option + I/Ctrl + Shift + I). - Safari: Enable the
Developmenu in settings, then use theNetworktab in the Safari developer tools. - Firefox: Open the
Networktab in Web Developer Tools (Cmd + Option + I/Ctrl + Shift + I).
Using the network tab, we can see two different examples of the same page rendered as static or as server-side.
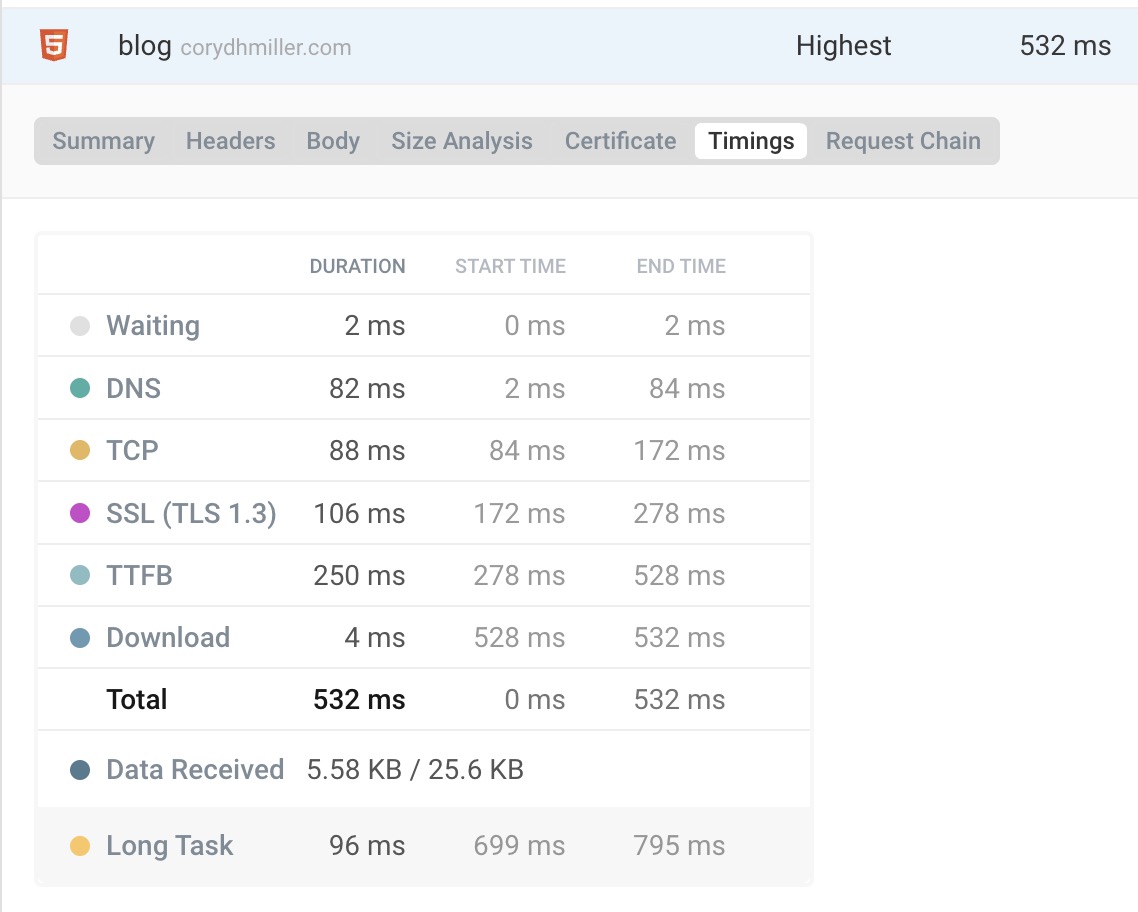
With server-side rendering, this blog archive page is generated on request. It's still really fast, but you can see it takes slightly longer to display initial content to the user.
Using my personal website, here's what a typical network waterfall might look like for a server-side rendered page using the website test tool by DebugBear:
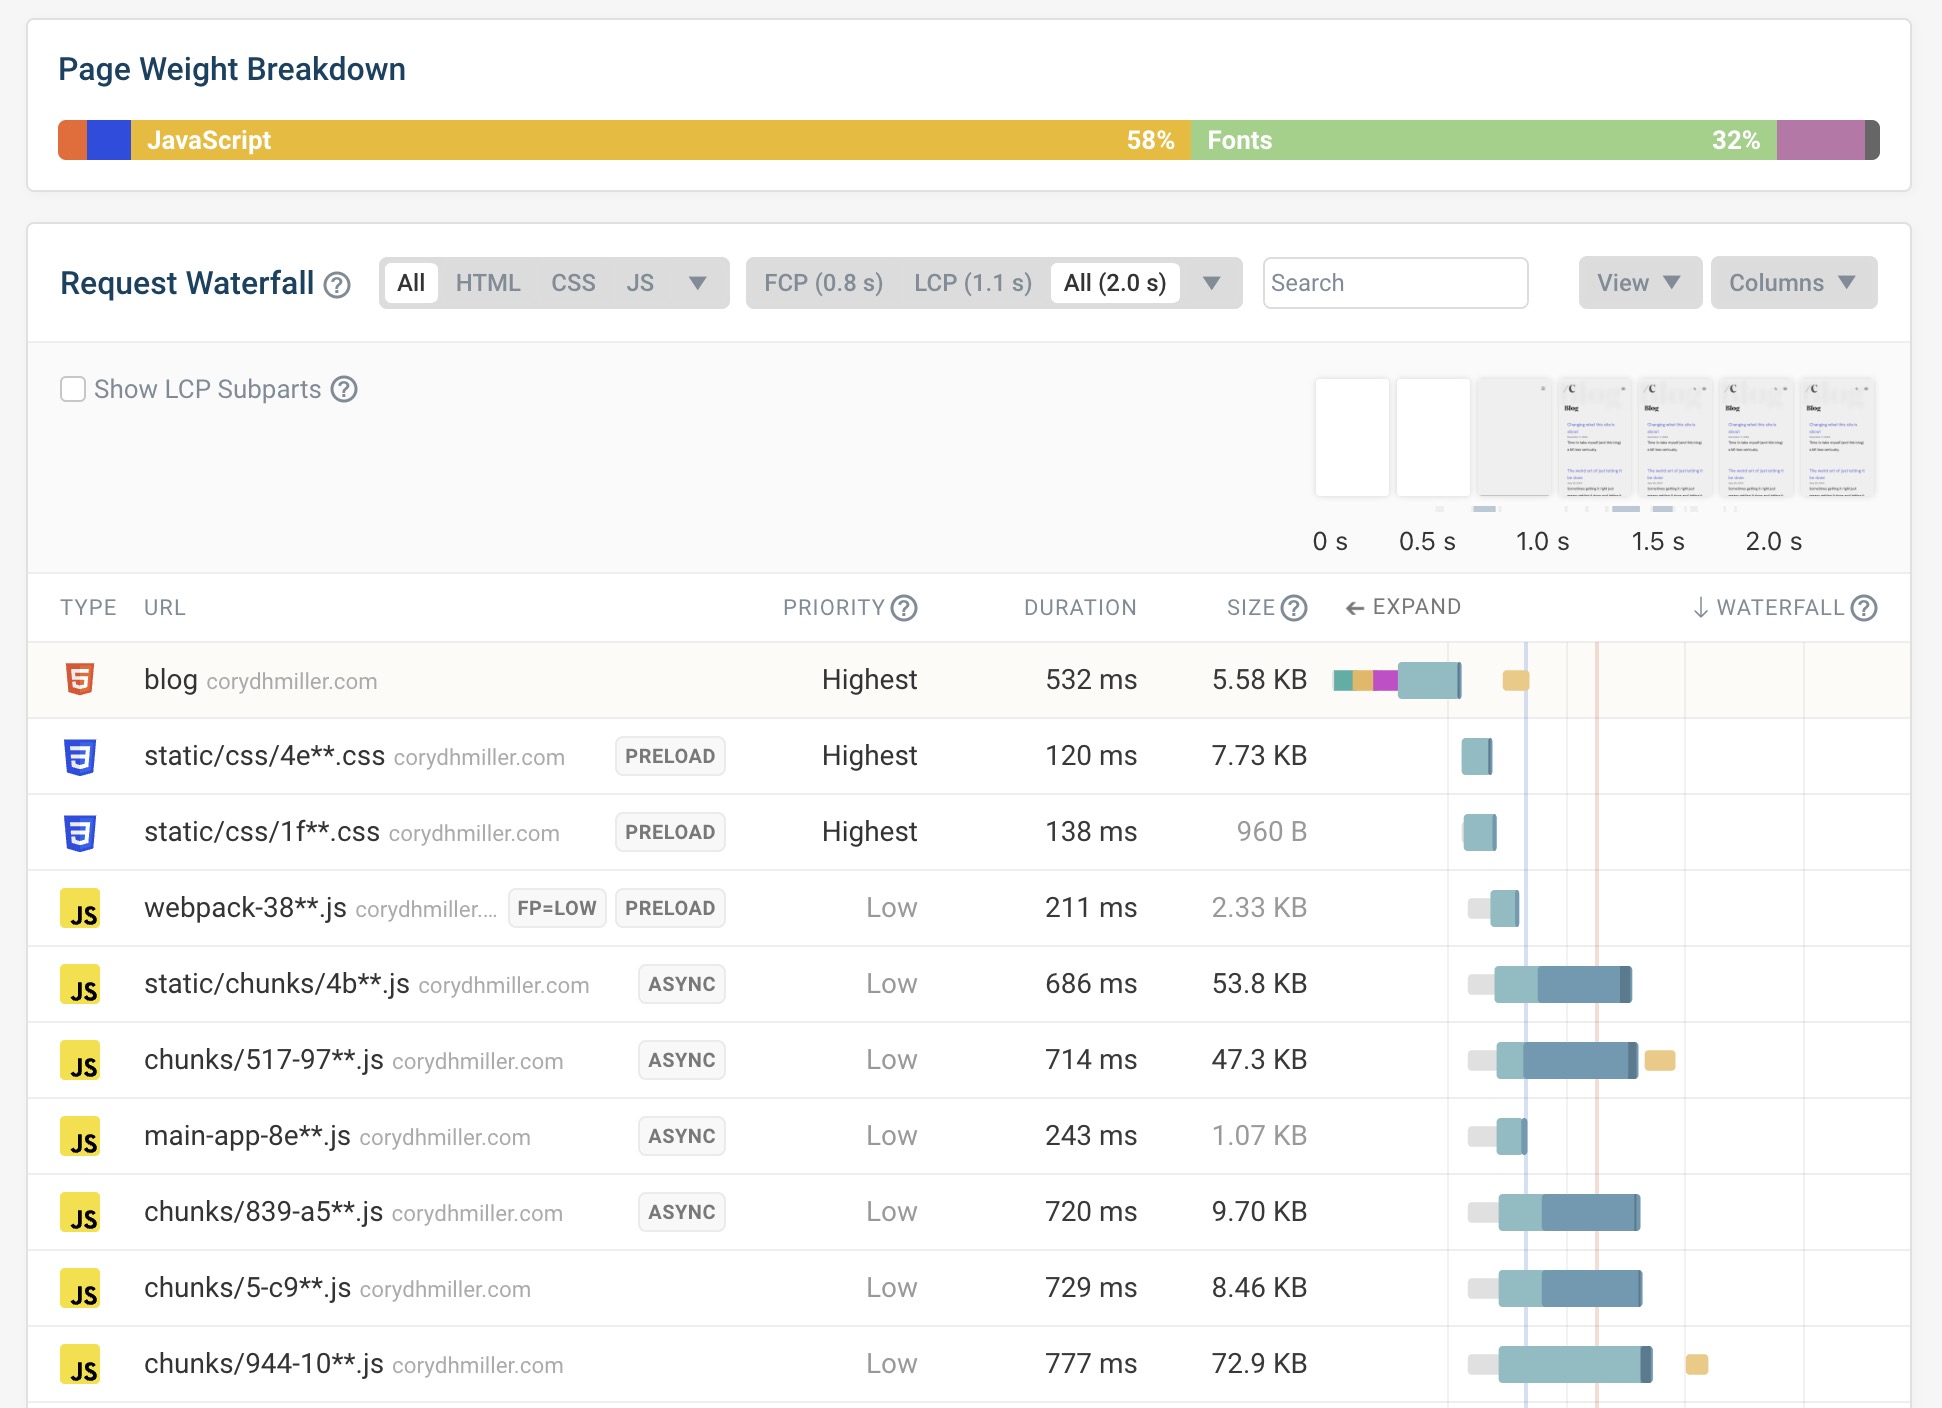
Not too bad!
Subsequent views are cached and displayed very quickly to the user, and this page is small enough that it's no real problem.
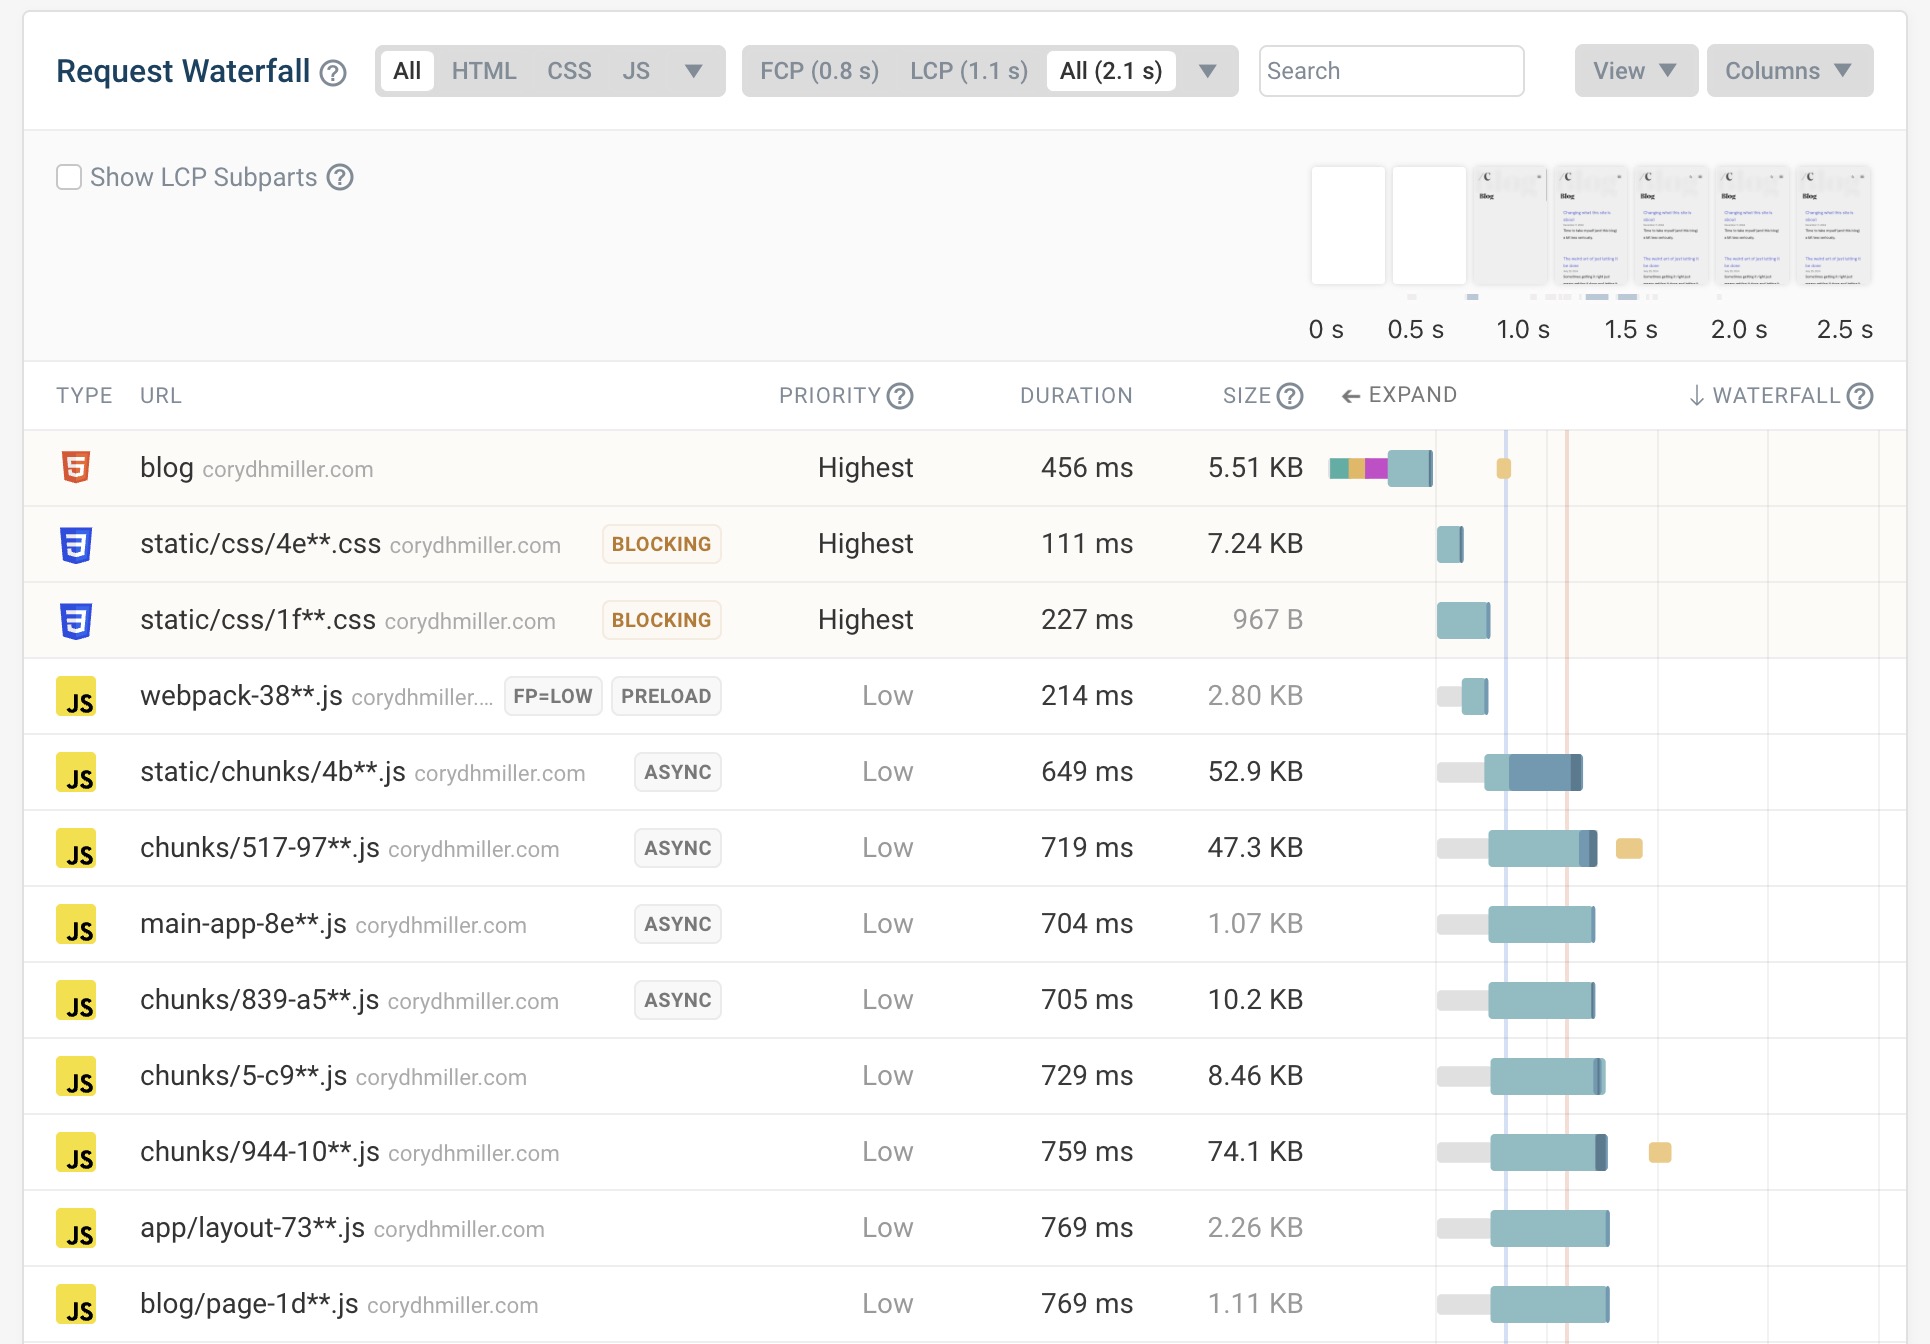
With the same page building as static however, we can easily see improvement in page load times.
The one to pay attention to here is the blog line item. With DebugBear we can check out the actual timings with the request and load times:
Now again we look at the same timing sheet for the same page that has been built statically:
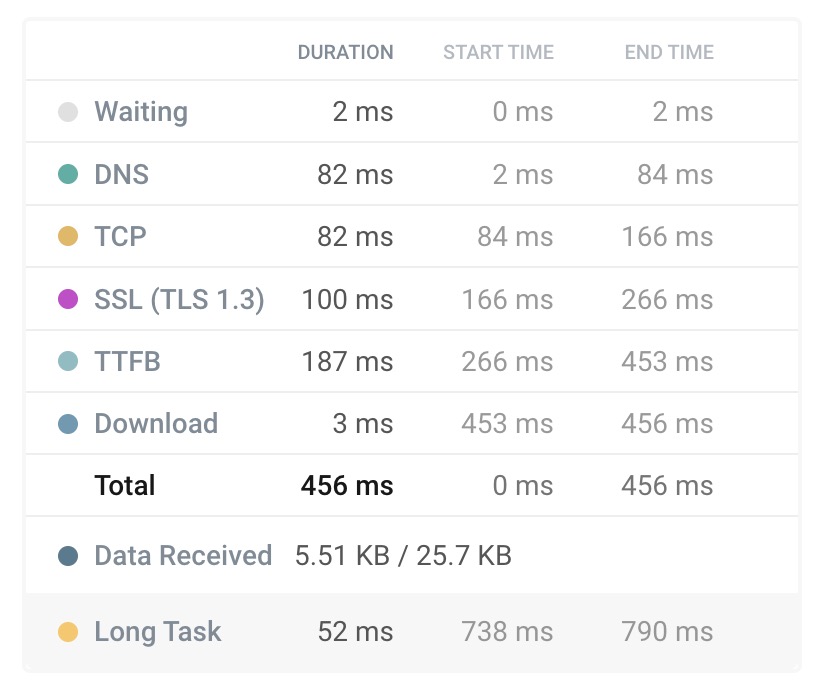
By rendering this page with the static method, we dropped almost 100 milliseconds of load time, and that's just the main document! This means content can load faster, display to the user faster, and overall score better.
Again it will ultimately depend on your needs, but for 9/10 marketing sites and their pages, a statically-built page with low overhead is the way to higher rankings.
Static is not always better than dynamic or vice versa—there are pros and cons and tradeoffs with each.
Server-Side Rendering and Performance
While static pages are often fastest, sometimes you need server-side rendering (SSR). Mostly this would be in the form of up-to-date data, but it could be anything you needed.
Let's take a look at an example dashboard page that displays Analytics. We'll pretend to simulate a network request that takes 2 seconds so we can see how it impacts a page load time.
// app/dashboard/page.tsx

import AnalyticsPanel from "./components/AnalyticsPanel";
import DashboardHero from "./components/DashboardHero";

export default function DashboardPage() {
  return (
    <main>
      <DashboardHero />
      <AnalyticsPanel />
    </main>
  );
}

// app/dashboard/components/AnalyticsPanel
export default async function AnalyticsPanel() {
  // In this example, we're simulating a 2 second API fetch so we can see how it looks. Don't worry about this for now.
  const delay = (ms: number) =>
    new Promise((resolve) => setTimeout(resolve, ms));
  await delay(2000);

  return (
    <div className="bg-white">
      <div className="container">
        <h2 className="text-2xl">Analytics</h2>
        {/* Analytics content */}
      </div>
    </div>
  );
}
What's happening here?
Because this page includes a component that needs to fetch content, and because Next.js pages and components live on the server by default, the page won't render until it has all of the requested data.
Take a look at the network waterfall:
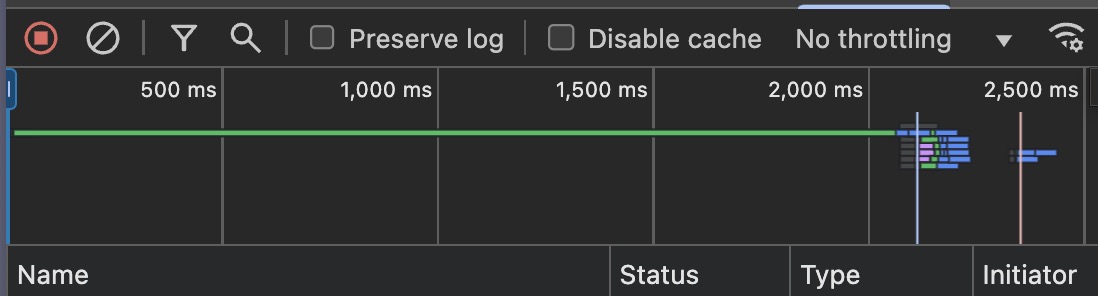
The green bar there is showing how long the request to the page is taking, because we're waiting on that 2-second API we mocked up. This means the page won't even start showing any content to the viewer until after two seconds!
Let's use Next.js and React's Suspense to see how we can fix this.
// app/dashboard/page.tsx
import { Suspense } from "react";
import { AnalyticsSkeleton } from "../components/Skeletons";
import AnalyticsPanel from "./components/AnalyticsPanel";
import DashboardHero from "./components/DashboardHero";

export default function DashboardPage() {
  return (
    <main>
      <DashboardHero />
      <Suspense fallback={<AnalyticsSkeleton />}>
        <AnalyticsPanel />
      </Suspense>
    </main>
  );
}
We're telling Next.js that we want to load the rest of the page as fast as possible since maybe DashboardHero is a simple component that doesn't need a lot of load time.
With React Suspense, we give a lightweight fallback component, maybe just some "glowing" or a loading indicator, to display to the user to let them know we're loading in data.
Here's a really simple example of how it might look:

Great! Let's check out the waterfall now:
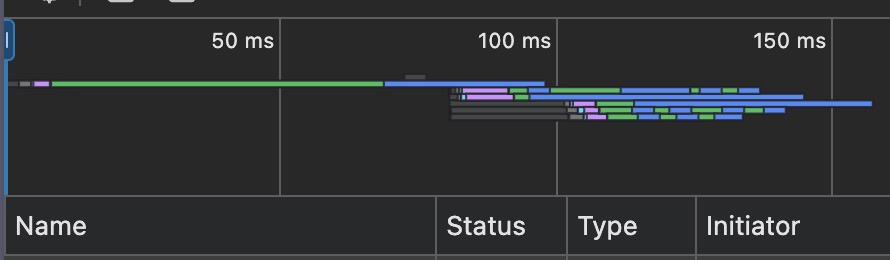
Now the page itself takes less than 100ms to display content to the user, and then finishes up loading in the required data after two seconds, a huge win!
Here's what we're learning here:
- Next.js and React have many tools built in to help improve actual and perceived performance.
- Developer tools in browsers are incredibly helpful in showing us exactly what's happening on any given page.
These examples are obviously simplified, but hopefully you can see the ways we navigated our pages and components to provide a net positive to our site's performance.
Dynamic loading for larger pages
There's another method that's closely related to Suspense built directly into Next.js called next/dynamic. This is another way to dynamically load in content as the user needs and can reduce load times and sizes.
In a nutshell, next/dynamic works to split up your code into smaller bundles that can be loaded in whenever they're needed.
A rough example: let's say your page's initial code bundle is 200kb and there's a component further down the page that most users may not see but takes up 80kb for some reason. You could use next/dynamic and reduce the initial bundle to 120kb instead.
Since Next.js 13 introduced the App Router, most of the components in Next.js are rendered on the server rather than on the client. That means less requests from the client, which means less of a necessity to use a tool like next/dynamic. It's still a good tool to use if you're using a lot of client-side components or the Pages Router.
Instead of importing the component like usual, you use next/dynamic as its own loader:
import dynamic from "next/dynamic";
// We import HeroSection like normal...
import HeroSection from "./sections/HeroSection.tsx";
// We declare EndSection as a const so we can take advantage of next/dynamic
const EndSection = dynamic(() => import("./sections/EndSection.tsx"), {
  loading: () => <div>...</div>,
});

export default function LandingPage() {
  return (
    <>
      <HeroSection />
      <EndSection />
    </>
  );
}
Essentially what we are doing is indicating to the browser that HeroSection needs to be viewable immediately but it can load EndSection as soon as it's able to.
Sometimes sites add hooks to only load in these components when they're near the viewport as someone is scrolling, but it depends on your use-case.
Main tip with next/dynamic: Do some testing with a few pages and components to see if it actually improves overall load times, and if it doesn't there's probably no need to complicate it further. Keep it as a tool in your toolkit if you need it!
Images: The Silent Performance Killer
Images are often the biggest culprit behind slow load times. They're essential for engaging content, but they're also typically among the largest assets we serve to visitors.
What makes an image performant?
File size, format choice, proper specified dimensions, and loading strategy are all factors that should be top of mind. Fortunately, Next.js also accommodates this by default.
Using next/image to improve performance
Next.js comes with a built-in Image component that works right out of the box with plenty of optimizations built in.
Here's an example of loading in an image using next/image:
import Image from "next/image"
<Image
src="/images/cory-miller-profile-picture.png"
alt="Cory Miller"
width={384}
height={384}
/>
// HTML Output:
<img alt="Cory Miller" loading="lazy" width="384" height="384" decoding="async" data-nimg="1" style="color:transparent" srcset="/_next/image?url=%2Fimages%2Fcory-miller-profile-picture.png&w=384&q=75 1x, /_next/image?url=%2Fimages%2Fcory-miller-profile-picture.png&w=828&q=75 2x" src="/_next/image?url=%2Fimages%2Fcory-miller-profile-picture.png&w=828&q=75">
This looks pretty close to a normal img tag, but next/image does a handful of things without you even asking for it.
By default you can see Next.js has set up the image to have both a 1x and 2x image delivered to users, but has also added q=75 and automatically optimized the image to reduce the file size.
Look at how the file size changes with the quality set to 100, 75, then 50:

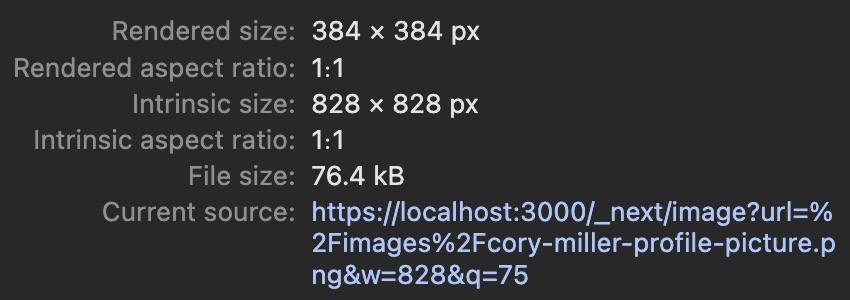

Going from 100% quality to 50% quality has a reduction of 141 KB, which is a huge savings from a performance perspective.
You'll rarely come across situations where you need 100% image quality on the web, so play around with the quality until you can visibly see a difference. You may be surprised at how far you can push it!
Handling priority images for improved LCP
With next/image you can add priority={true} to an image to make sure it gets fetched as early as possible.
<Image
  src="/images/cory-miller-profile-picture.png"
  alt="Cory Miller"
  width={384}
  height={384}
  priority={true}
  fetchPriority="high" // Next.js doesn't default to fetchpriority="high", so we make sure to add it here if needed.
/>
This will remove lazy loading for this particular image and prioritize fetching the image as early as it can in the page render cycle.
Make sure to use priority and fetchPriority for the most important image at the top of your page to help with LCP scores (don't overdo it, just the main image!)
Other benefits that come with next/image
Lazy loading is enabled by default. Images will only load for the user when absolutely necessary by automatically adding in loading="lazy".
Required width and height means no layout shift. Ever been to a website where you go to click a button or link and a new section or image loads in and you end up clicking something else? Websites get penalized if slow-loading content suddenly pops in and shifts everything around, and this is prevented by a requirement by next/image to define the width and height of the image.
Optimally loading third-party scripts
Third-party scripts often tank site performance. Whether it's analytics tools, marketing pixels, or sales qualification scripts, you'll need to balance functionality with performance impact.
Next.js comes with its own method of script loading with a component called next/script, and we can add that to our overall performance strategy checklist.
The usage of next/script is pretty straightforward:
// Only applies to the current page.
// app/new-features/page.tsx

export default function NewFeatures() {
    return (
        <>
            <div>Some content.</div>
            <Script src="https://example.com/analytics.js" />
        </>
    )
}

// Or, using the app router layout, you can load scripts on any sub-pages using that layout.
// app/dashboard/layout.tsx for example would apply to /dashboard, /dashboard/tools, /dashboard/metrics, etc.

export default function DashboardLayout({children}: { children: React.ReactNode}) {
    return (
        <main>{children}</main>
        <Script src="https://example.com/analytics.js" />
    )
}
It's quite similar to a normal HTML tag, but we're given a few props to help control how we load in scripts. The main prop you'll be using is strategy, where you can use "afterInteractive" (the default strategy), "lazyOnLoad", "beforeInteractive", and "worker".
In most cases, "afterInteractive" will work just fine. Most scripts will demand you make sure their script is highest priority and to load it before anything else, but always take this with a grain of salt and test how your page loads and the script performs with the various strategies.
Depending on the script you're loading, try to limit the number of pages the script loads on. This takes a bit of strategic thought and not just dumping scripts into the header for every page.
Here's a set of questions I always ask anyone on my team if they request loading in additional scripts on our marketing site:
- Why do we need this third-party script loaded on our site?
- What does it do? Is there documentation for it I can read?
- What pages is it necessary for it to load on? What pages probably do not require this script?
You should always default to using next/script and check through your browser's network tools to make sure your new scripts aren't preventing your pages from loading quickly.
Curious on how your site is performing?
There are a ton of tools you can use to measure and test the performance of your site, one of which you're reading this article on! DebugBear has a great free website speed tool that gives tons of fantastic details about how your page is loading in real-world scenarios.
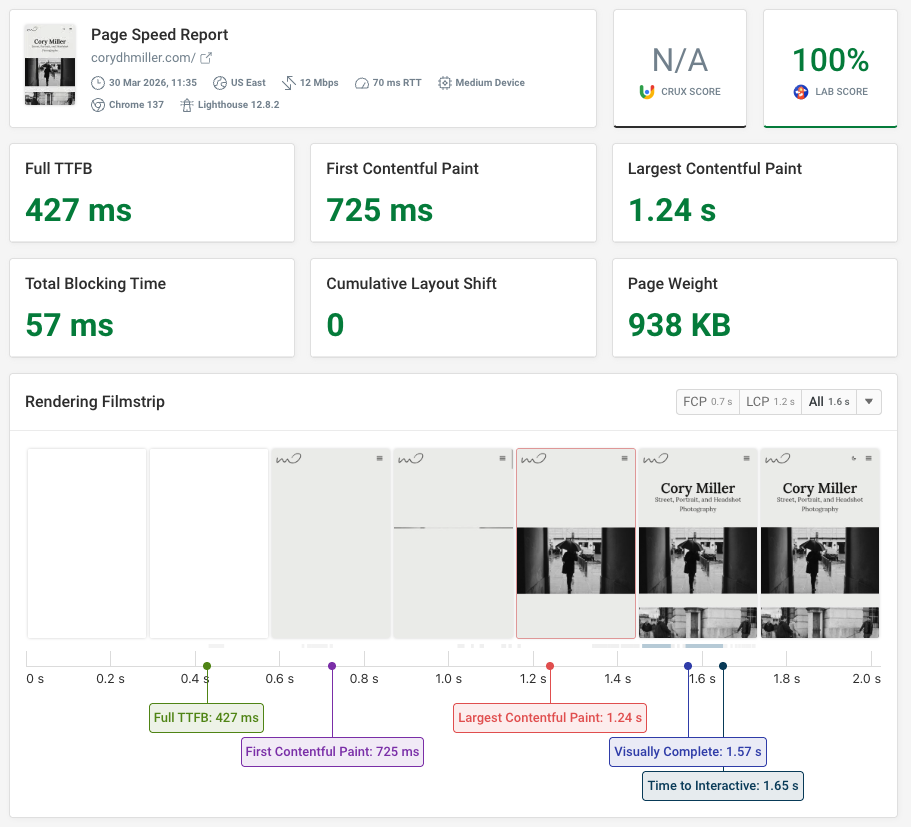
Just type in your website and you can immediately see how your site is displaying on the average connection, including a visual "waterfall" of loading times. As you can see I still have some work to do to make my site the best it can be!
Sign up for a free trial to get web performance insights and fix your Core Web Vitals with DebugBear.
Monitor Next.js application performance
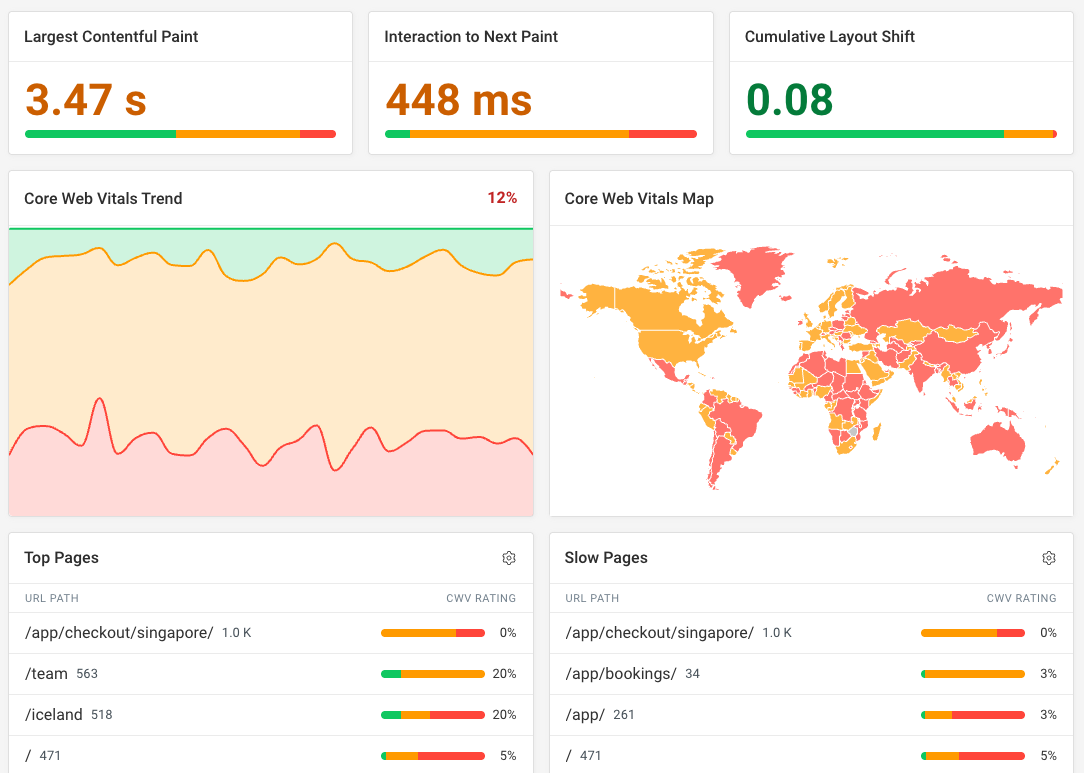
You can also use DebugBear to track the performance of your Next.js app over time, using either synthetic monitoring or real-user monitoring (RUM).
Here's an example RUM dashboard showing performance scores across your website and broken down by page.
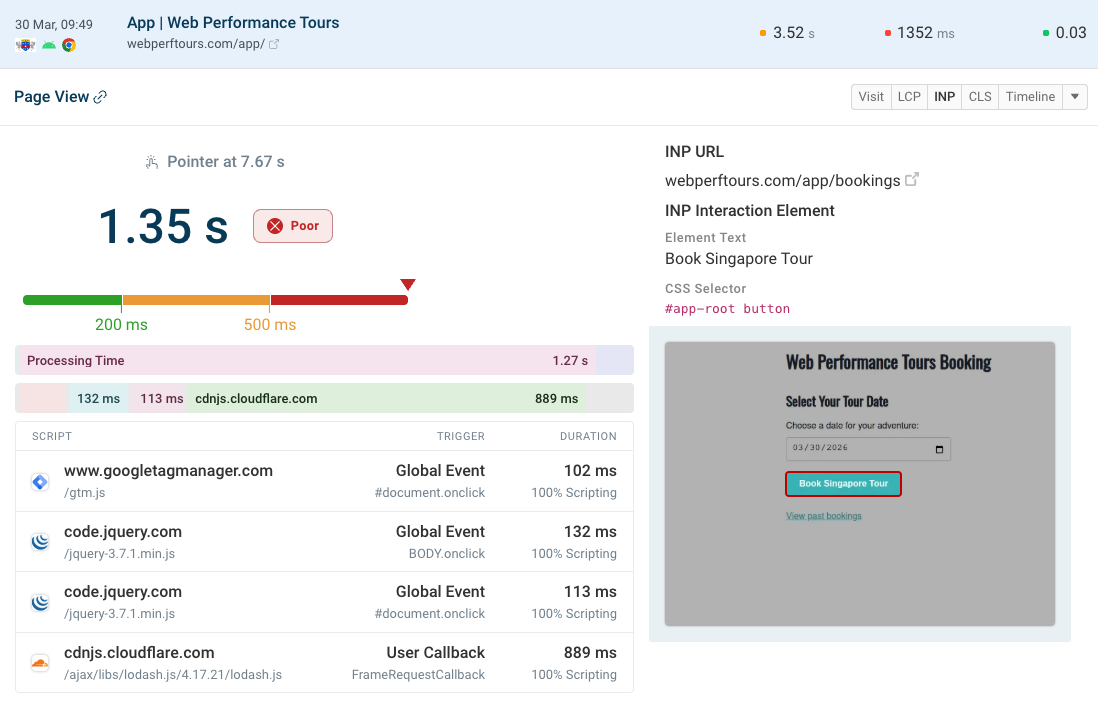
One factor that Google looks at for rankings is the Interaction to Next Paint (INP) metric. It measures how quickly a page responds when the user clicks on it or types using their keyboard.
DebugBear provides detailed data to help you debug these slow interactions:
- What pages have poor INP?
- What page elements cause slow interactions?
- What scripts are causing interaction delays?
You can view this data across your website or when looking at specific slow user experiences.
Conclusion
This is not an exhaustive article, and there are many other ways we can optimize our systems and code to develop a better web. Next.js is one of the leading frameworks that helps developers build performant sites simply by providing patterns and tools to make it simple.
The best way forward is to make sure considering performance is part of your development workflow from the start. Learn how to use the tools Next.js provides, how to check your overall site size, and how you can adopt best-practice patterns to help keep your site as blazing fast as you can.
Happy coding!


Monitor Page Speed & Core Web Vitals
DebugBear monitoring includes:
- In-depth Page Speed Reports
- Automated Recommendations
- Real User Analytics Data