
PageSpeed Insights is probably the most widely-used website performance tool. Google provides it for free and promotes it to website operators as the best place to start analyzing web performance.
In this guide, you'll learn how you can test your website with PageSpeed Insights, how to interpret the different types of data, and what you can do to make your website fast.
What is PageSpeed Insights (PSI)?
PageSpeed Insights is a free tool provided by Google that allows you to measure the speed of your website.
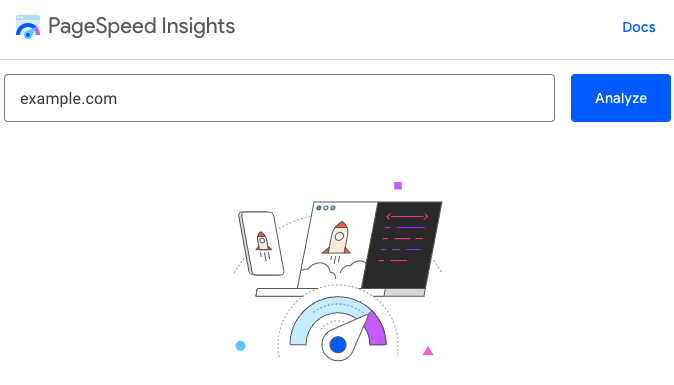
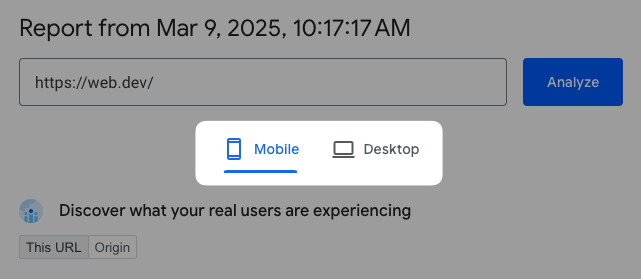
To run a test, just go to pagespeed.web.dev, enter your website URL, and click Analyze.
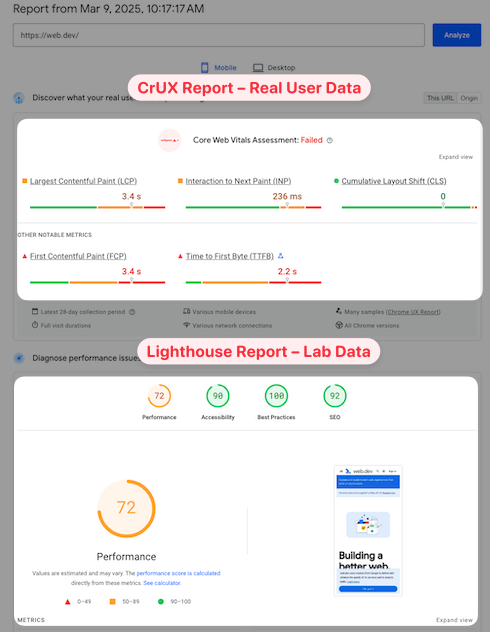
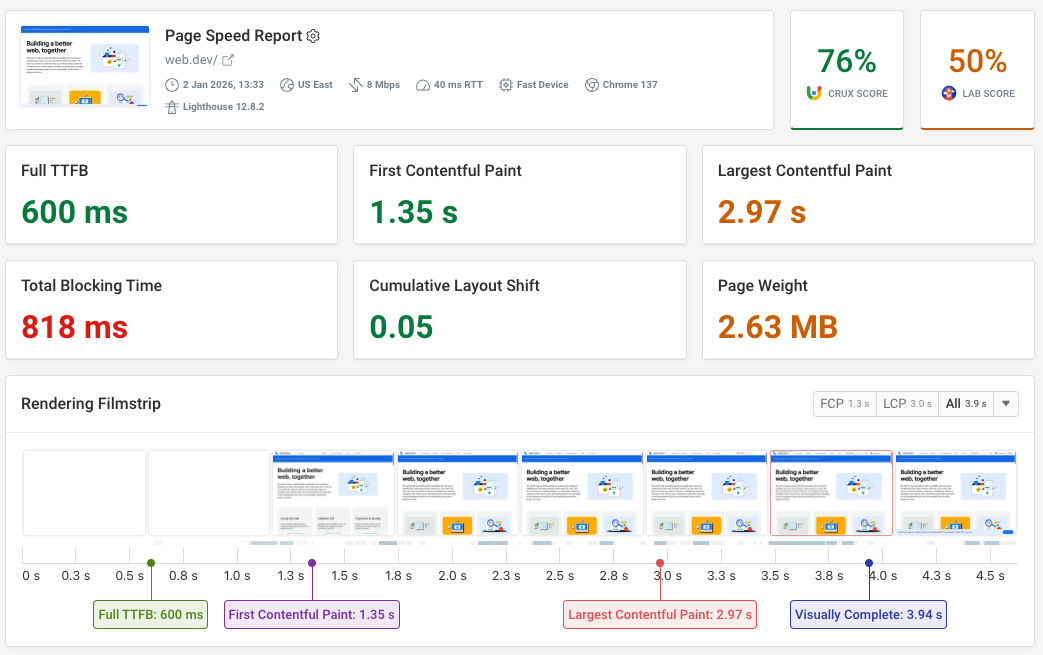
If your website gets enough traffic, PageSpeed Insights will quickly show real visitor data that Google has collected from Chrome users. After half a minute or so you'll also see a performance diagnostics report that's run on-demand.
How does Google PageSpeed Insights work?
Under the hood, PageSpeed Insights is based on two data sources:
- The Chrome User Experience Report (CrUX), providing real user measurements from your website covering the last 28 days
- A Lighthouse report that's run on-demand in a controlled lab environment and provides detailed diagnostics
CrUX data is great to see how your website is performing for real users. The Lighthouse report is useful to identify specific performance issues and optimizations.
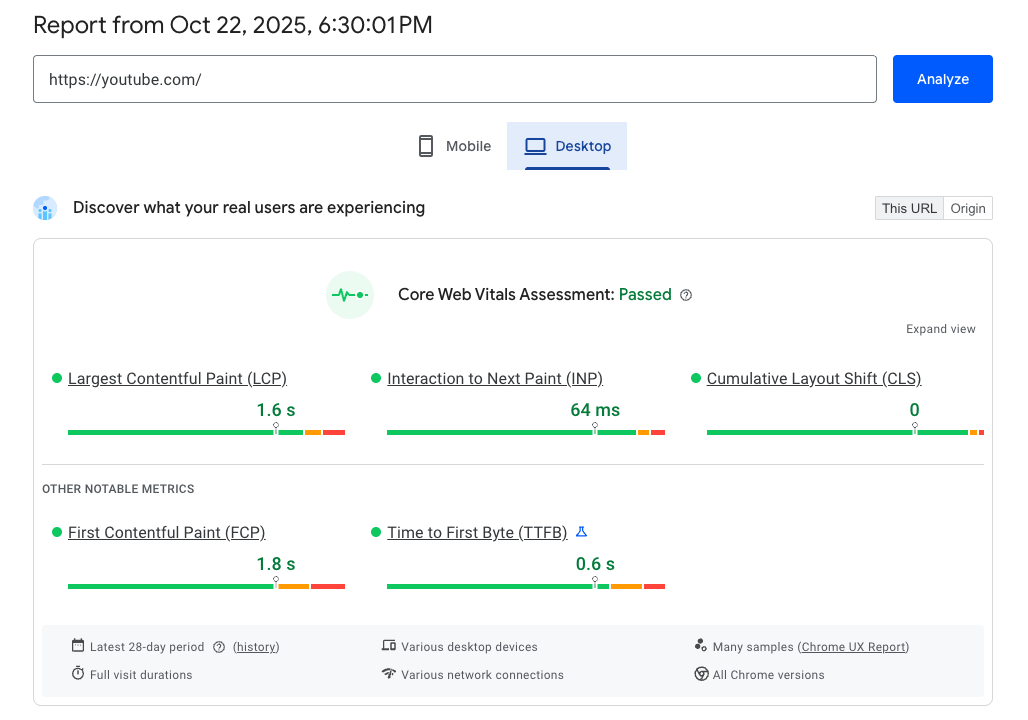
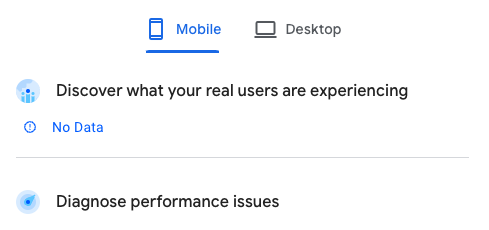
Discover what your real users are experiencing: the CrUX report
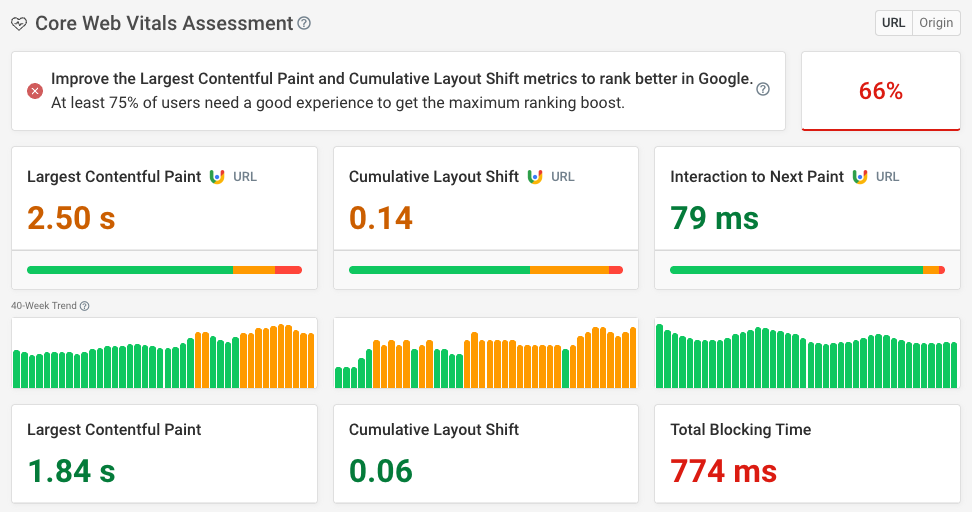
The CrUX data at the top of the PageSpeed Insights report tells you whether your visitors are having poor experiences on your website. That's based on measuring the three Core Web Vitals metrics:
- Largest Contentful Paint: how quickly does the page load?
- Cumulative Layout Shift: do page elements move around after rendering?
- Interaction to Next Paint: how fast does the page respond to user interactions?
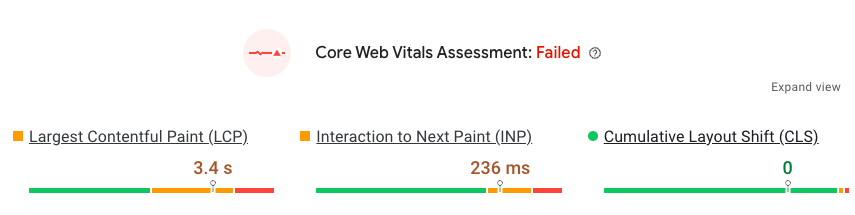
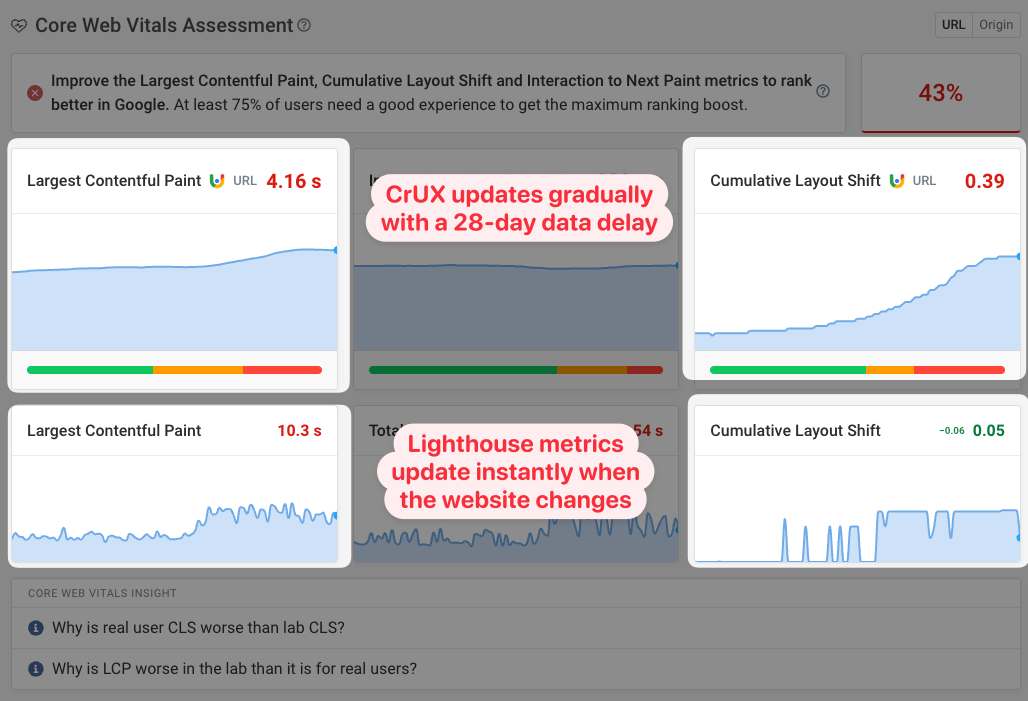
Together, these metrics are used to make an overall Core Web Vitals assessment for your website.
No real user data on PageSpeed Insights
Google only reports CrUX metrics when a page gets enough visitors. Sometimes only origin-level (i.e. site-wide) data may be available, or no data at all.
There are several common reasons for CrUX data to not be available:
- Small websites
- Non-production sites like staging servers
- Websites that receive many anonymous views (for example health-related websites)
CrUX data is only collected from Chrome users who are logged into their Google account. iOS data never contributes to CrUX scores.
View CrUX data history over time
Google provides a 40-week history for your Core Web Vitals metrics. While this data is not surfaced in the PageSpeed Insights report, you can run DebugBear's Core Web Vitals test to see how your performance has developed over time.
Diagnose performance issues: the Lighthouse report
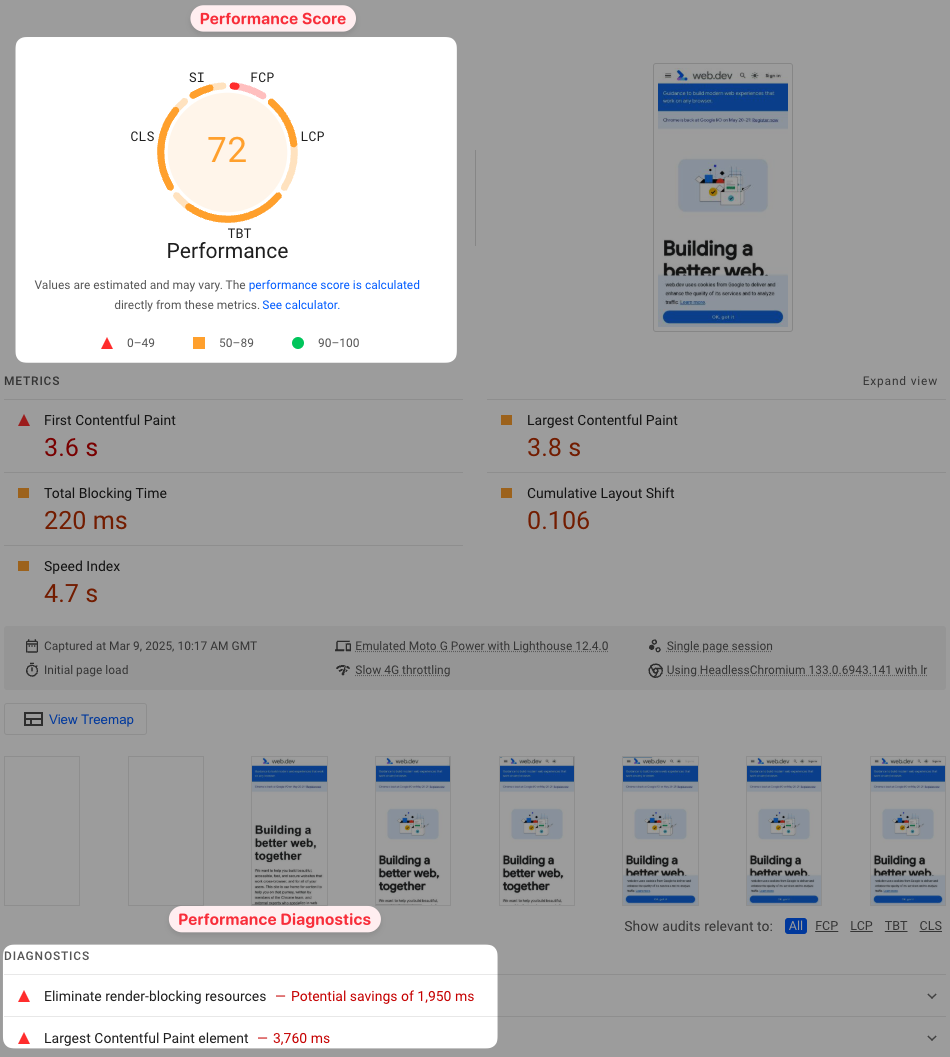
The Lighthouse report metrics don't come from real users. Instead Google visits your web page on one of their servers using Chrome, measures loading time, and analyzes your page for potential performance improvements.
At the top of the Lighthouse report, Google shows an overall Performance score between 0 and 100. This score is made up of 3 components and 5 metrics:
- 45% page load time across three metrics, with Largest Contentful Paint contributing the most
- 30% Total Blocking Time
- 25% Cumulative Layout Shift
Interaction to Next Paint can't be measured in a lab test without user interactions. Total Blocking Time is the closest equivalent Lighthouse metric, but it only measures background CPU activity that can cause slow interactions, not slow interactions themselves.
One advantage of running in a controlled test environment is that a large amount of diagnostic data can be collected. Lighthouse processes that data and presents it through a number of performance audits with concrete recommendations to improve your website performance.
Differences between real user data and the Performance score on PSI
You'll often find that your real user metrics are better than what the PSI performance diagnostics report shows. That's because Lighthouse uses a slow network connection for testing, while actual visitors usually have a faster network.
Sometimes you'll have a poor Performance score, but not urgent performance problems.
Use the real user CrUX data to see if your website is fast enough for most of your visitors, then check the Lighthouse diagnostics report to identify optimizations.
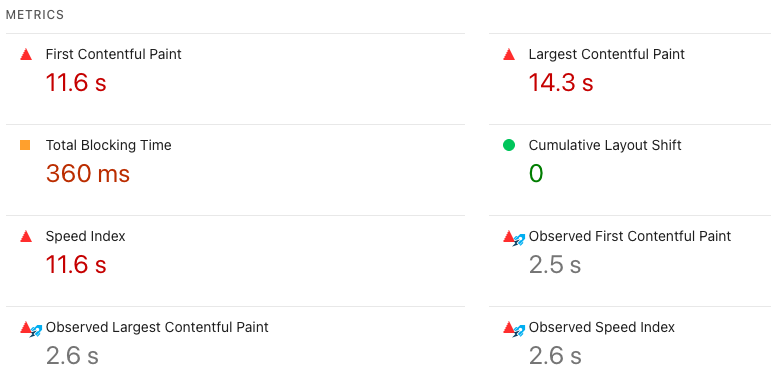
Lighthouse data reliability
PageSpeed Insights offers a quick way to test your website, but the lab data isn't always reliable. That's because it's based on a simulation rather than directly measured performance metrics.
Our site speed Chrome extension can surface the measured metrics in addition to the simulated ones on PageSpeed Insights.
To get more reliable data, try the DebugBear page speed test. Like PageSpeed Insights it also reports both CrUX and lab test data.
However, it collects data with reliable network throttling and provides additional diagnostic data like a request waterfall.
Mobile vs. desktop performance data
You can switch between viewing mobile and desktop data. Typically mobile performance will be worse than on desktop, because network and CPU speeds are slower.
For the Lighthouse test, the mobile device uses a screen size of 412x823 pixels, while the dimensions for the desktop device are 1350x940 pixels. The mobile device also uses a higher screen resolution.
Does the PageSpeed Insights score matter for SEO?
The Performance score on PageSpeed Insights does not impact SEO directly. However, the real-user Core Web Vitals assessment does impact Google rankings.
Addressing the performance recommendations from Lighthouse should help improve your Core Web Vitals. Keep in mind that it takes 28 days for the real-user data to fully update after rolling out a change on your website.
You can see an example of that here based on DebugBear website performance monitoring. The Total Blocking Time indicates a CPU processing increase on a page, but the delay this causes to user interactions only becomes visible gradually.
How to pass Google's Core Web Vitals assessment
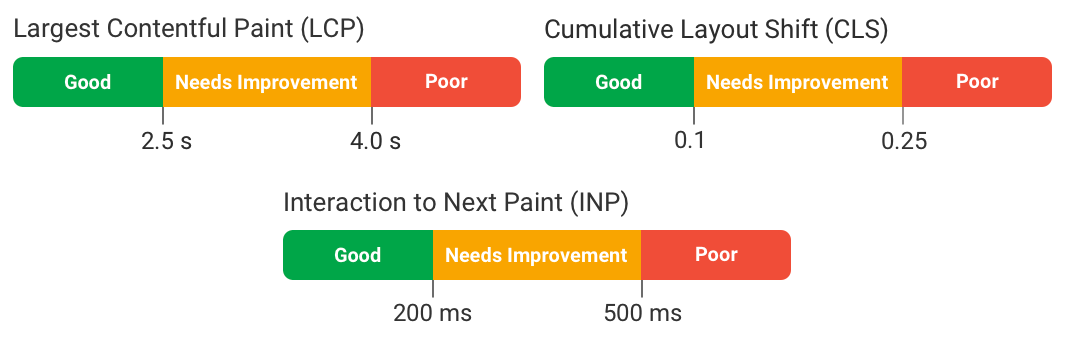
Google has defined maximum thresholds for each of the web vitals metrics to pass the Core Web Vitals assessment:
- A Largest Contentful Paint score below 2.5 seconds
- A Cumulative Layout Shift score below 0.1
- An Interaction to Next Paint score below 200 milliseconds
To pass the web vitals assessment, not every single visitor needs to have a good experience. Google looks at the 75th percentile of page visits, which means even if your website has an LCP score of 2.5 seconds, 25% of visitors will still be waiting longer than that for the page to render.
What is a good PageSpeed Insights Performance score?
A good Lighthouse Performance score is a score of 90 or higher. The highest possible score is 100.
For many websites this is hard to hit, and it's not necessary to get a score that high. Focus on real user Core Web Vitals instead.
However, even if you pass the Core Web Vitals assessment, some of your visitors might still have a poor experience. Continuing to optimize your performance can help fix issues for those visitors.
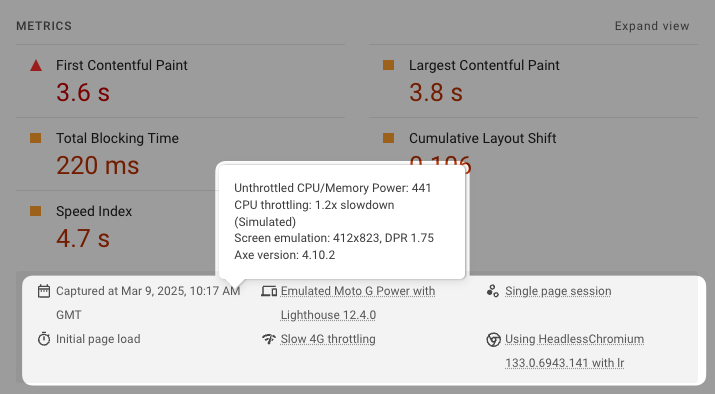
How to check PageSpeed Insights test settings
You can find the test settings that were used to run Lighthouse near the top of the diagnostics report.
For example, you can see:
- The size of the test device
- A rough CPU benchmark
- CPU and network throttling speed and throttling type
- The test server location, for example "Europe"
- What Chrome version was used to run the test
PageSpeed Insights server locations
Google runs tests from four different server locations. The location is selected based on the user's location, so a user in Greece might be assigned to the European server.
The four server locations are:
- Northwestern US (Oregon)
- Southeastern US (South Carolina)
- Northwestern Europe (Netherlands/Belgium)
- Asia (Taiwan)
Additional metrics reported by PageSpeed Insights
The CrUX report includes two additional diagnostic metrics:
- Time to First Byte: tells you how quickly the browser was able to start loading the document HTML
- First Contentful Paint: tells you how soon any page content was rendered (as opposed to the LCP which looks at the largest content element)
The lab data report also includes the Speed Index metric. It looks at the page rendering process as a whole and measures when most of the page content is visible.
Google also includes Largest Contentful Paint subparts as part of the CrUX report. PageSpeed Insights doesn't support surfacing this data yet, but you can view it in the DebugBear Core Web Vitals test.
How to increase your page speed score with diagnostic data
The Lighthouse report on PageSpeed Insights provides a number of specific performance recommendations to make your website faster, along with an estimate of potential savings.
Let's take a look at 7 common performance recommendations from PageSpeed Insights.
Improve image delivery
Optimizing image delivery is important as images are often the largest content element on a page.
What does improving image delivery consist of?
- Using modern image formats that result in smaller files at the same quality level
- Serving responsive images at an appropriate size, to avoid sending unnecessary data on devices with small low-resolution screens
- Picking an appropriate image quality to speed up downloads

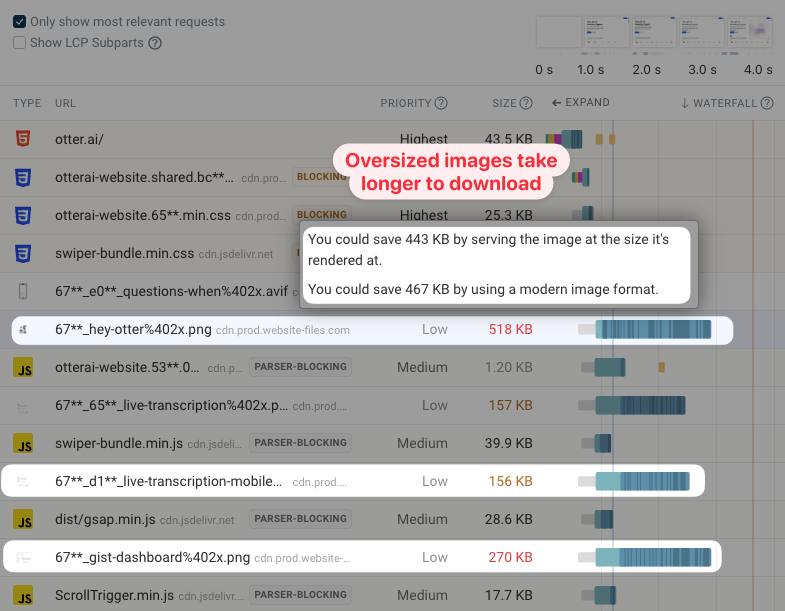
If you look at a request waterfall, you can see that the request duration can be very long for large images.
For example, in this screenshot we see a 518 kilobyte image. However, if we hover over the file size, we can see that using a modern format like WebP could reduce the download weight by 467 kilobytes.
Optimize LCP request discovery
LCP request discovery is all about making sure key images are discoverable from within the page HTML, are clearly marked as high-priority, and are not lazy loaded.
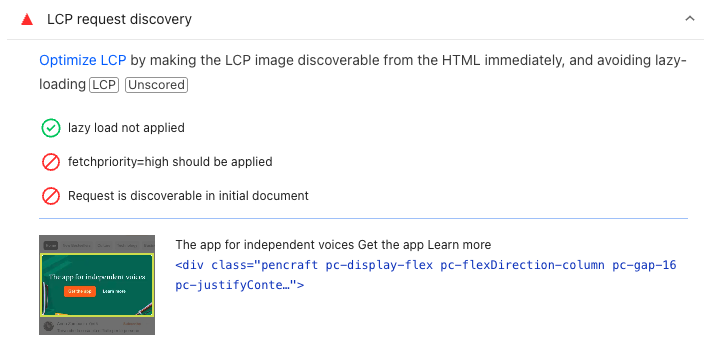
Here we can see that PageSpeed Insights has picked up on two issues:
- The image request is low priority, because the
fetchpriority="high"attribute wasn't applied - The request was not discoverable from the initial document
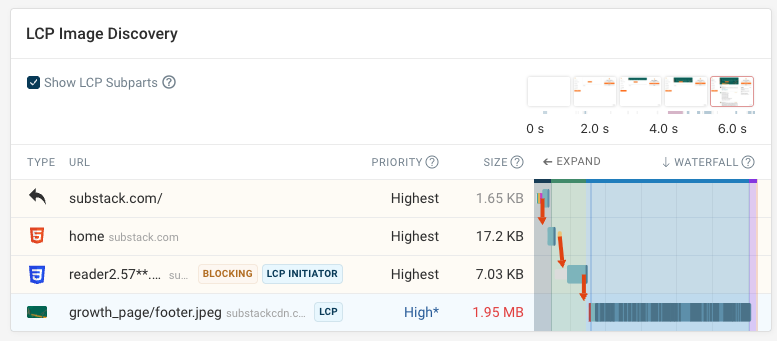
But what does that actually mean? The DebugBear page speed test result provides more information on how the LCP image request is discovered by the browser.
Here we can see that a CSS stylesheet is required before the browser finds out about the image file. Usually that's the case when the picture is used as a background image.
The asterisk next to the High priority tells us that the initial priority of the image was Low, until the browser realized based on the image position that it was in the viewport. Then the priority was updated.
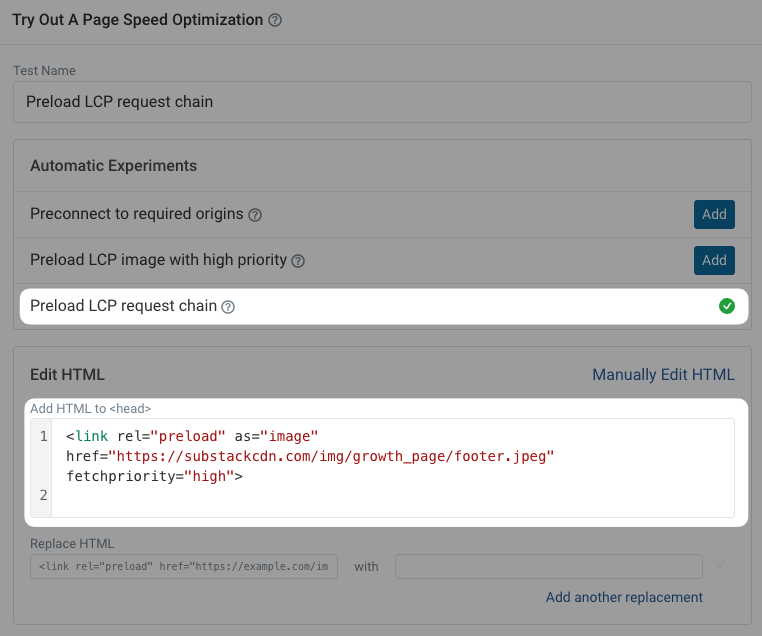
How can you fix this issue? DebugBear offers an automated experiment that shows an HTML change that will speed up loading this image. You can add a preload link tag with the fetchpriority="high" attribute, making sure the browser knows to load this image early.
<link
  rel="preload"
  as="image"
  href="https://substackcdn.com/img/growth_page/footer.jpeg"
  fetchpriority="high"
/>
The experiment lets you identify specific code changes you can make and measure their impact on page speed.
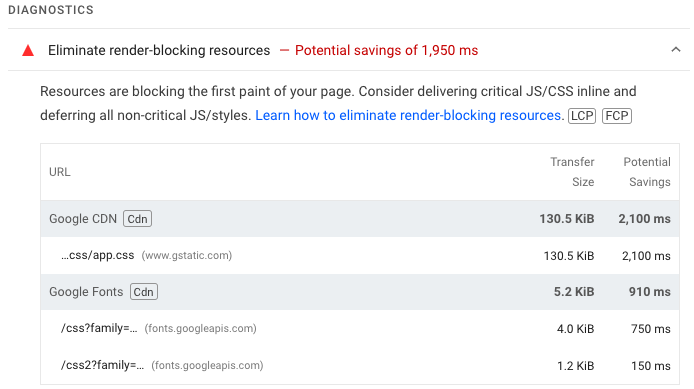
Eliminate render-blocking resources
Render-blocking resources are CSS stylesheets and JavaScript code files that need to be downloaded before the browser can display any page content.
You can expand this audit to see a list of render-blocking resources that delay rendering.
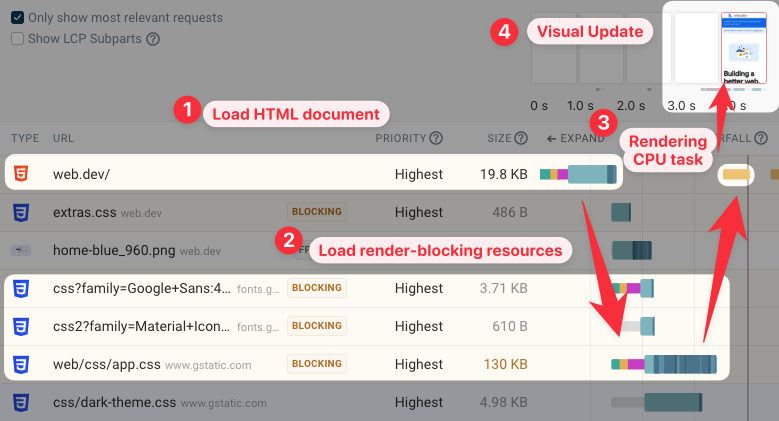
A good way to view the impact of render-blocking requests is to view the request waterfall on DebugBear.
It shows when different resources load, including render-blocking stylesheets. Once the stylesheets are loaded you can see that content appears on the page.
Reduce initial server response time
Slow server responses are a common reason for slow-loading websites. The rest of the page load process can't start until the document HTML is available.
Reduce initial server response time of the document HTML request to make the rest of your page start loading quickly.
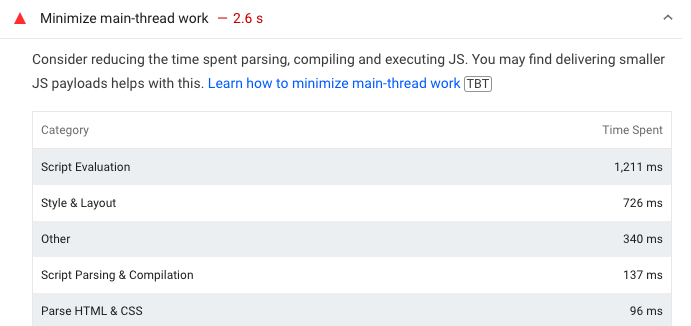
Minimize main-thread work
Main-thread work is a common reason for poor performance. It describes CPU processing tasks like JavaScript execution or layout calculations on the browser main thread.
Blocking the main thread will freeze the UI while the task is in progress. The fact that a task is taking a lot of time also often means that the page content that the code is responsible for will show up more slowly.
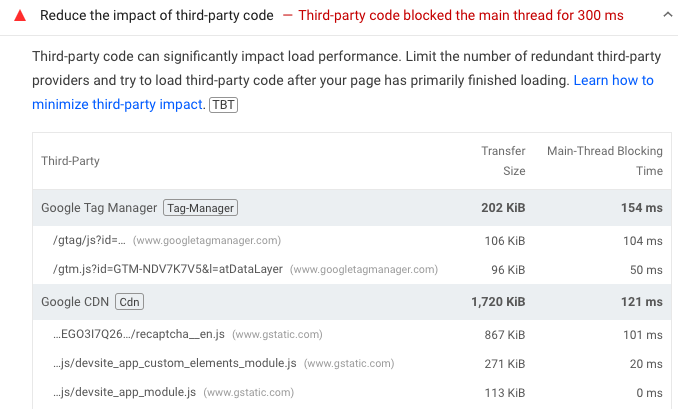
Reduce the impact of third-party code
One common cause of main thread processing is third-party code loaded on the website.
PageSpeed Insights shows you what third-parties cause large downloads or a lot of CPU activity. You can then check if these tools are really necessary and what you can do to mitigate their performance impact.
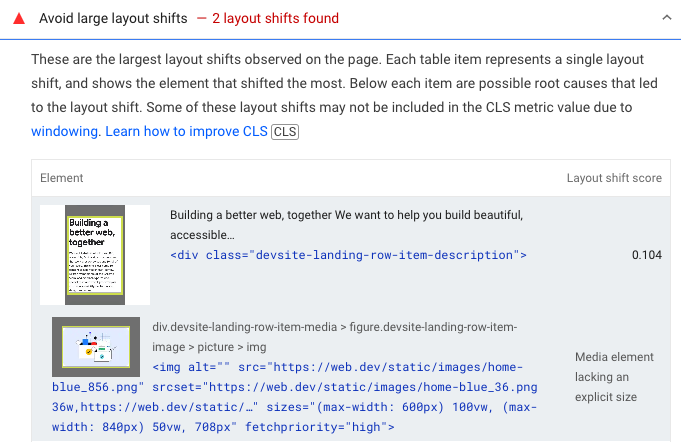
Avoid large layout shifts
Large layout shifts indicate a poor user experience. For example, a visitor might have started reading content that then moves around, or they could be trying to click one button but then accidentally click on the wrong one.
PageSpeed Insights shows you what page elements move around on the page. In some cases it also points out a potential cause, in this case a media element lacking an explicit size.
How to test SEO and Accessibility with PageSpeed Insights
In addition to the Performance score, PageSpeed Insights also provides a rating for accessibility and on-page SEO. You can also use our dedicated website SEO checker for a focused SEO audit.
For example, Lighthouse detects when insufficient contrast between text and background colors makes content hard to read.
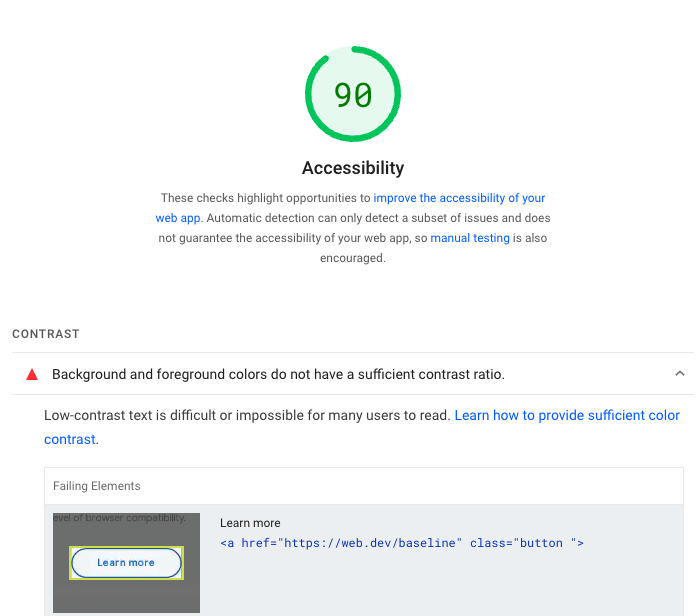
The Lighthouse Accessibility and SEO audits only check your website for a few common issues, but don't guarantee that your website is accessible and crawlable.
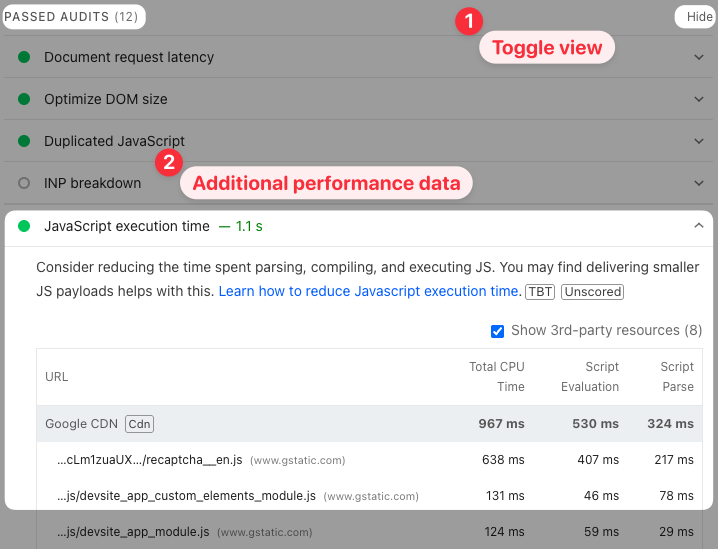
Viewing passed audits
By default, PageSpeed Insights shows just the audits where there's clear optimization potential with high expected impact. You can toggle "Passed audits" to see where you're doing well or where there is additional optimization potential, even if the problems aren't big enough to fail the audit.
For example, here the JavaScript execution time audit passes, but there are still some scripts that cause over a second of CPU activity during the page load process.
Accessing page speed data through the API
In addition to running tests manually on Google's website, you can also use the PageSpeed Insights API to collect page speed data programmatically.
Just generate an API key and access page speed reports in JSON format.
Continuous page speed monitoring and optimization
Monitoring your page speed data over time lets you see if your optimizations are working and detect any issues when they come up.
DebugBear is a page speed monitoring tool with a focus on Core Web Vitals metrics. It combines three types of data in one tool:
- Google CrUX data
- Lab-based testing
- Real user monitoring (RUM)
Sign up for a free trial and start running regular page speed tests.
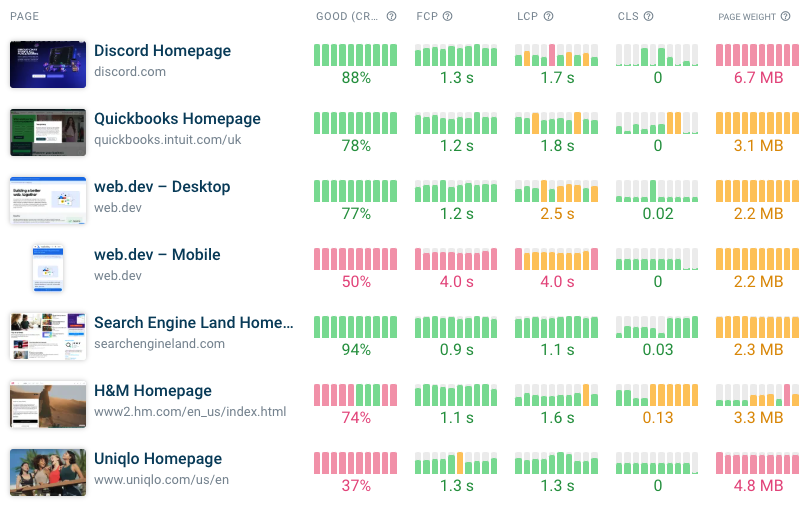
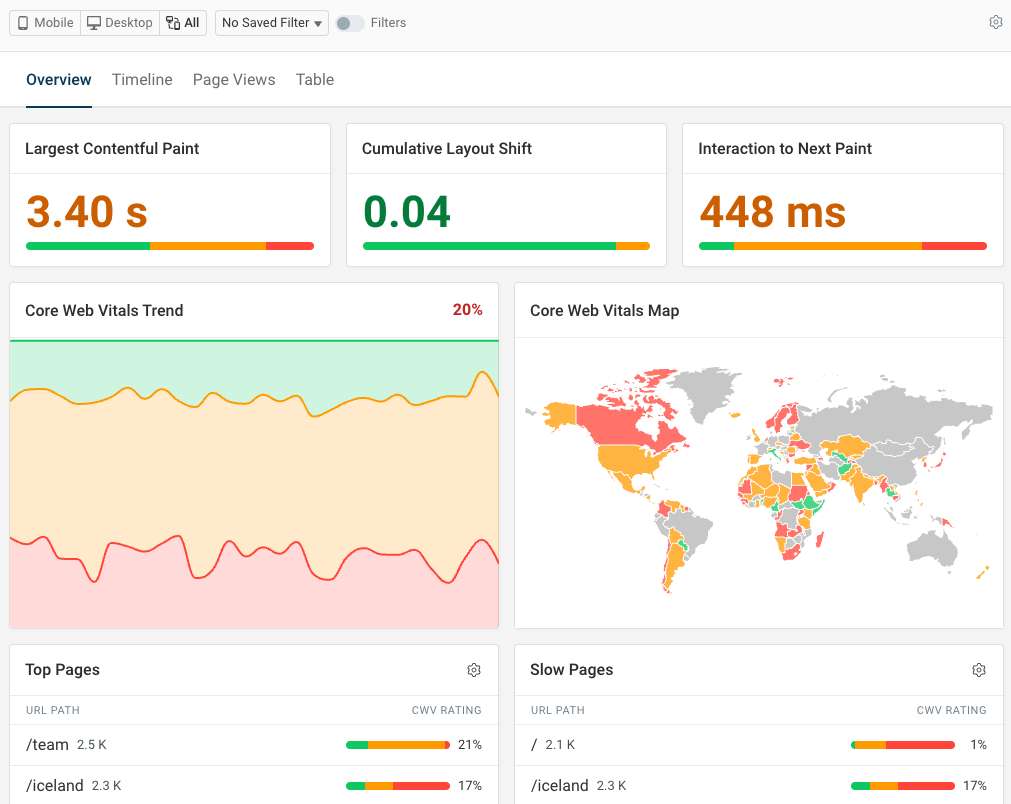
Real-user monitoring (RUM) can give you detailed insights into how different visitor segments experience page speed across your website. Unlike Google's CrUX data that's aggregated over 28 days, RUM analytics provide real-time data on your web performance.
RUM data is also available even for low-traffic pages. That makes it great for identifying what parts of your website you need to optimize.
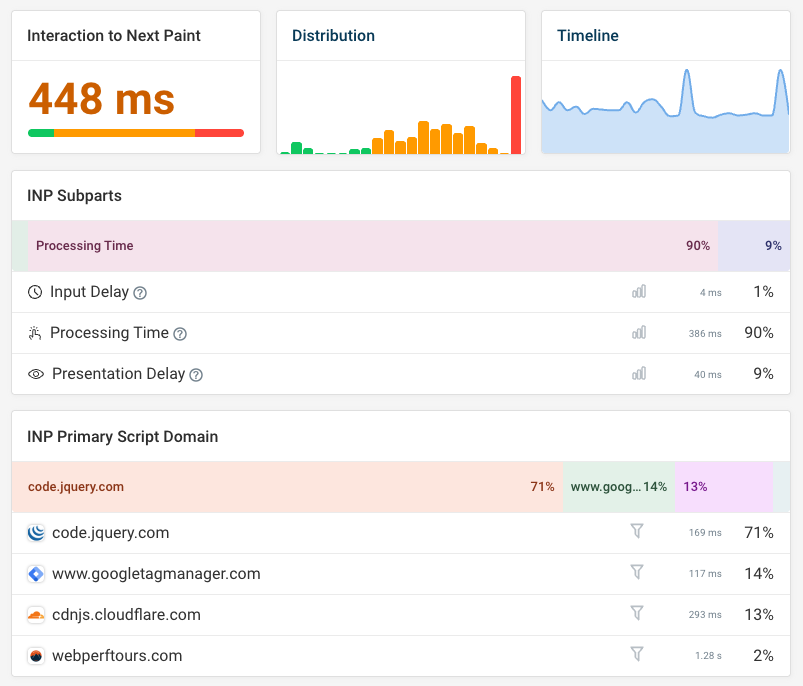
You also need real user data to effectively debug performance metrics that depend on user interactions.
For example, to fix slow Interaction to Next Paint scores, you need to know what page elements are unresponsive and what code is slowing them down. DebugBear's detailed debug data for INP provides this info as well as additional information on what's impacting user experience.


Monitor Page Speed & Core Web Vitals
DebugBear monitoring includes:
- In-depth Page Speed Reports
- Automated Recommendations
- Real User Analytics Data