
Most websites rely on third-party scripts in some way. While they are easy to add, third-party code often has a negative impact on page performance.
In this article we explain what third-party code is, how you can identify it on your website, and what you can do to fix performance issues caused by third parties.
What are third-party scripts?
You're a website operator and a visitor comes to your website. Those are the first two parties. But then additional code is often loaded from other domains, for example analytics services, support widget providers, or ad networks. These are third-party services.
Third parties provide functionality that the website operator hasn't implemented themselves.
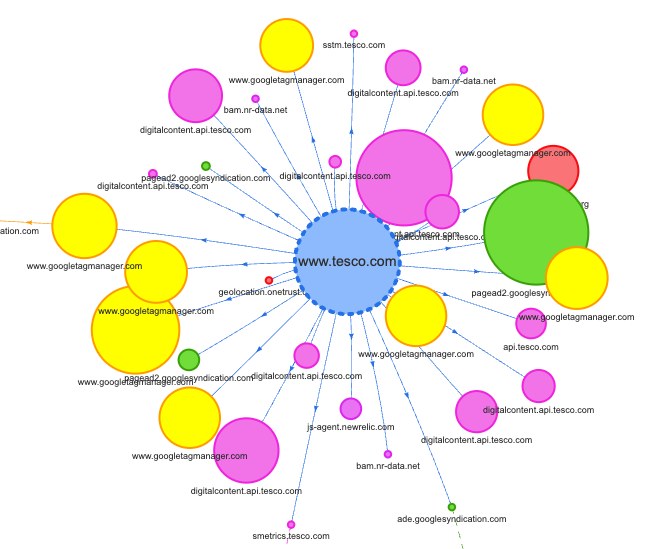
Simon Hearne's Request Map tool provides a nice visualization of how a website fetches resources from different domains when it loads.
How does third-party code impact website performance?
In general, loading more resources will cause pages to load and render more slowly. For example:
- Early third-party requests compete for bandwidth with first-party content
- Third-party code blocks the browser main thread when it runs
- Render-blocking third-party requests prevent all page content from being displayed
- Late-loading third-party code can cause poor performance if it's responsible for important content
Here's a DevTools performance recording that shows CPU processing caused by third-party scripts when loading a website.
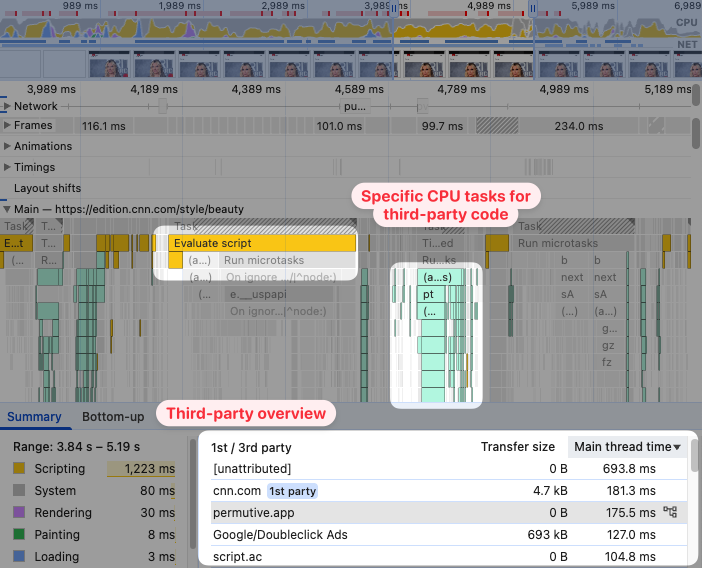
Chrome recently improved their developer tools to make it easier to identify of filter out third-party scripts.
How to identify third-party code that impacts performance
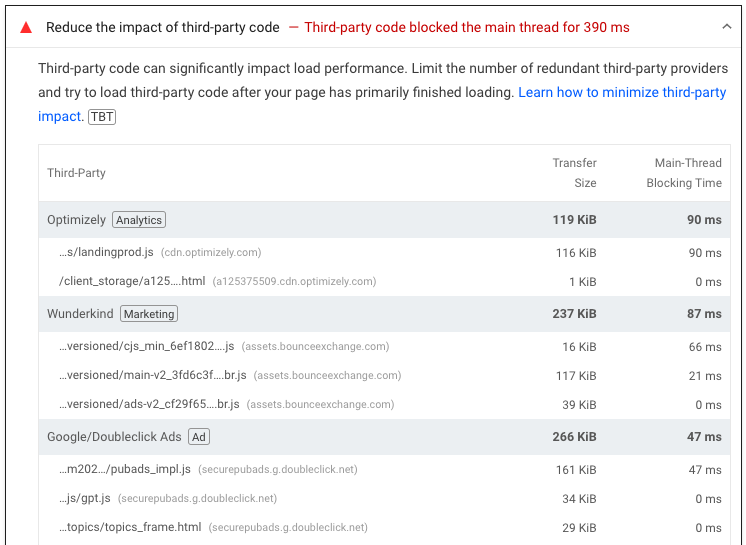
Google's Lighthouse tool, which is what also powers the PageSpeed Insights diagnostic data, has an audit that identifies third-party scripts that impact page speed. You can find the audit in the Performance section of the Lighthouse report.
Next to the title the audit tells you how long third-party code blocked the main thread, in this case 390 milliseconds. While the main thread is blocked, other scripting or rendering tasks can't be processed. User interactions also can't be processed.
Third-party reported in DebugBear
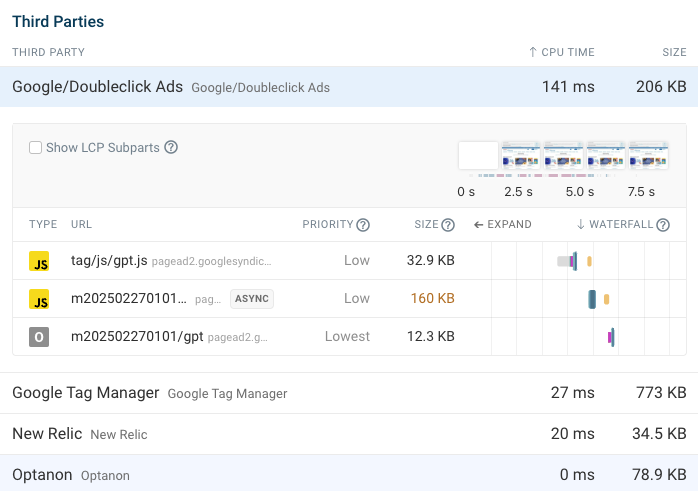
If you run a test with the free DebugBear page speed test you can find third-party performance reporting at the bottom of the Requests tab.
This will show you the total CPU time for the third-party as well as the total download size. Click on the third-party entry to view all related network requests.
If you have continuous synthetic website monitoring set up you can also see third-party page weight, CPU tasks, and third-party provider count tracked over time.
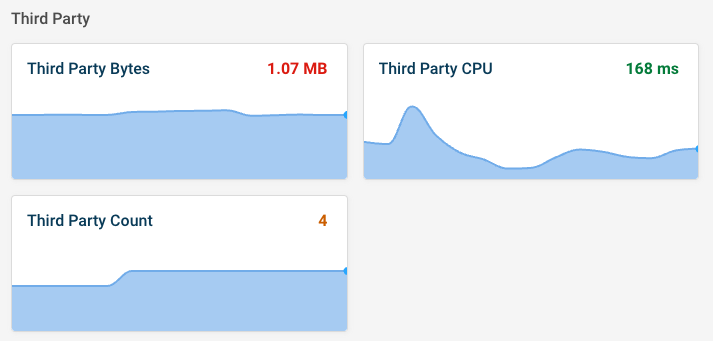
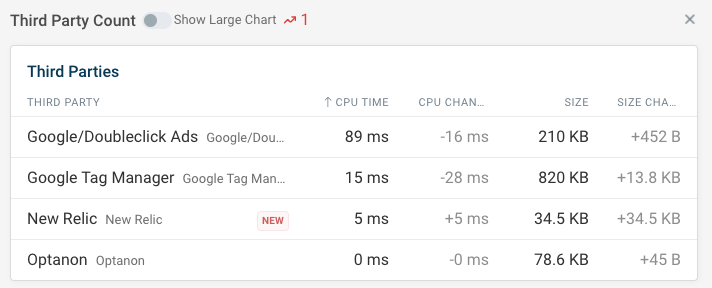
When one of the metrics changes you can click on it to see what changed.
For example, in the test result below New Relic was added as a new third-party resource.
How to reduce third-party impact
You can take these steps to prevent third parties from slowing down your website:
- Limit the number of third-party providers Load third parties after the main page content has loaded
- Adjust your third-party configuration
- Contact third-party support
- Load scripts through Partytown
Limit the number of third-party providers
Many websites load third-party code long after it's needed, or load it across the entire website rather than just where necessary.
Review the third-party code in your HTML and your tag manager. Eliminating a third-party entirely is the most impactful optimization you can make.
Load third-parties after the main page content has loaded
User experience is most impacted when browsers are busy loading third-party resources instead of rendering the actual page content.
Where possible, delay loading third-party code until after the page has finished rendering.
If third-party services insert content on your page you may need to take additional steps to avoid large layout shifts.
Adjust your third-party configuration
It's easy to blame third-party services for poor performance. But sometimes poor performance is due to how you've set up the integration.
For example, if you're running 200 A/B tests and marketing experiments at once then applying all those page updates will take a long time.
Contact third-party support
If you're able to identify a performance issue that's caused by another company, contact their support team to ask about it. They may be able to investigate and resolve the issue with no changes required from your side.
Load scripts through Partytown
Partytown is a JavaScript library that allows you to run third-party scripts in a web worker instead of on the main thread. This frees up the main thread to render important page content and handle user interactions.
Note that your third-party code can become less performant as a result. However, this is largely by design, as your primary page content and application logic is prioritized.
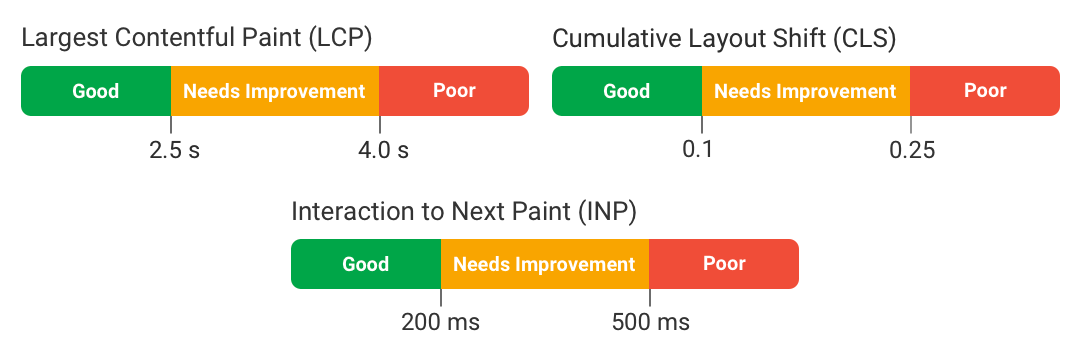
How do third parties impact Google Core Web Vitals?
Third-party code can impact all three Core Web Vitals metrics, and as a result your website rankings in Google.
Largest Contentful Paint
There are two ways that third-party code can cause worse LCP scores:
- By causing important page resources to download and render more slowly
- By being slow to load themselves, if your primary page content is inserted by a third-party script
Cumulative Layout Shift
Third parties often cause layout shift, especially in the case of ad banners. When content is inserted into the existing page, content below the new banner shifts down.
Try to provide placeholder containers where third-party code can insert content without affecting the rest of the page layout.
Interaction to Next Paint
If code runs on the main thread it can delay INP interactions. Often this is especially bad during the initial page load: the main page content has mostly rendered, causing the user to start interacting with it. But, in the background, third parties are still blocking the main thread, so any interaction handling will be delayed.
How to view third-party performance impact in real user data
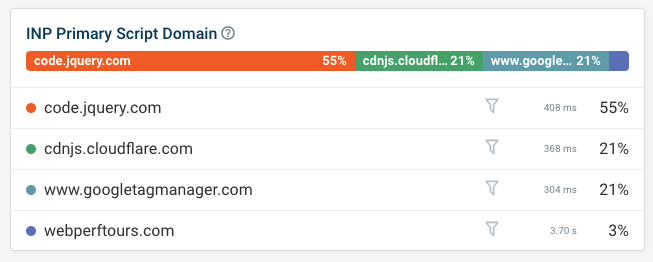
DebugBear real-user monitoring can help you identify third-party code that is causing poor performance and interaction delays.
For example, you can see what script domains most commonly are responsible for poor INP scores.
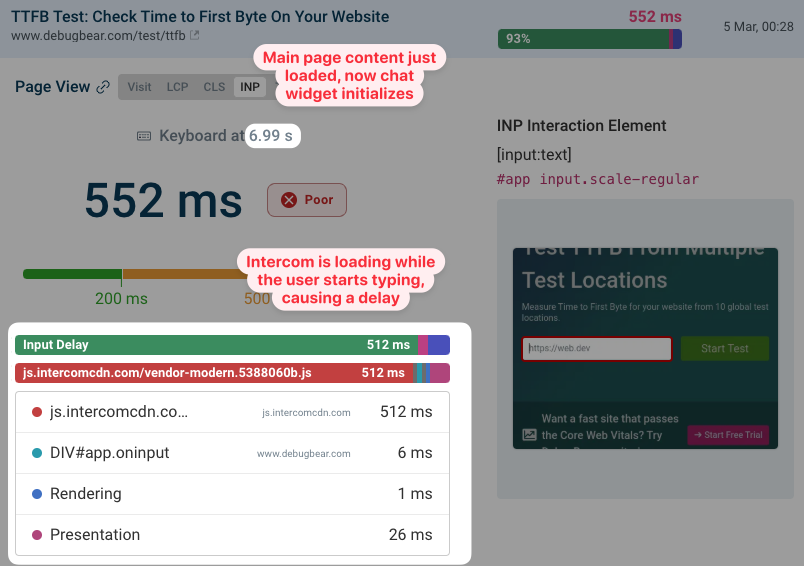
You can also inspect specific visits to your website to see why a visitor had a poor experience.
In the example below, the page rendered and the user started typing into a text field. However, as they were doing that the Intercom chat widget loaded, preventing their interactions from being processed quickly.


Monitor Page Speed & Core Web Vitals
DebugBear monitoring includes:
- In-depth Page Speed Reports
- Automated Recommendations
- Real User Analytics Data