Page weight is one of many metrics used to measure the performance of a website. It looks at how much data needs to be downloaded after opening a page.
This article looks at what factors contribute to high page weight, how you can optimize it, and what it means for SEO and page speed.
What is page weight or page size?
The download size of a web page states how many bytes of data need to be transferred over the network in order to load a website in the browser. Downloading more data means that the page takes longer to load for the visitor.
Network connections with more bandwidth can transfer more data in less time. A fast wifi connection might be able to load even a large website quickly, while loading the same page on a mobile 3G connection might take a long time.
This request waterfall chart shows an example of a website loading several different resources before starting to render.
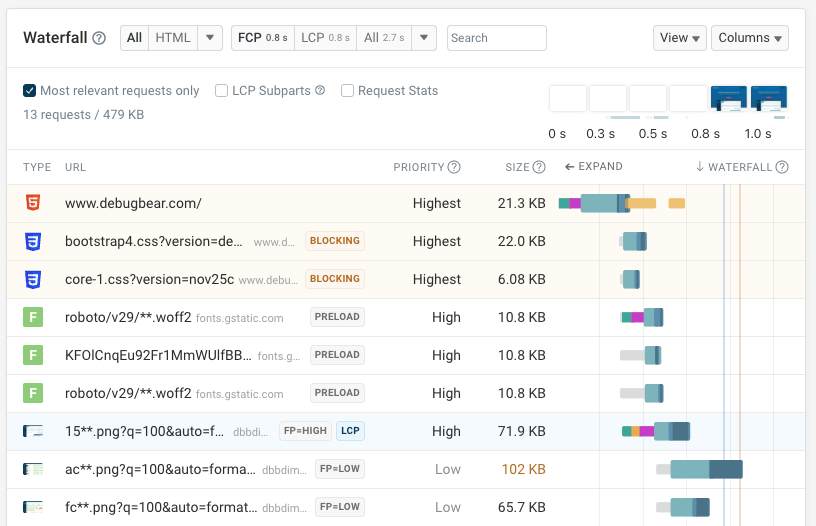
Common types of resources are HTML document, JavaScript application files, CSS stylesheets, images, and data files (for example JSON data).
What’s the average size of a web page?
According to the HTTP Archive, the average website loads 2.3 megabytes of data when opening a desktop site, split across 71 HTTP requests.
On mobile websites on average 2.1 megabytes of data are downloaded.
Both numbers are increasing. Five years ago, in 2018, the average desktop site weighed in at just 1.7 megabytes, and in 2013 the average was 0.9 megabytes.
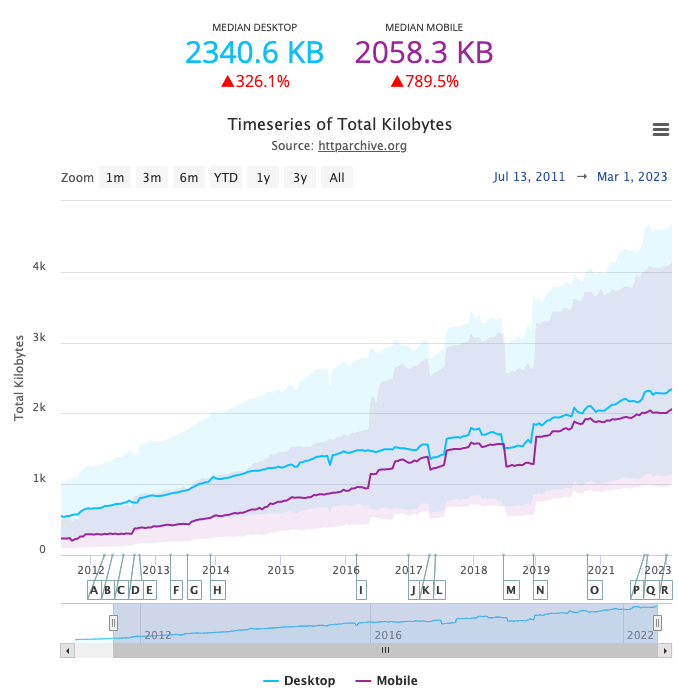
We can also see that there's a trend of mobile sites becoming more similar in page weight to desktop sites.
What type of website resource contributes the most to page size?
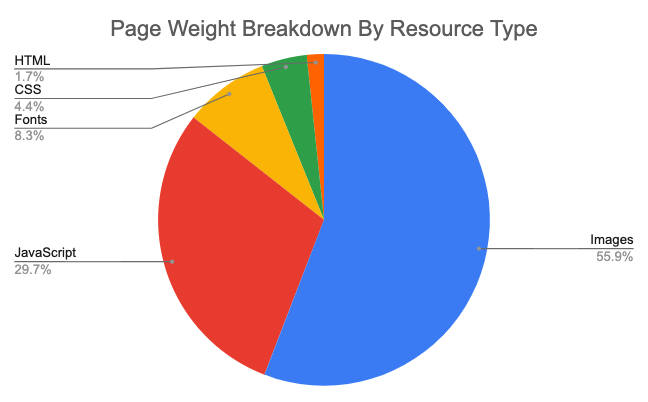
Images contribute the most to overall page size, with almost one megabyte per page. An average web page also downloads half a megabyte of JavaScript code.
Check page weight contributions for your own website
You can check page weight contributions for your website using the free DebugBear website speed test. The Requests tab shows both the request count and page weight by resource type.
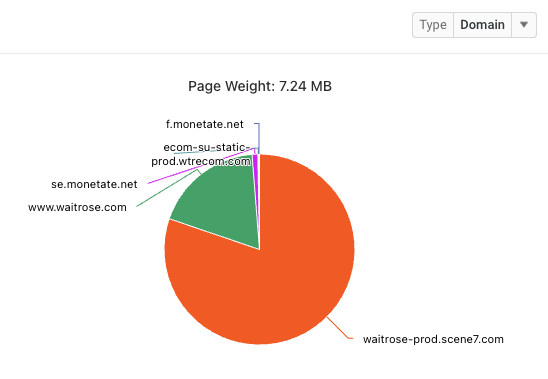
The website in this example loads many images, and image content accounts for over 80% of the overall page weight.
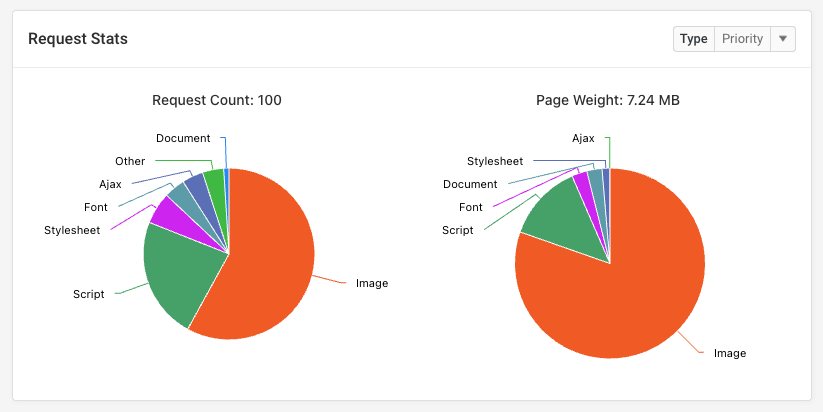
Use the dropdown menu to select a different grouping, like domain name or request priority.
What is a good web page size?
The size of different resources doesn’t impact page speed equally, so even a small site can be slow and a large site can be fast. However, as a general guideline, you can aim to load no more than 2 megabytes of data on each page.
A small page has a size of less than 100 kilobytes and will be very fast to download even on slower connections.
How does page weight impact site speed?
If a page loads more data it will generally load more slowly than a smaller website. However, different categories of resources will have a different impact on page performance:
- Render-blocking resources need to load before any page content starts showing up and they should be kept as small as possible
- Images and most JavaScript code are less critical and if they take a bit longer to load due to their size that’s often acceptable
- Secondary page elements like chat widgets can be loaded after the main page content without having a big impact on user experience
- Prefetched resources increase page size, but they are downloaded for future use and don't impact page experience immediately
Whether download size impacts performance mostly depends on whether the resource is render-blocking or is necessary for above-the-fold content like images that are responsible for the Largest Contentful Paint.
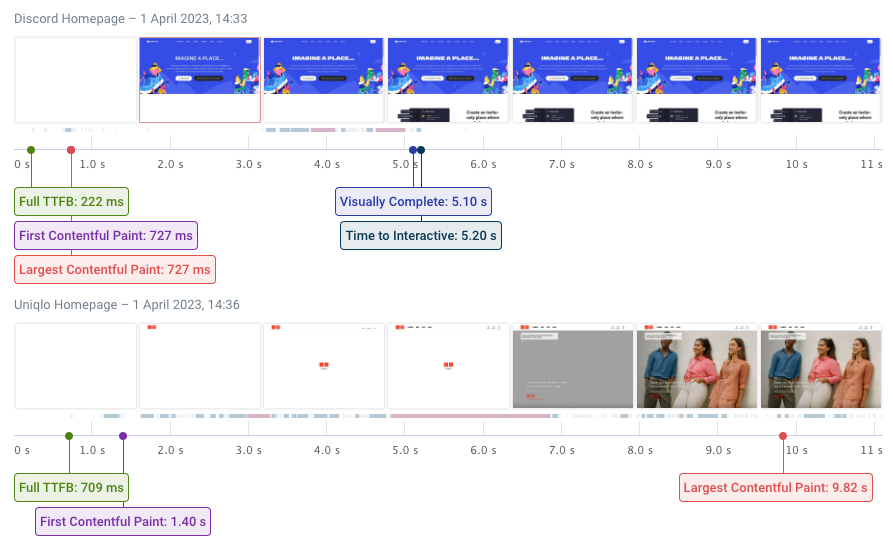
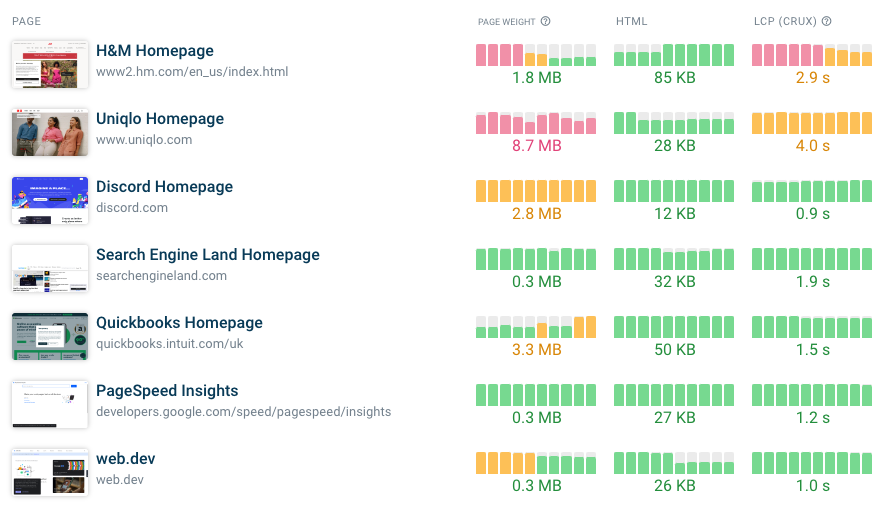
Take a look at these two rendering filmstrips as an example of the performance impact of page weight. Opening the Discord homepage downloads 2.7 megabytes of data, compared to 8.7 megabytes for the Uniqlo homepage.
While page weight is not the only thing that determines how fast a website loads, it is one important factor.
How do I reduce the page weight of my website?
To reduce the download size of your website you can:
- Optimize your images and use modern image formats
- Reduce third-party code
- Use facades for video embeds or chat widgets, only loading the full code when needed
- Lazy load images below the fold
- Use gzip and brotli compression
- Use responsive images to load device-appropriate versions of an image
To get the best impact on performance you should also focus your optimizations on the most important resources on a page.
Example: Large HTML and JavaScript size
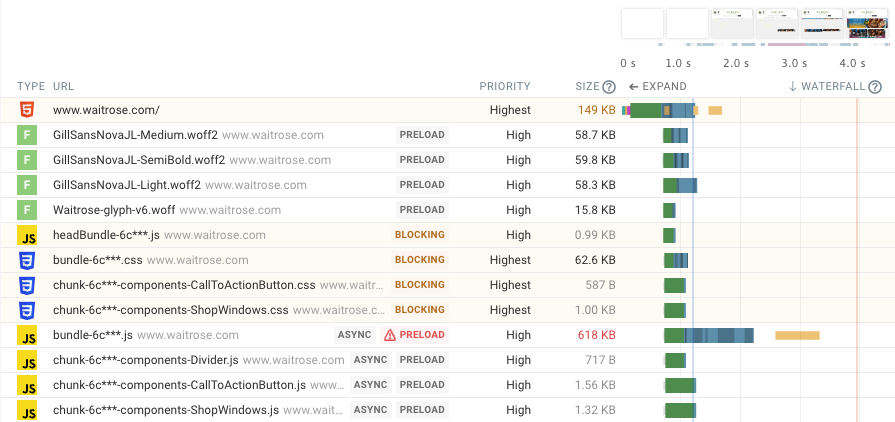
Let’s take a look at the request waterfall below to analyze how page weight impacts website speed. The waterfall only shows the first few requests, which are most important for user experience.
We can see two large requests:
- The HTML document (149 kilobytes)
- A JavaScript bundle file (618 kilobytes)
The request bar in the waterfall chart on the right is longer than those of other requests. That shows that larger files take longer to download. (Although the high Time to First Byte of the HTML document also contributes to the overall request duration.)
We can also see 4 font requests (the woff2 files). Although each one accounts for just 50 kilobytes they together make up 189 kilobytes of data.
Some page content starts to appear as soon as the HTML document has finished loading, but the full page only loads after the JavaScript code has been loaded and run.
What could be done here to optimize page size?
- Reduce the size of the HTML document
- Reduce the size of the JavaScript bundle
- Load fewer web fonts
Alternatively, the preload for the fonts could be removed, allowing bandwidth to be used for more important resources early on. Currently the font download competes with downloading the more important HTML document, slowing down rendering.
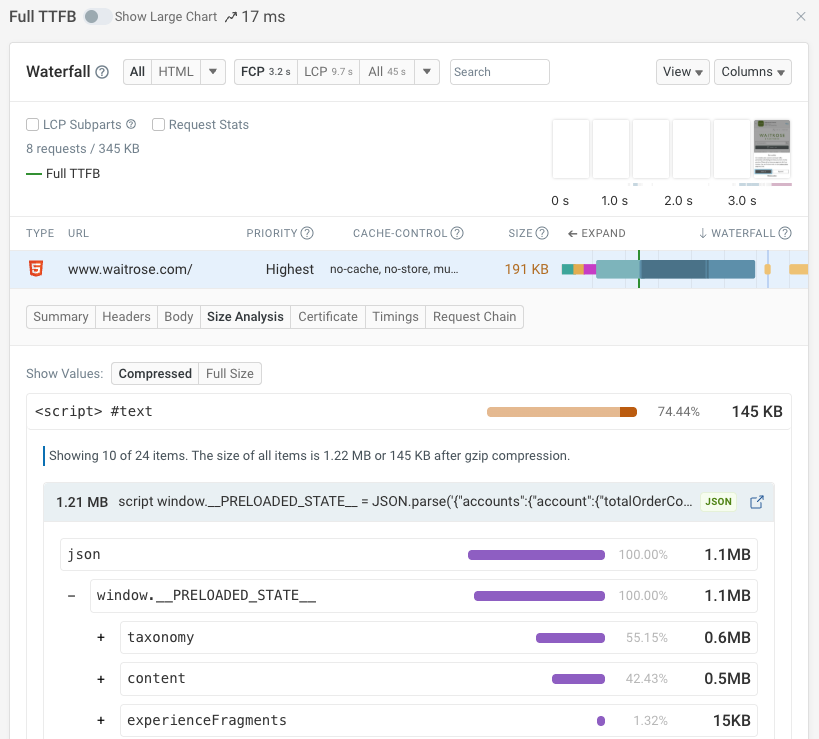
A tool like the HTML Size Analyzer can be used to break down the HTML document size and identify how it could be optimized. In this case the HTML contains a lot of JSON data, rather than mostly consisting of HTML code.
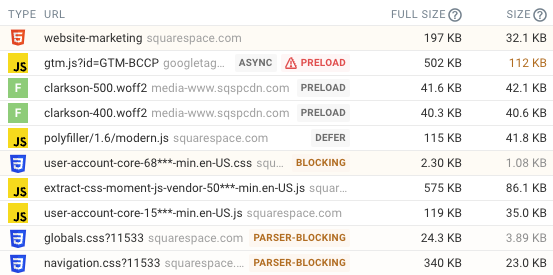
We can also sort the requests by size to see the biggest contributors to overall page weight.
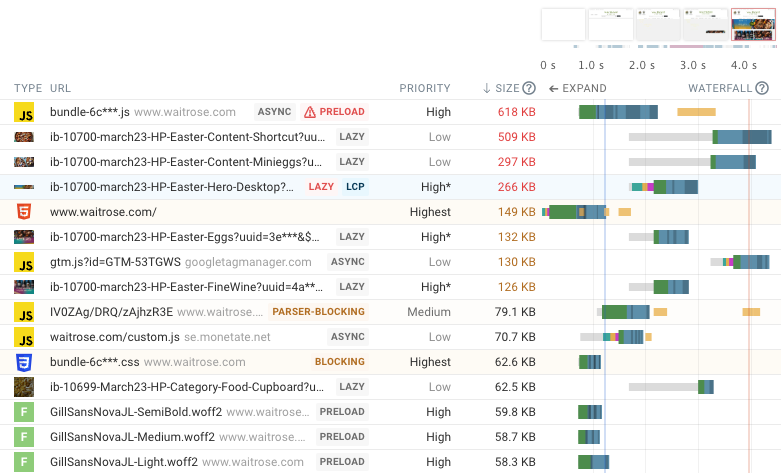
This shows us that large images account for a lot of data being downloaded. However, in this case we can see that the Largest Contentful Paint image (marked by the LCP badge) finished loading long before the Largest Contentful Paint occurs (marked by the red line). That means that the image download isn’t holding back rendering, rather the JavaScript code is.
The waterfall also shows various low priority requests, for example for Google Tag Manager (GTM). In the case of GTM its contribution to page weight does not have a significant performance impact as the request is made fairly late (3.2 seconds after opening the page).
How do I measure the page weight of my website?
You can use free tools like these to view the page size of a URL:
- DebugBear Website Speed Test
- Google’s PageSpeed Insights
- The Network tab in Chrome DevTools
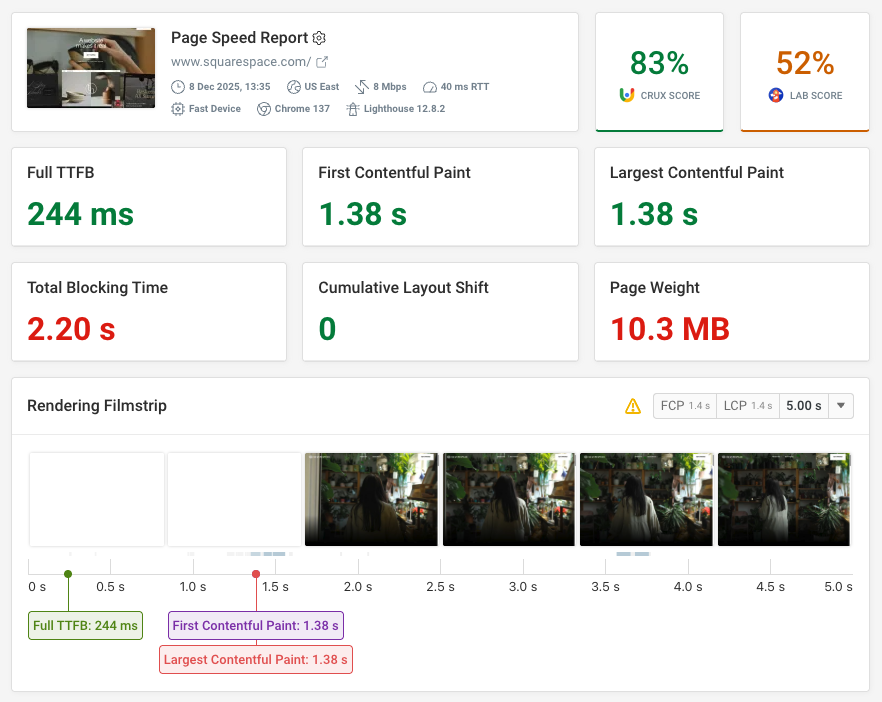
Page weight in the DebugBear Speed Test
After running a test the download size of your website is one of the 8 metrics shown near the top of the test result.
Page weight in PageSpeed Insights
In Google’s Lighthouse and PageSpeed Insights tools you can find the page weight in the performance diagnostics section under the “Keep requests counts low and transfer sizes small” audit.
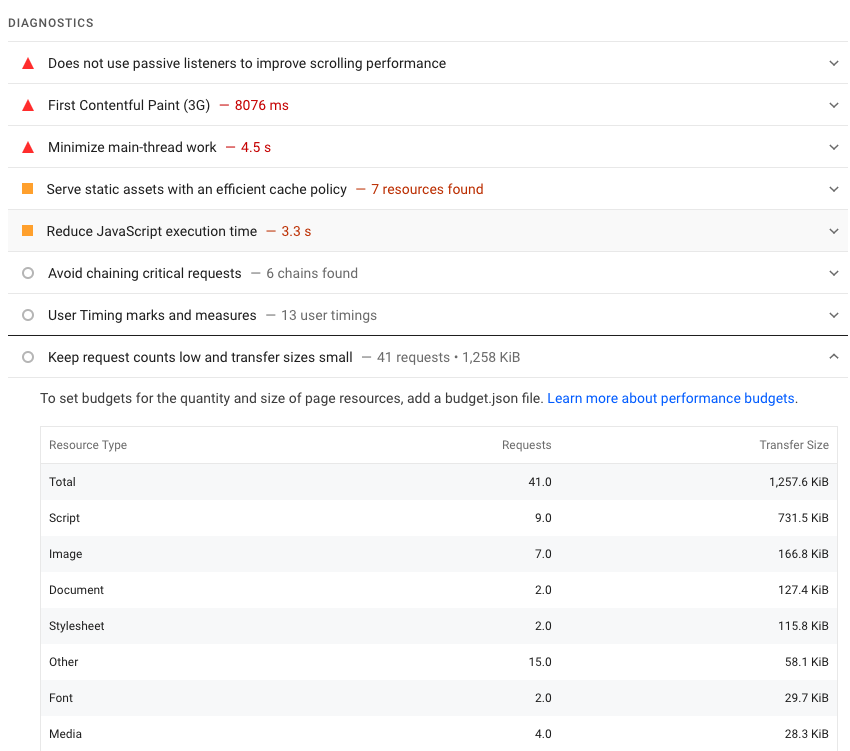
When a lot of data is loaded Lighthouse also shows a failing Avoid enormous network payloads audit.
Page weight in Chrome Devtools
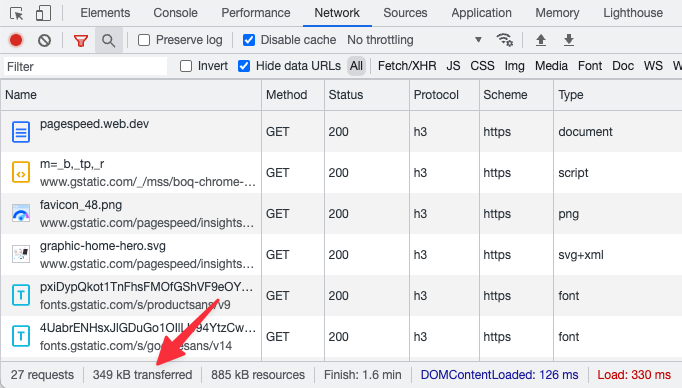
The DevTools Network tab in Chrome shows the size of the current page in the bottom left corner. To see how much data a new visitor would download you should disable the Preserve Log option and enable Disable cache.
Note that the page weight in DevTools may also include resources loaded by Chrome extensions.
Full resource size versus transferred size
Servers use HTTP compression when sending resources to the browser, so tools will often report both a full resource size and a compressed size.
You usually want to look at the compressed size, as this states how much data was downloaded over the network and determines how long the download takes.
Does page weight impact SEO?
Google does not use page weight as a direct ranking signal, but high page size can negatively impact page speed and the Core Web Vitals metrics which are used as a ranking factor.
The ranking data is based on the real-user data Google collects as part of the Chrome User Experience Report, so you can focus directly on user experience rather than page weight.
Monitor page weight and Core Web Vitals over time
DebugBear continuously tests the performance of your website, showing you how page size and other performance metrics change over time.
You also get in-depth test results with recommendations for how to speed up your website.
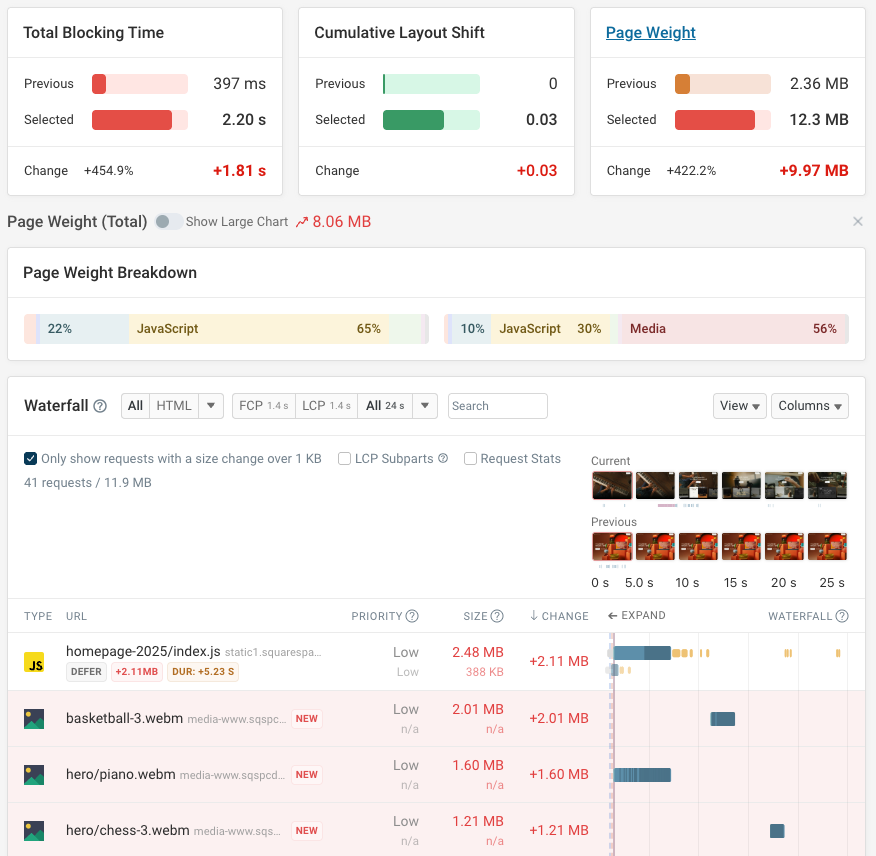
When page weight goes up you'll get alerted and can see what files caused the change.
Here a JavaScript bundle file increased in size, and new WebM video files were introduced.
Start a free 14-day trial today and optimize the speed of your website with synthetic website monitoring and real user monitoring to fix page speed and Google Core Web Vitals.


Monitor Page Speed & Core Web Vitals
DebugBear monitoring includes:
- In-depth Page Speed Reports
- Automated Recommendations
- Real User Analytics Data
