In this article, we'll explore the impact of unused CSS on website performance. Excess CSS increases file size and processing time. By identifying and reducing unused CSS, you can enhance your site's performance and provide a smoother browsing experience for your visitors.
How does CSS impact website speed?
CSS requests play a key role in how a page loads and displays. The following steps occur when the page loads:
- Download: The first step is to fetch the CSS files specified in the HTML document. The CSS files are specified using
<link>tags or with<style>tags embedded in the HTML. This adds extra requests and page weight to the page load. - Apply styles: The browser processes the CSS rules and applies them to the Document Object Model (DOM) created from the HTML. This step determines the styles for each element on the page.
- Rendering the page: After applying the styles, the browser paints the elements onto the screen for display.
To ensure an efficient process, the CSS files should be optimized. Larger CSS files containing unused CSS may slow down rendering.
CSS is generally render-blocking, meaning that content cannot be rendered on the page before the request is complete.
Any render-blocking scripts are identified with a badge in the DebugBear request waterfall. The First Contentful Paint (FCP) milestone is marked with a blue vertical line. The page can only render once all render-blocking requests have completed. This demonstrates the importance of optimizing render-blocking scripts, including CSS.

What is unused CSS?
Unused CSS refers to styles in a stylesheet that are not applied to any elements on a webpage during the page render. CSS that's not used on the page increases the size of the stylesheet unnecessarily, leading to slower load times and impacting user experience. Optimized CSS files that don't contain unused CSS should render the page sooner due to smaller file sizes.
How to identify unused CSS
Now that we understand the impact of unused CSS on page rendering, let’s review some of the best tools to identify unused CSS.
CSS code coverage in Chrome DevTools
You can check how much unused CSS there is in a page with Chrome DevTools Coverage feature.
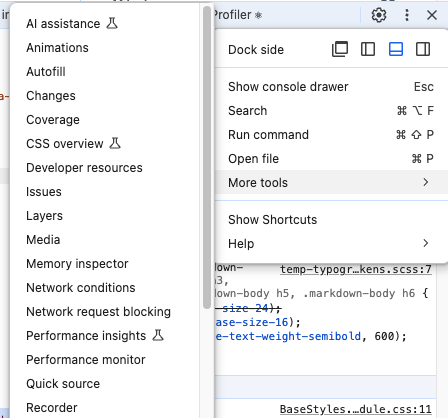
First open the Coverage tab:
- Click the three dots at the top right of Chrome DevTools
- Select More tools
- Open Coverage
Then click the record button to reload the page while Chrome tracks which styles are used to render the page contents.
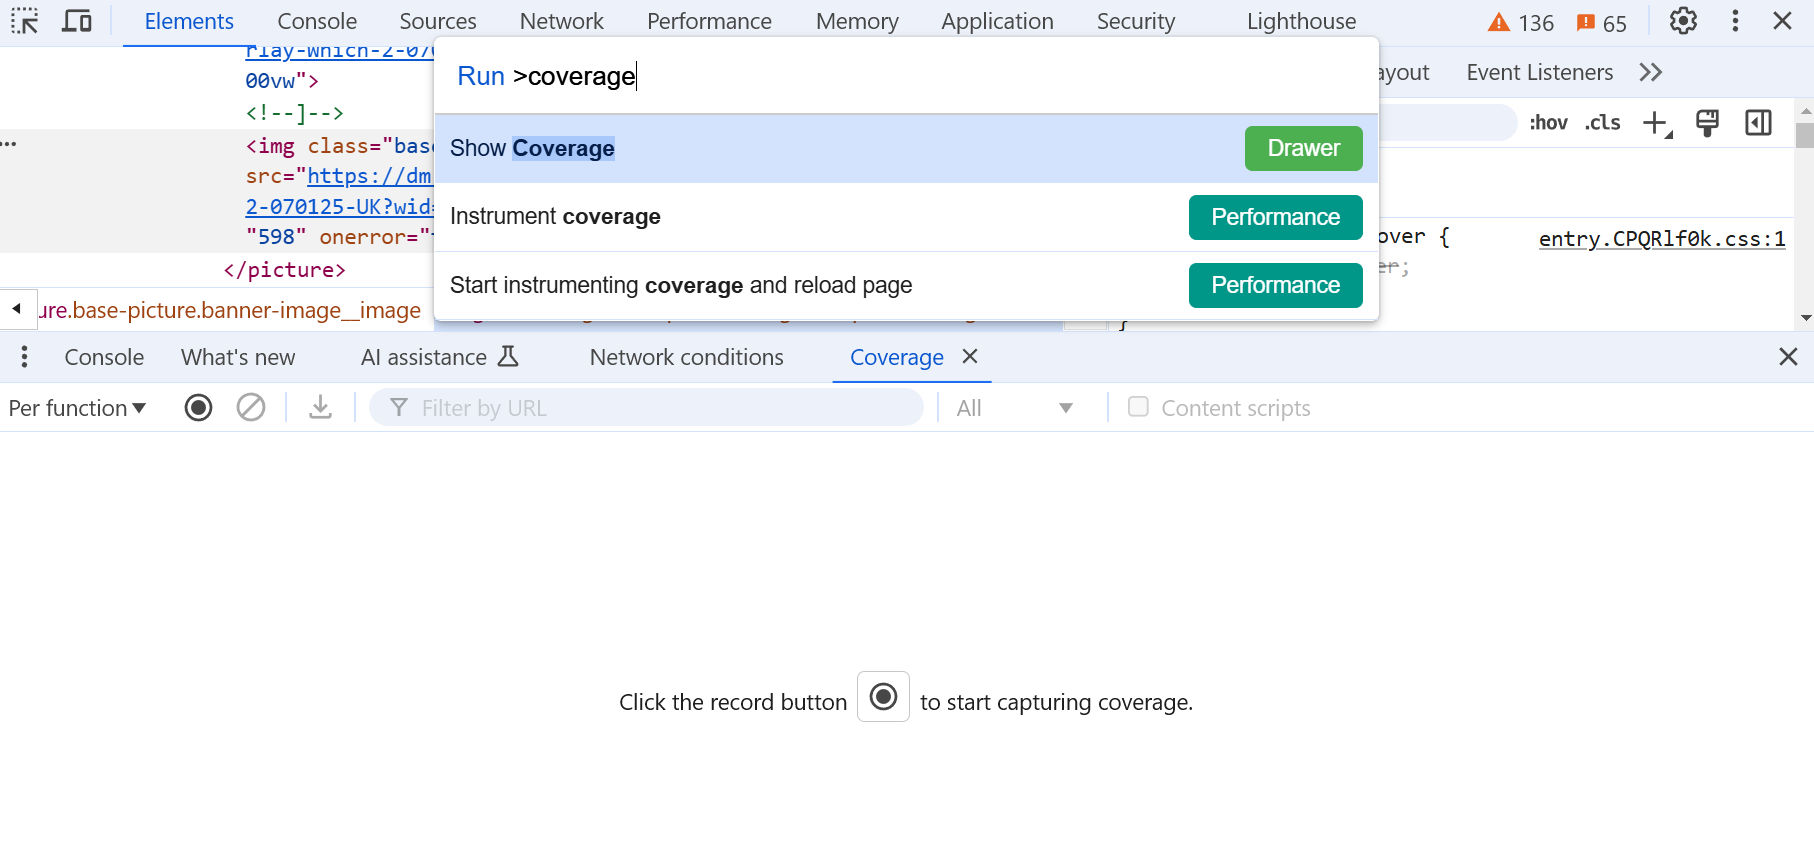
After recording, the coverage table can be ordered by Type, Total bytes and Unused bytes. In this recording we can see there is a lot of unused CSS in almost every file. The unused CSS is represented by the red visualization.

Clicking a CSS file will show you the contents of the stylesheet with any unused CSS selector highlighted in red.

Lighthouse audit: reduce unused CSS
A CSS analysis can be found as one of the many audits included in a Lighthouse test result. We can see this analysis in the Reduce unused CSS section.
The stylesheets are identified with their transfer size and potential savings, as well as a total for the potential savings for the page.
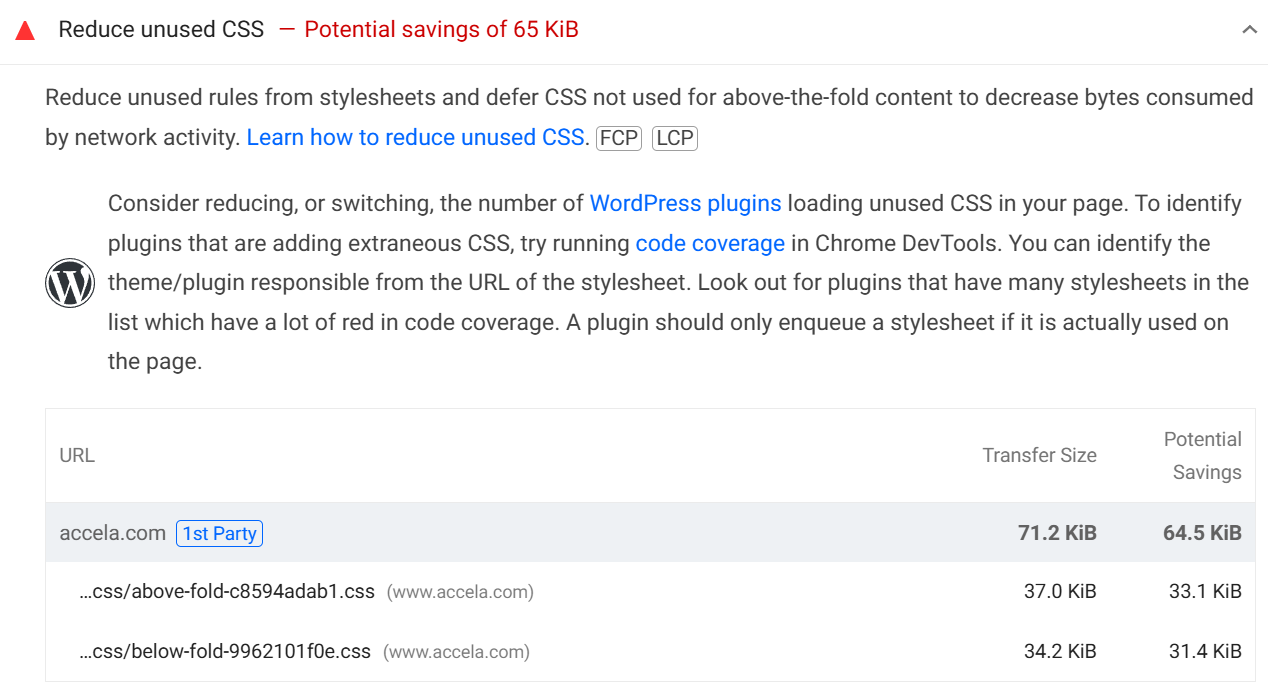
Lighthouse explains the impact of large CSS files:
Reduce unused rules from stylesheets and defer CSS not used for above-the-fold content to decrease bytes consumed by network activity.
Extra information and resources are included for you to make optimizations. These recommendations are based on your website's platform or framework. In the previous example, we saw some recommendations for a WordPress website.
Other specific recommendations and resources are available for Next.js, Drupal, and React.

The Unused CSS website
Unused CSS is a free tool providing analysis of all stylesheets of a page that detects the percentage of unused CSS.
Enter the URL of the page into the input bar. Then click Remove Unused CSS.
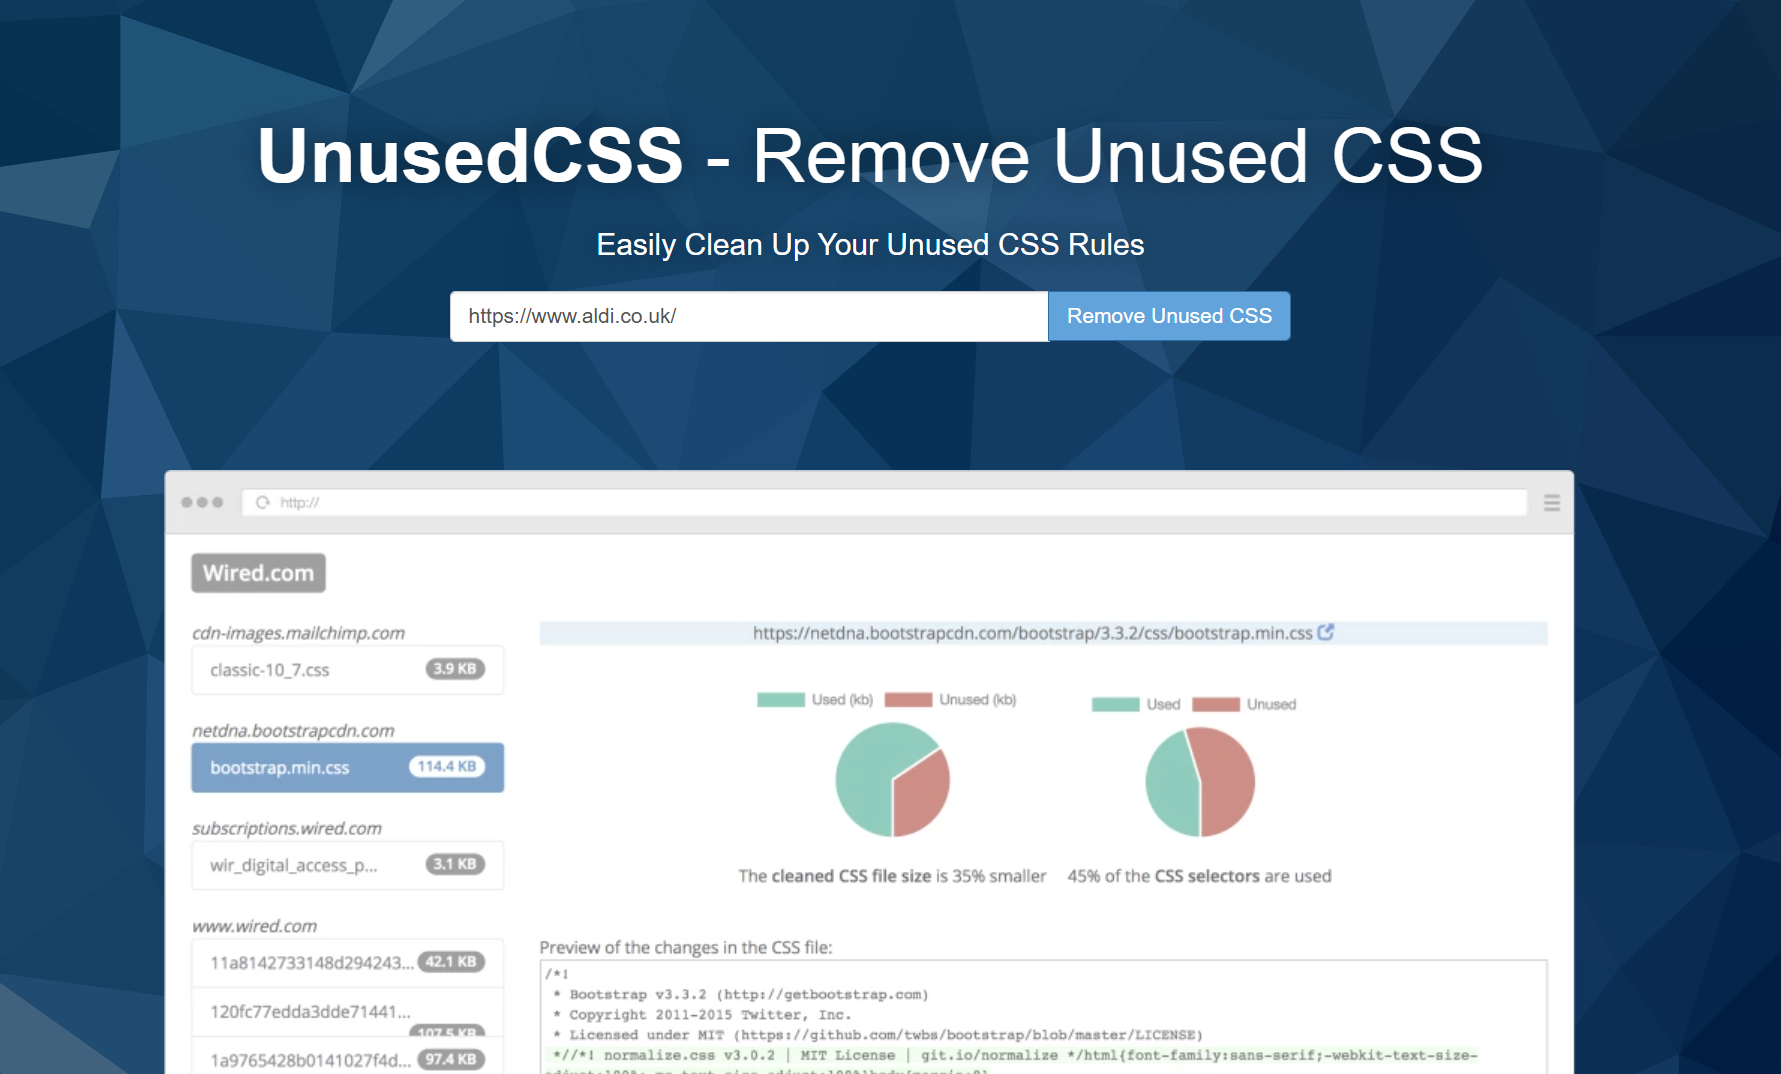
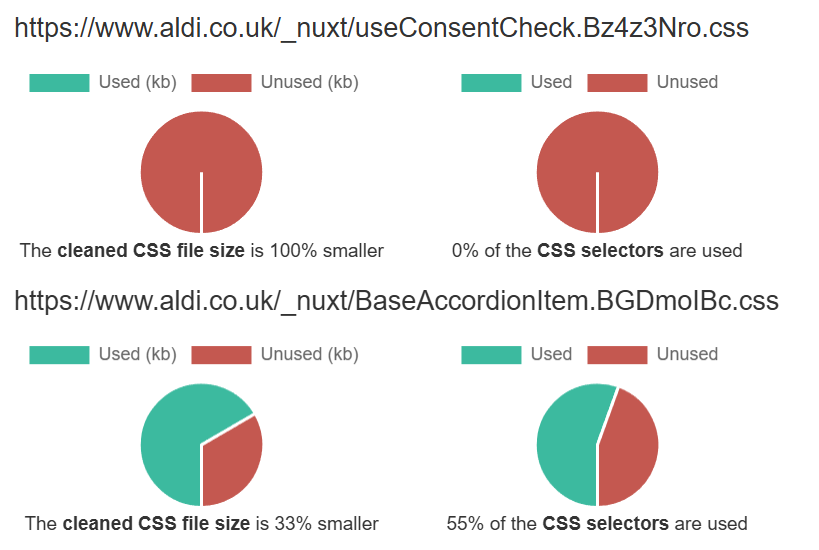
Results are displayed on the following page. Here, we can see the first stylesheet detected is entirely unused, meaning that this file could be removed completely without affecting the user experience.
The second stylesheet has 55% of the selectors used and the cleaned file is 33% smaller in size.
Paid users can scan their entire website and also download the optimized CSS files.
Optimizing CSS with DebugBear
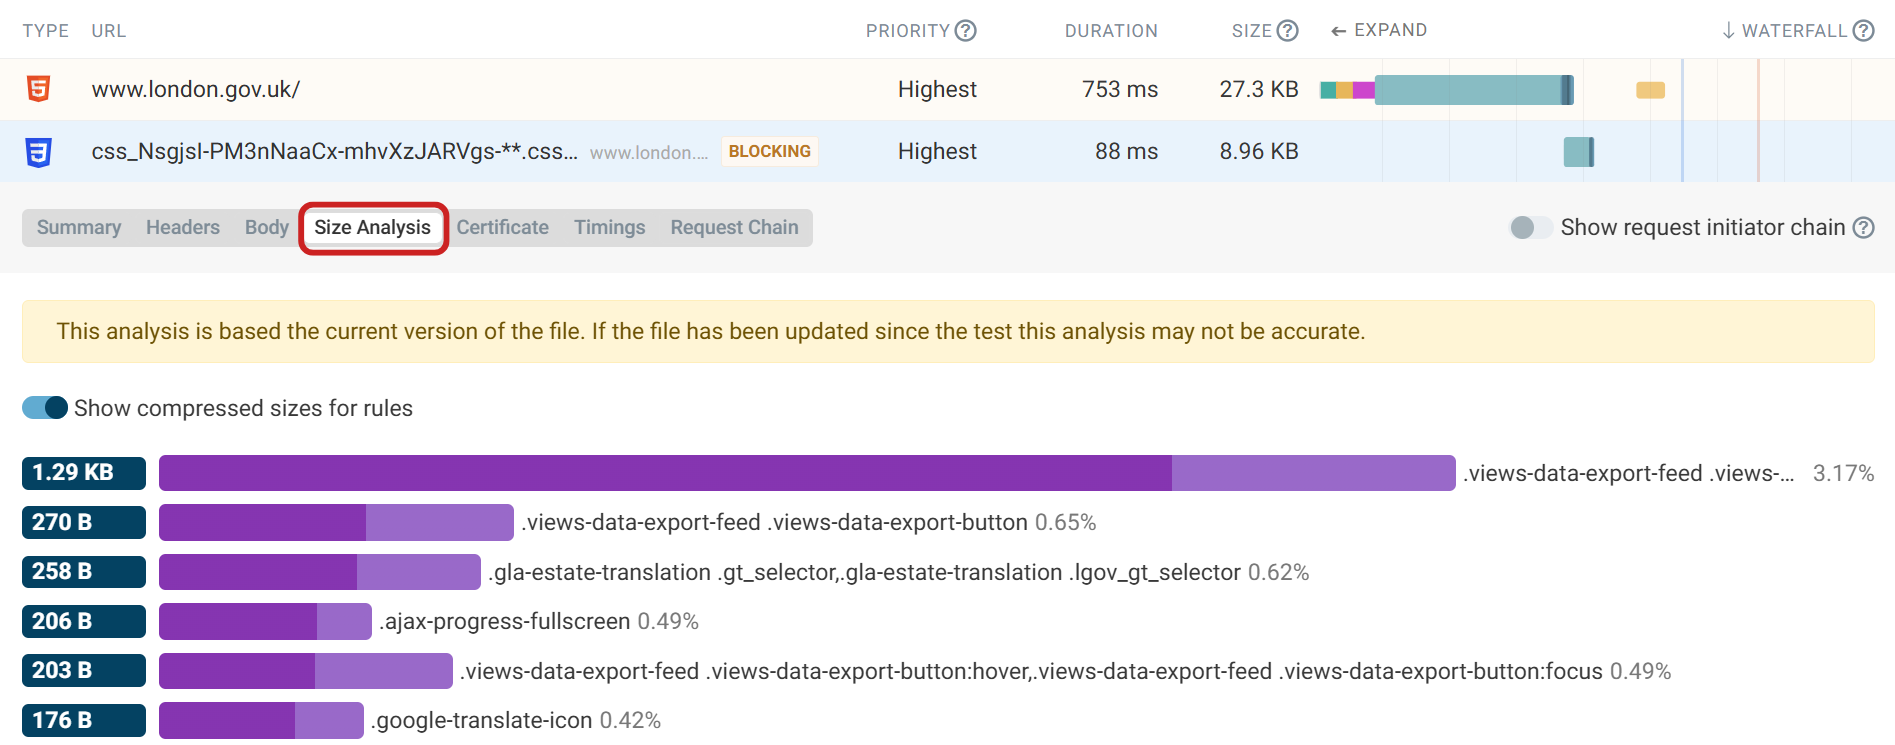
A Lighthouse audit is included with every DebugBear lab test. There is also a CSS Size Analysis when clicking into a CSS request. The size analyzer parses the CSS and groups content size by the most commonly used selectors, allowing you to identify any unused selectors that are not needed for the page render.
Speed up your website with ongoing monitoring
Eliminating unused CSS is a great step toward a faster website, but maintaining optimal performance requires ongoing monitoring.
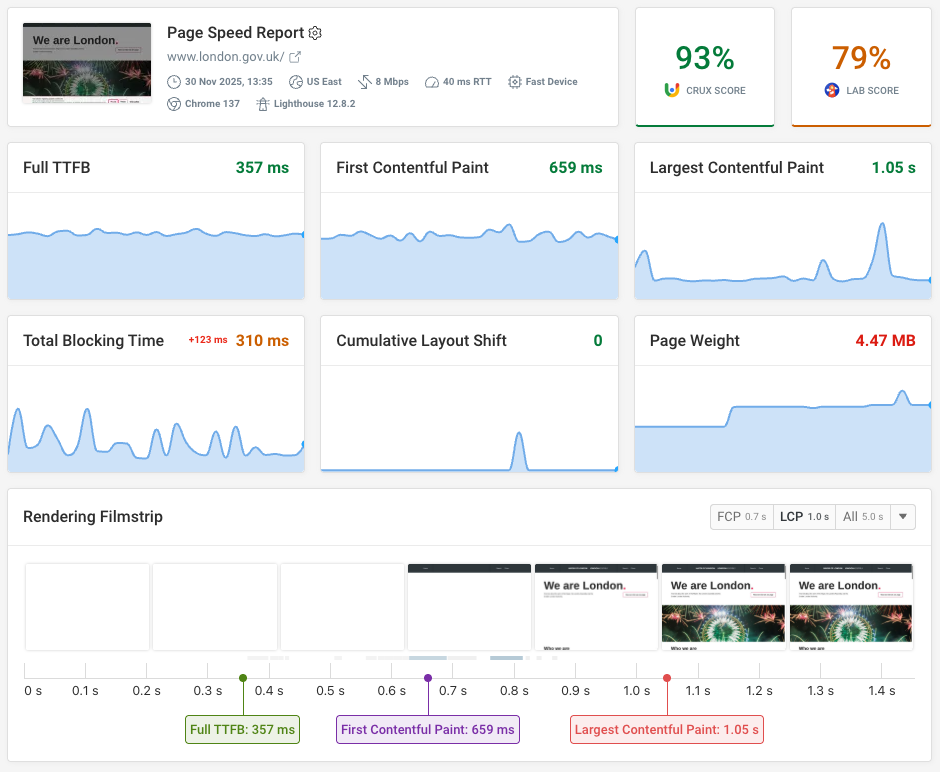
With DebugBear, you can monitor your website automatically and receive alerts when page speed regressions occur. Real User Monitoring elevates your optimization efforts by showing the real-time impact of your changes on actual visitors. This allows you to see how your improvements enhance user experience instantly.
Start a 14-day free trial and start optimizing your website today.


Monitor Page Speed & Core Web Vitals
DebugBear monitoring includes:
- In-depth Page Speed Reports
- Automated Recommendations
- Real User Analytics Data
