

How Paramount Digital optimizes client websites for Core Web Vitals

Paramount Digital is a digital marketing agency that helps clients win more customers through channels like SEO, content marketing, or PPC ads.
We spoke to Paul Terry, Head of SEO at Paramount, to see how they're using DebugBear as part of their technical SEO projects.
What problem were you trying to solve?
Optimising performance on client websites is a big focus for us. We were looking for a tool that helped us easily identify performance issues on client websites, particularly around Core Web Vitals.
Why did you choose DebugBear?
We found DebugBear offered the most in-depth analysis around Core Web Vitals and web performance. Whether that was LCP, CLS, INP and more.
The insight we get from Debugbear allows us to advise clients on changes to improve their website's performance, which, in turn, positively impacts their position in search engines and their conversion rates.
How do you use DebugBear in your workflow?
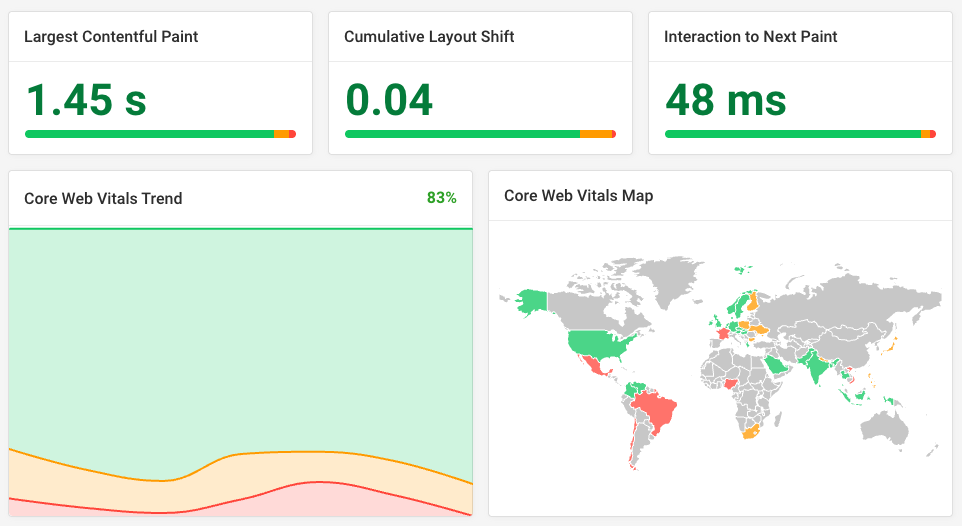
We use DebugBear every day in our monitoring and development workflows, meaning we can be confident the websites we manage are hitting the required Core Web Vital scores. We've set it up to regularly monitor page speed across all the sites we manage to find and react to performance concerns before they impact users.
The data we get from DebugBear inform our web optimisation strategies and client recommendations. This information goes into our regular performance reviews so clients understand how any website changes will improve performance and prioritise development work.
Can you share a recent example where DebugBear helped diagnose or optimise a site?
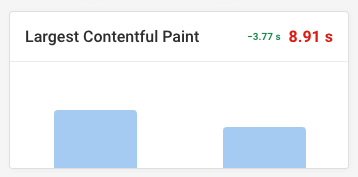
We recently worked with an eCommerce client whose website was experiencing a drop in performance scores relating to Largest Contentful Paint (LCP) and Cumulative Layout Shift (CLS).
The site looked like it was functioning well on the surface. But when we looked at it through DebugBear, we noticed slow load times and layout shifts (especially on mobile).
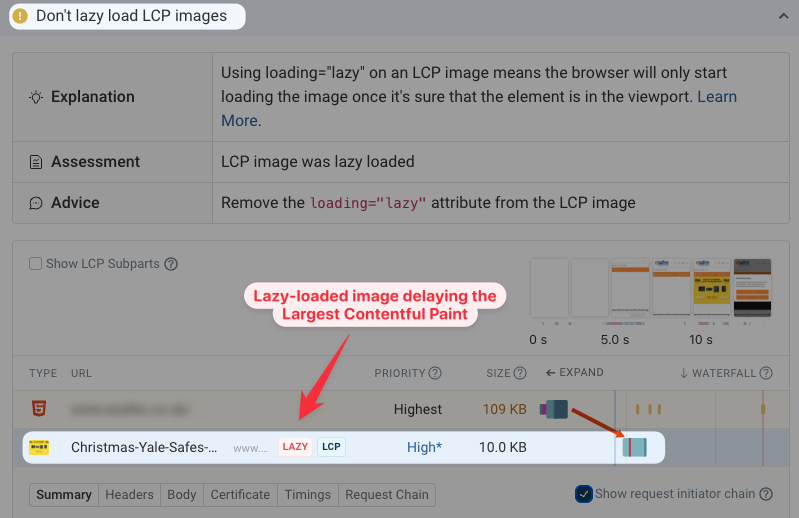
Looking at the data, using DebugBear's detailed waterfall charts and LCP element, we traced the LCP issue to a hero image that was being lazy-loaded, which delayed its rendering.
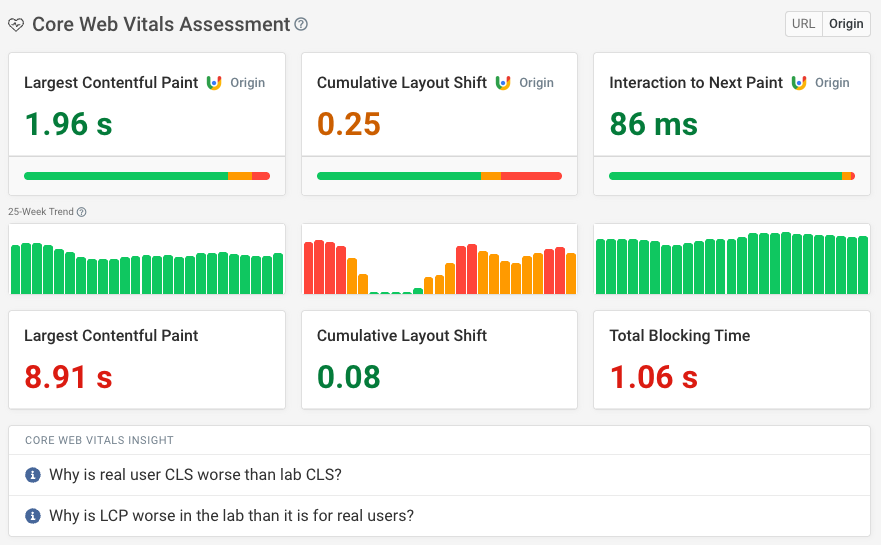
The CLS issue stemmed from ads and third-party scripts injecting content above the fold without reserving space. DebugBear's layout shift tracking helped us identify exactly which elements were causing the instability.
With the information Debugbear gave us, we updated the image loading strategy to prioritise the hero image, reserved space for third-party elements using CSS and delayed non-essential third-party scripts to load after user interaction.
All this had a huge impact on the client's website's Core Web Vitals and search rankings.
How does DebugBear compare to other tools you've tried?
We've used several performance monitoring tools, but DebugBear is our favourite because of its clarity, reliability, and attention to Core Web Vitals.
DebugBear is more consistent and transparent than other tools we've used. We can easily find synthetic (lab) testing and real-user (RUM) data in one place, which allows us to get a full picture of site performance. Also, we can see trends in the historical data and easily find regressions in performance over time.
Plus, the support and documentation are excellent. Updates are frequent, and the product feels actively maintained and improved, something we've found lacking in a few alternatives.
What DebugBear features do you find particularly useful?
Core Web Vitals monitoring
The ability to track a website's metrics over time gives us a clear view of performance. The historical data helps us measure the impact of changes and identify longer-term trends. Along with that, the in-depth reports we can pull (waterfall charts, JavaScript execution timings and layout shifts) make it much easier to find specific issues and prioritise fixes.
Real-world and lab data
Having access to both synthetic lab data and real-user (RUM) data gives us a balanced perspective, allowing us to test in controlled environments while keeping the user experience front and centre.
Report sharing
The ability to share easy-to-understand reports with non-technical stakeholders helps us communicate performance concerns clearly and support our recommendations with data.
What made you choose DebugBear over other products?
DebugBear offered the best combination of accuracy, usability and actionable insights, specifically around Core Web Vitals.
What's an example of how your team has benefited from DebugBear?
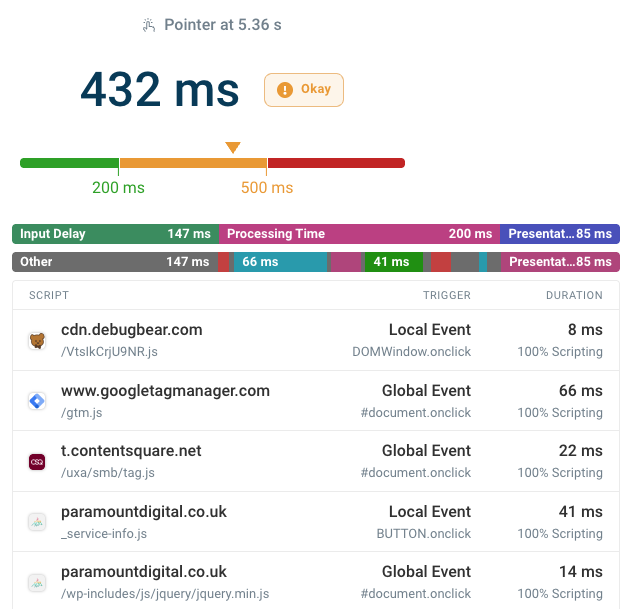
One clear example of how our team has benefited from DebugBear was during the optimisation of a high-traffic client website that had been underperforming in Core Web Vitals, particularly Interaction to Next Paint (INP).
Using DebugBear, we found that long JavaScript tasks were blocking the main thread and delaying user interactions. The platform's detailed breakdown of script execution times made it easy to pinpoint which third-party scripts were responsible. This level of visibility would have taken considerably longer to uncover using other tools.
As a result, we restructured the way scripts were loaded, deferring non-essential scripts and breaking larger tasks into smaller, asynchronous ones. After implementation, we monitored the improvements through DebugBear and saw a measurable reduction in INP, alongside an improved overall performance score.
Is there anything else you'd like to say about DebugBear?
We particularly appreciate how actively the platform is maintained and improved. New features are regularly introduced, and support is responsive and knowledgeable, something that really sets DebugBear apart from many other tools we've used.
DebugBear doesn't just help us identify problems. It helps us solve them faster and with greater confidence. We'd happily recommend it to any team serious about improving website performance and maintaining strong Core Web Vitals over time.
You are using an old browser that is not supported anymore. You can continue using the site, but some things might not work as expected.