
Forced reflows are a common website performance problem that can slow down rendering and cause slow interactions.
This article explains what forced reflows are, how to detect them, and what you can do to fix them.
What is a forced reflow while executing JavaScript?
Forced reflows on a website happen when running JavaScript code depends on style and layout calculations. For example, if website code is reading the width of a page element, that can cause a forced reflow.
Ideally, JavaScript code does not depend on layout recalculations that happen while the code is running. Instead, the browser performs layout calculations when it needs to display content to the user.
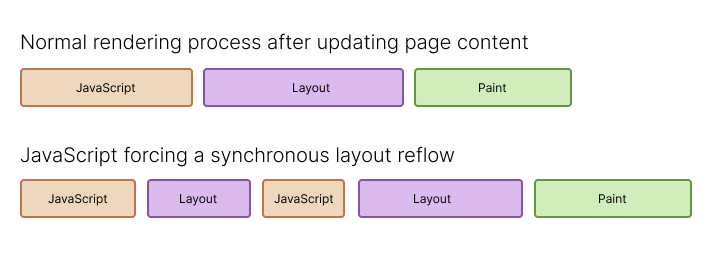
With forced reflows, also called forced synchronous layouts, JavaScript execution is instead interrupted by style and layout recalculations. Once those are complete, the browser can finish running the code and then move on to the normal page rendering process that's needed to show the page to the visitor.
Example of a forced reflow
This JavaScript code snippet causes a reflow by accessing the clientWidth property after modifying the page content.
const h1 = document.querySelector("h1");
h1.textContent = "Forced reflow example";
console.log(h1.clientWidth);
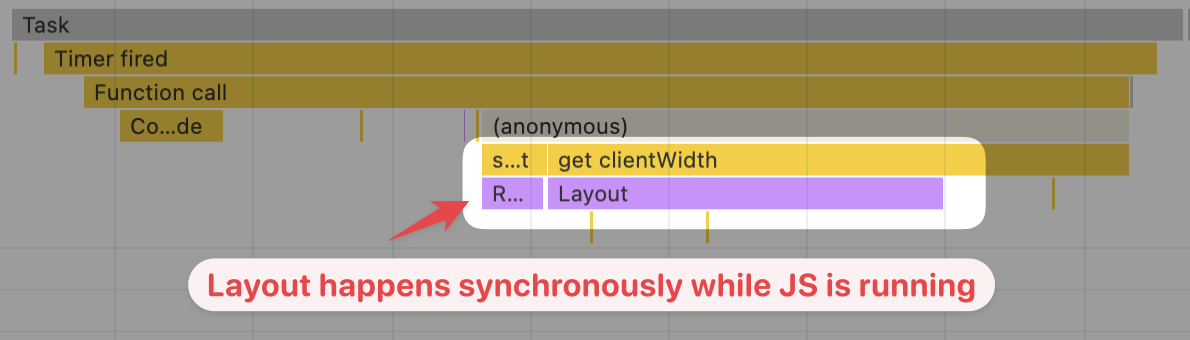
Since the width of the heading has changed since the page was originally rendered, the browser now needs to synchronously perform style and layout recalculations.
You can see this layout work by recording a performance profile in Chrome DevTools.
What triggers forced reflows?
Up-to-date layout calculations are clearly needed to access some element size information, for example clientHeight or getBoundingClientRect.
However, there are also many properties that you may not expect to require layout calculations, for example:
- Adjusting the scroll position
- Getting the window size
- Reading
innerText - Calling
focus()on an element
Paul Irish has compiled a more comprehensive list of properties that force layout/reflow.
Sometimes property access or function calls don't trigger a relayout but still trigger style recalculations.
What is layout thrashing?
Layout thrashing happens when JavaScript code repeatedly forces layout work to happen before code execution can continue.
This diagram shows an example of what that looks like on the browser main thread.
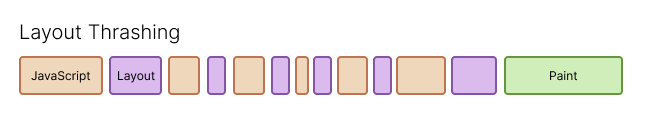
This commonly happens with JavaScript UI components like sliders. If the browser measures the size of each slide after creating it, then this will cause layout thrashing and poor performance.
How to identify forced reflows on your website
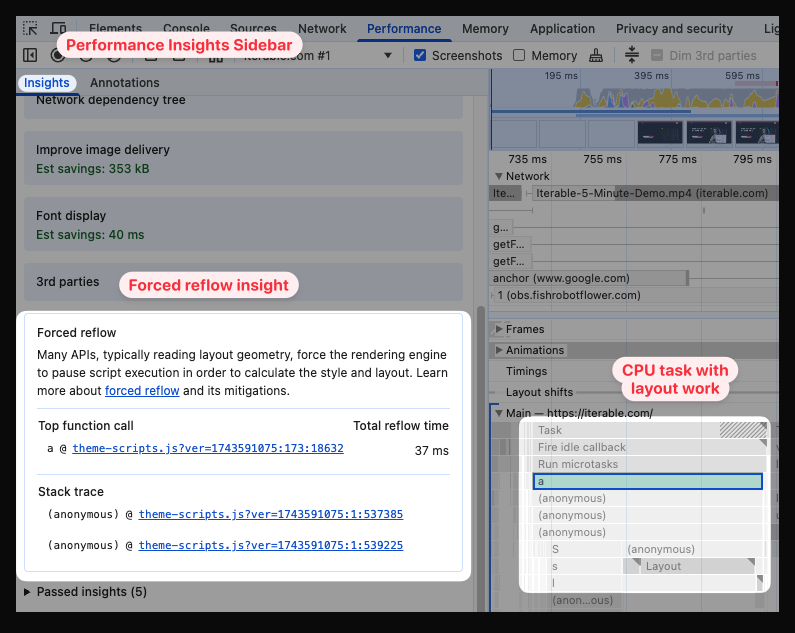
Chrome DevTools can help you identify forced reflows in your code. Collect a profile in the "Performance" tab, expand the performance insights sidebar, and then look for the "Forced reflow" section.
The panel will tell you where in the performance trace reflows occurred and how much time was spent on them.
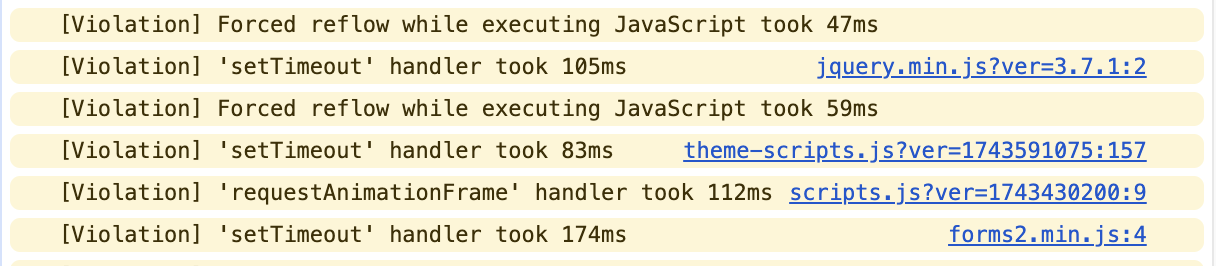
The Chrome DevTools console also proactively surfaces slow forced reflows happening on the page.
[Violation] Forced reflow while executing JavaScript took 47ms
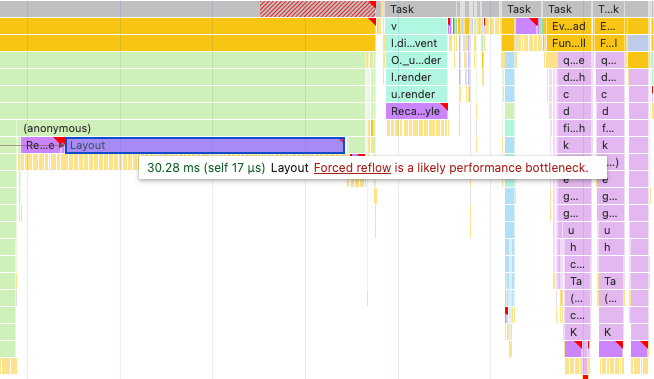
Chrome DevTools: Forced reflow is a likely performance bottleneck
Chrome also highlights synchronous "Layout" and "Style recalculation" tasks in the performance profile itself. These tasks have a red triangle shown in the top right, and hovering over them explains that forced reflows can cause poor performance.
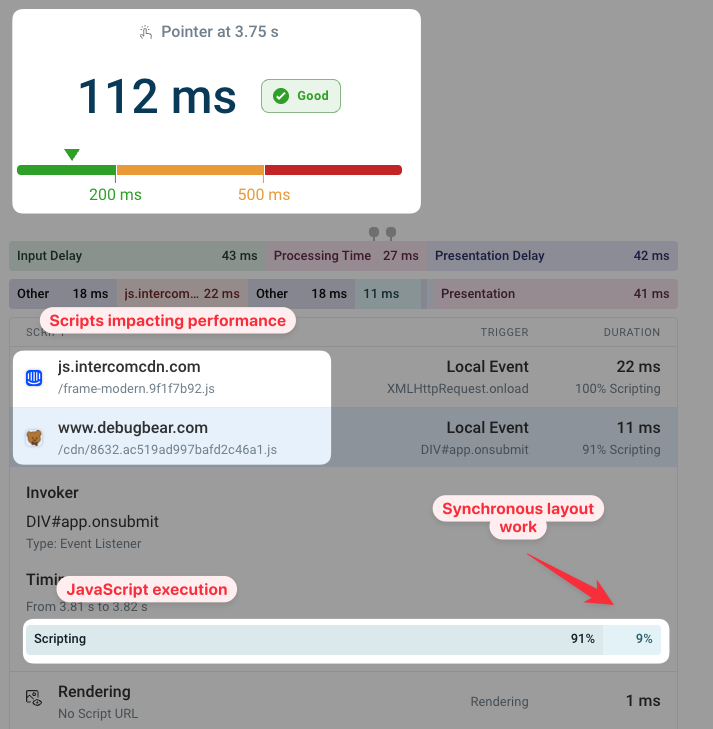
Synchronous layout tasks in RUM data
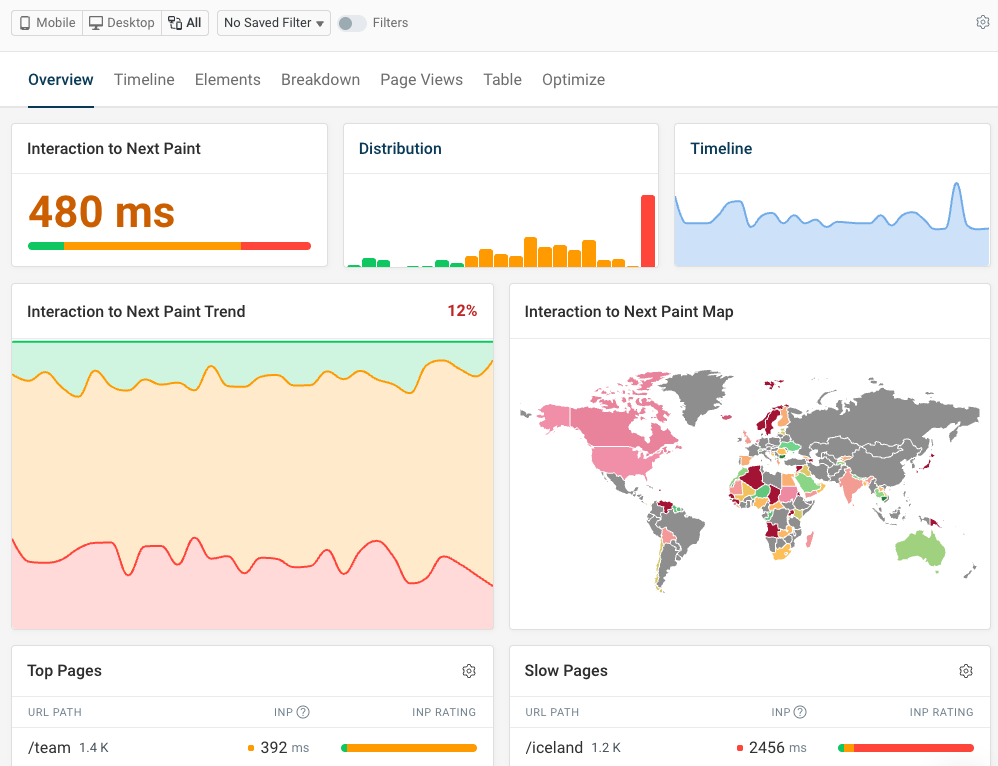
Real-user monitoring (RUM) can tell you whether synchronous layout work is delaying interactions on your website.
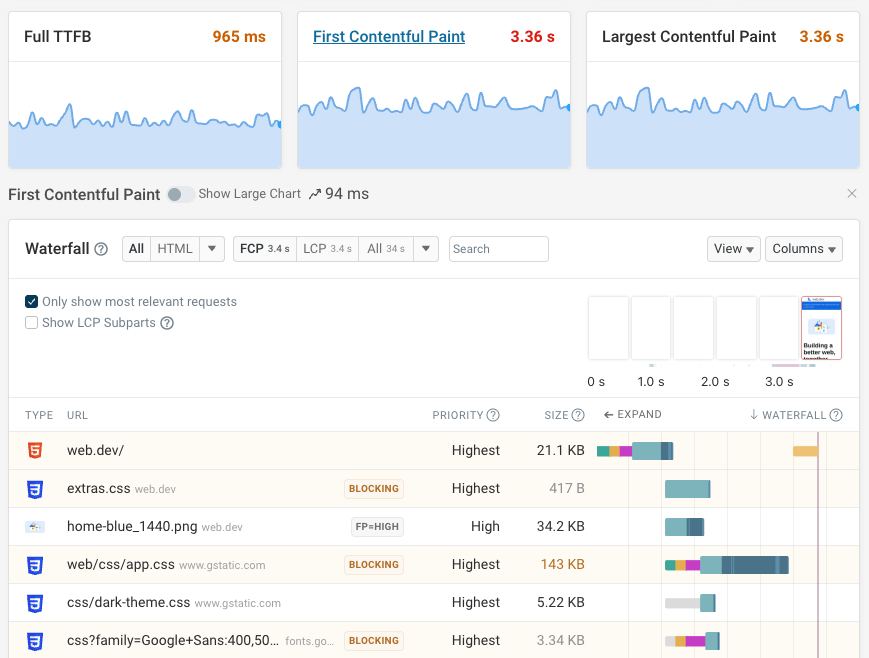
Page views in DebugBear website monitoring data tell you what scripts ran during the interaction and whether time was spent on script evaluation or layout work.
Forced reflow audit in Lighthouse
Google's Lighthouse tool, which also powers the diagnostic data on PageSpeed Insights, includes an audit for detecting forced synchronous layouts.
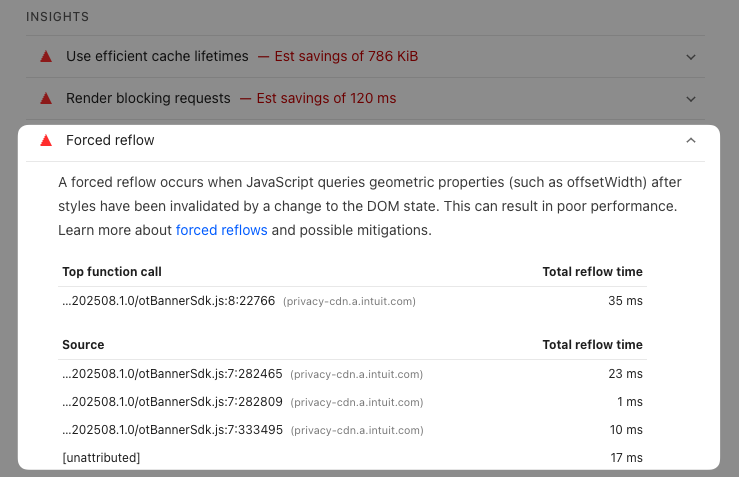
If this applies to your website, the Forced reflow audit will be listed in the Insights section of your report:
A forced reflow occurs when JavaScript queries geometric properties (such as offsetWidth) after styles have been invalidated by a change to the DOM state. This can result in poor performance.
The audit shows you what code triggered a reflow and how much time was spent on the layout update.
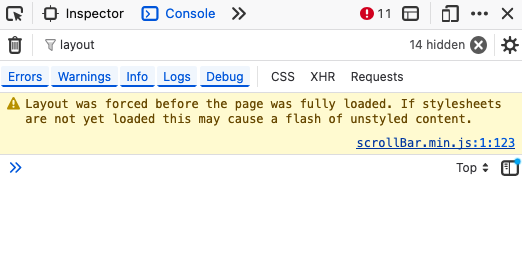
Firefox: Layout was forced before the page was fully loaded
If a page tries to read layout data before all necessary stylesheets have been loaded, Firefox shows this message in the console:
Layout was forced before the page was fully loaded. If stylesheets are not yet loaded this may cause a flash of unstyled content.
How to fix forced synchronous layout work
There are two sequential steps in your code that cause synchronous reflows while running JavaScript:
- Layout invalidation
- Reading layout metrics
If you can avoid one of these steps, then no relayout work is needed. Let's take a look at how to identify the causes of forced reflows and what techniques you can use to fix them.
Identify the cause of layout invalidation and relayout
The DevTools performance profile shows what property access triggered the layout or style calculation. Click on the task to see what code was involved.
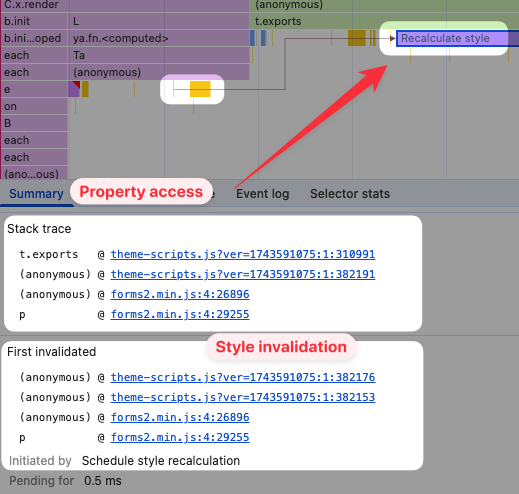
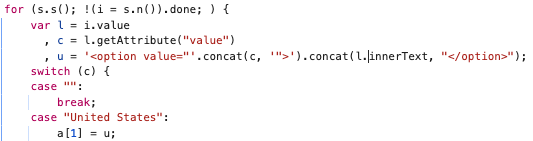
After clicking on the file name and line/character number, we can see that the innerText property was accessed.
The inner text of an element depends on styling. For example, if visibility: hidden was applied to a child element, then the content of that element would not be included in the inner text.
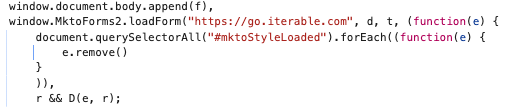
Under the First Invalidated section, we can also see when the page content changed to require a new layout. In this case, we can see that a DOM node was removed from the page.
Avoid accessing layout-triggering properties after making changes
If you know what property access is causing layout calculations, you can find an alternative way to render your page that does not require a synchronous layout.
For example, instead of checking the computed styles of an element, you could instead check for the class name or attribute value that's responsible for setting those styles. (That means you'll be checking for the styles indirectly, so if implementation details change, you need to be careful not to break functionality later on.)
If you need to know the size of a UI element that you're adding to the page, you may be able to check the size of its parent before inserting the element.
In some cases, it's also possible to use CSS for your layout instead of relying on JavaScript-based size calculations.
Fix layout thrashing by aggregating reading layout metrics
A common pattern with image carousels looks like this:
- Iterate through the list of images
- Add a slide for each image
- Measure the size of the slide
- Apply some additional styles
This will cause layout thrashing, because we're looping over the list of slides, modifying the DOM, and then reading updated metrics.
By changing the structure of this code you can instead have a single forced reflow:
- Iterate through the list of images three times
- First add a slide for each image
- Then collect the size data for all slides
- Finally, apply new styles everywhere
Read layout metrics outside any loops that modify page content or styles. Cache layout values instead of re-reading them every time.
Delay layout until after the initial render
Your code doesn't always have to respond to layout changes right away. In those cases, you can wait until the next frame on the page has been rendered, for example using setTimeout.
Once the browser has gone through the normal rendering process, reading element metrics will no longer trigger a new layout.
In our slider example, this technique might work for slides that are not visible initially. You update the first slide with new layout data, then insert additional slides and update their styling asynchronously.
How do forced reflows impact Core Web Vitals?
The Core Web Vitals are three user experience metrics that also impact search rankings in Google.
Forced synchronous layout and styling work negatively impacts two of them, the Largest Contentful Paint (LCP) and Interaction to Next Paint (INP).
Largest Contentful Paint
LCP measures how quickly your website loads. That depends on many factors, such as resources loaded over the network and CPU processing happening on the browser main thread.
Forced synchronous layout work means your JavaScript code takes longer to run. When running page speed tests on your website, you'll see a higher score for the Total Blocking Time metric.
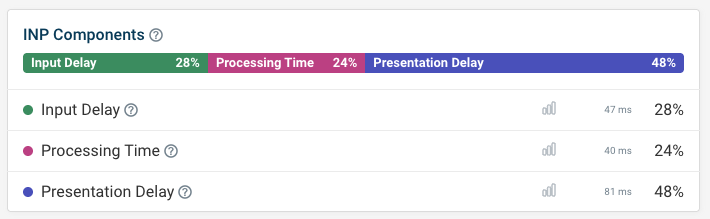
Interaction to Next Paint
INP measures delays that happen when the user interacts with the page. You'll get a worse INP score if the UI is frozen for some time before the website updates.
If a forced reflow is already in progress when an interaction starts, then this will increase the input delay component of INP. If the interaction itself triggers layout work, then the processing time component of INP will increase.
Track your website speed over time
DebugBear can help you identify forced reflows and other website performance issues. You can also monitor page speed over time across three data sources:
Performance monitoring lets you see how your page speed develops over time and makes sure you'll get alerted when there's an issue with performance.
Real-user metrics let you see when users don't have a good experience on your website. With DebugBear RUM you can inspect each page view to understand its performance characteristics and how you can optimize them.


Monitor Page Speed & Core Web Vitals
DebugBear monitoring includes:
- In-depth Page Speed Reports
- Automated Recommendations
- Real User Analytics Data