Google CrUX Monitoring

Monitor data from Google's Chrome User Experience Report (CrUX).

Optimize the metrics that impact your rankings.
➔ Start Free Trial
No card required. Get set up in minutes.
Monitoring dashboard with Google CrUX data
”We've updated around 15,000 pages and saw some nice gains from it. "Good URLs" and their impressions have increased 3x since implementation.“
Web performance monitoring user profile picture
Rafayel Begoyan
Senior SEO Specialist at CoinStats
CoinStats logo
”We love DebugBear. It has proven useful time and time again. I evaluated the different competitors and DebugBear was the best overall product.“
Web peformance monitoring user profile picture
Rafael Corral
Senior Software Engineer
Medium logo
Trusted By Hundreds Of Happy Customers
DebugBear Customers DebugBear Customers

Keep track of real user Chrome data

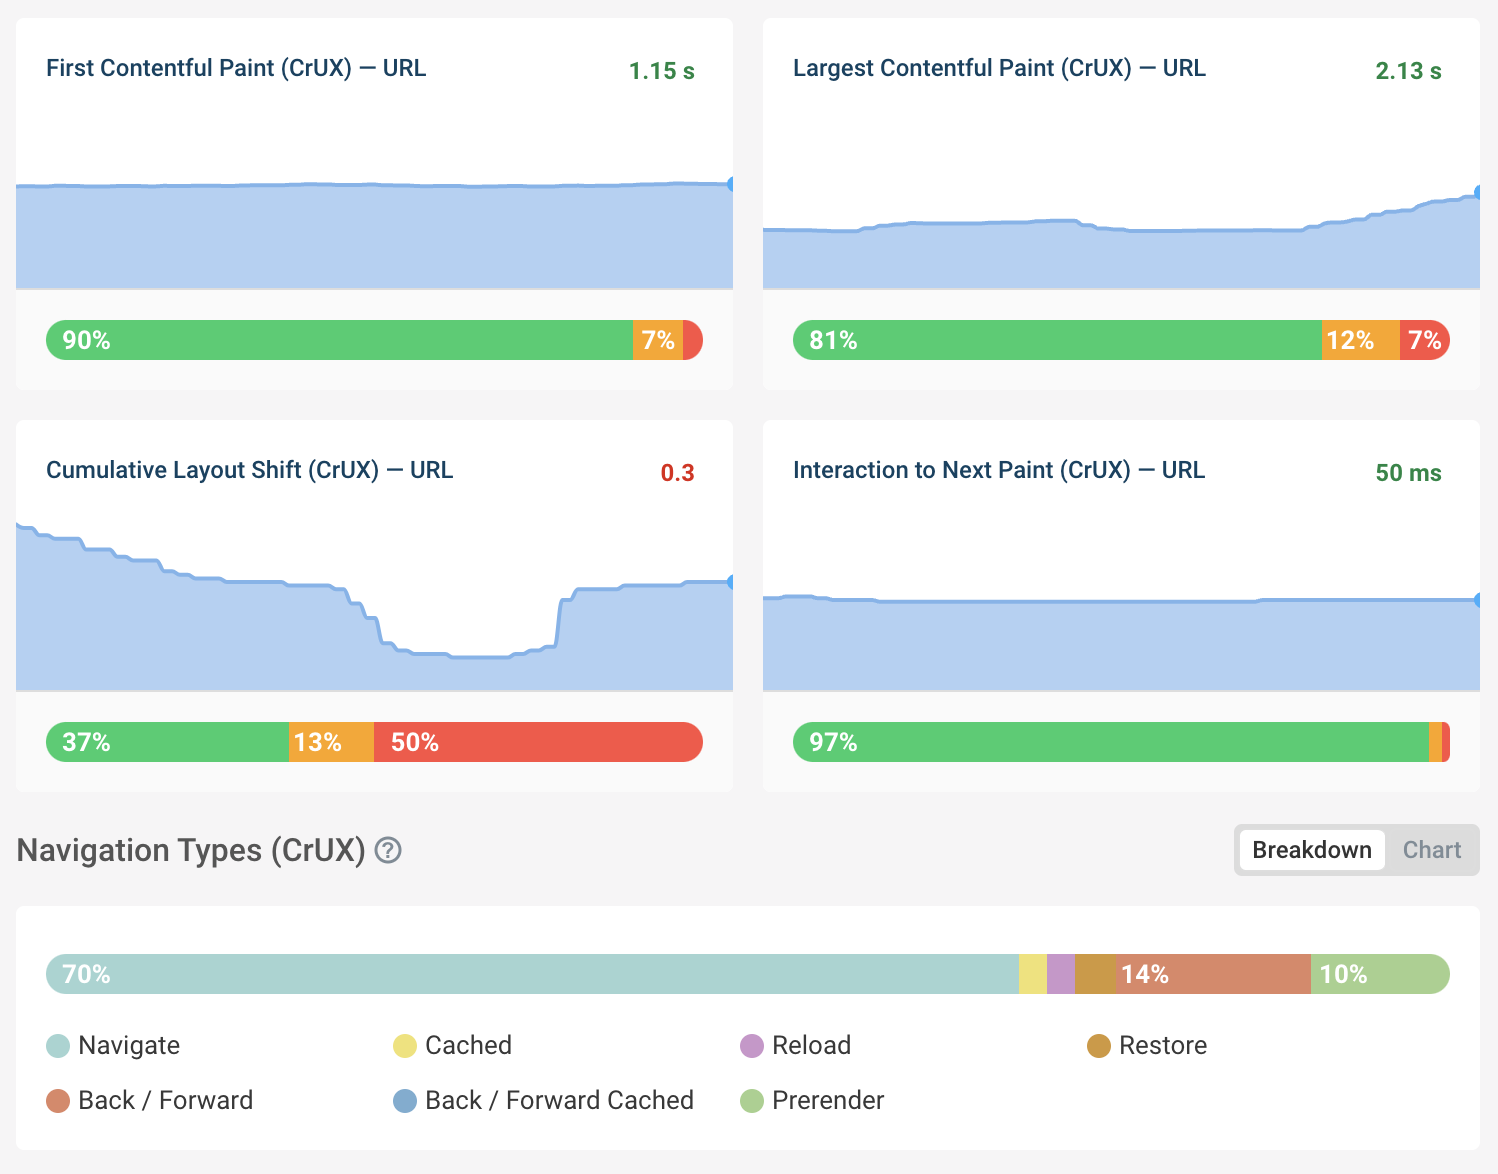
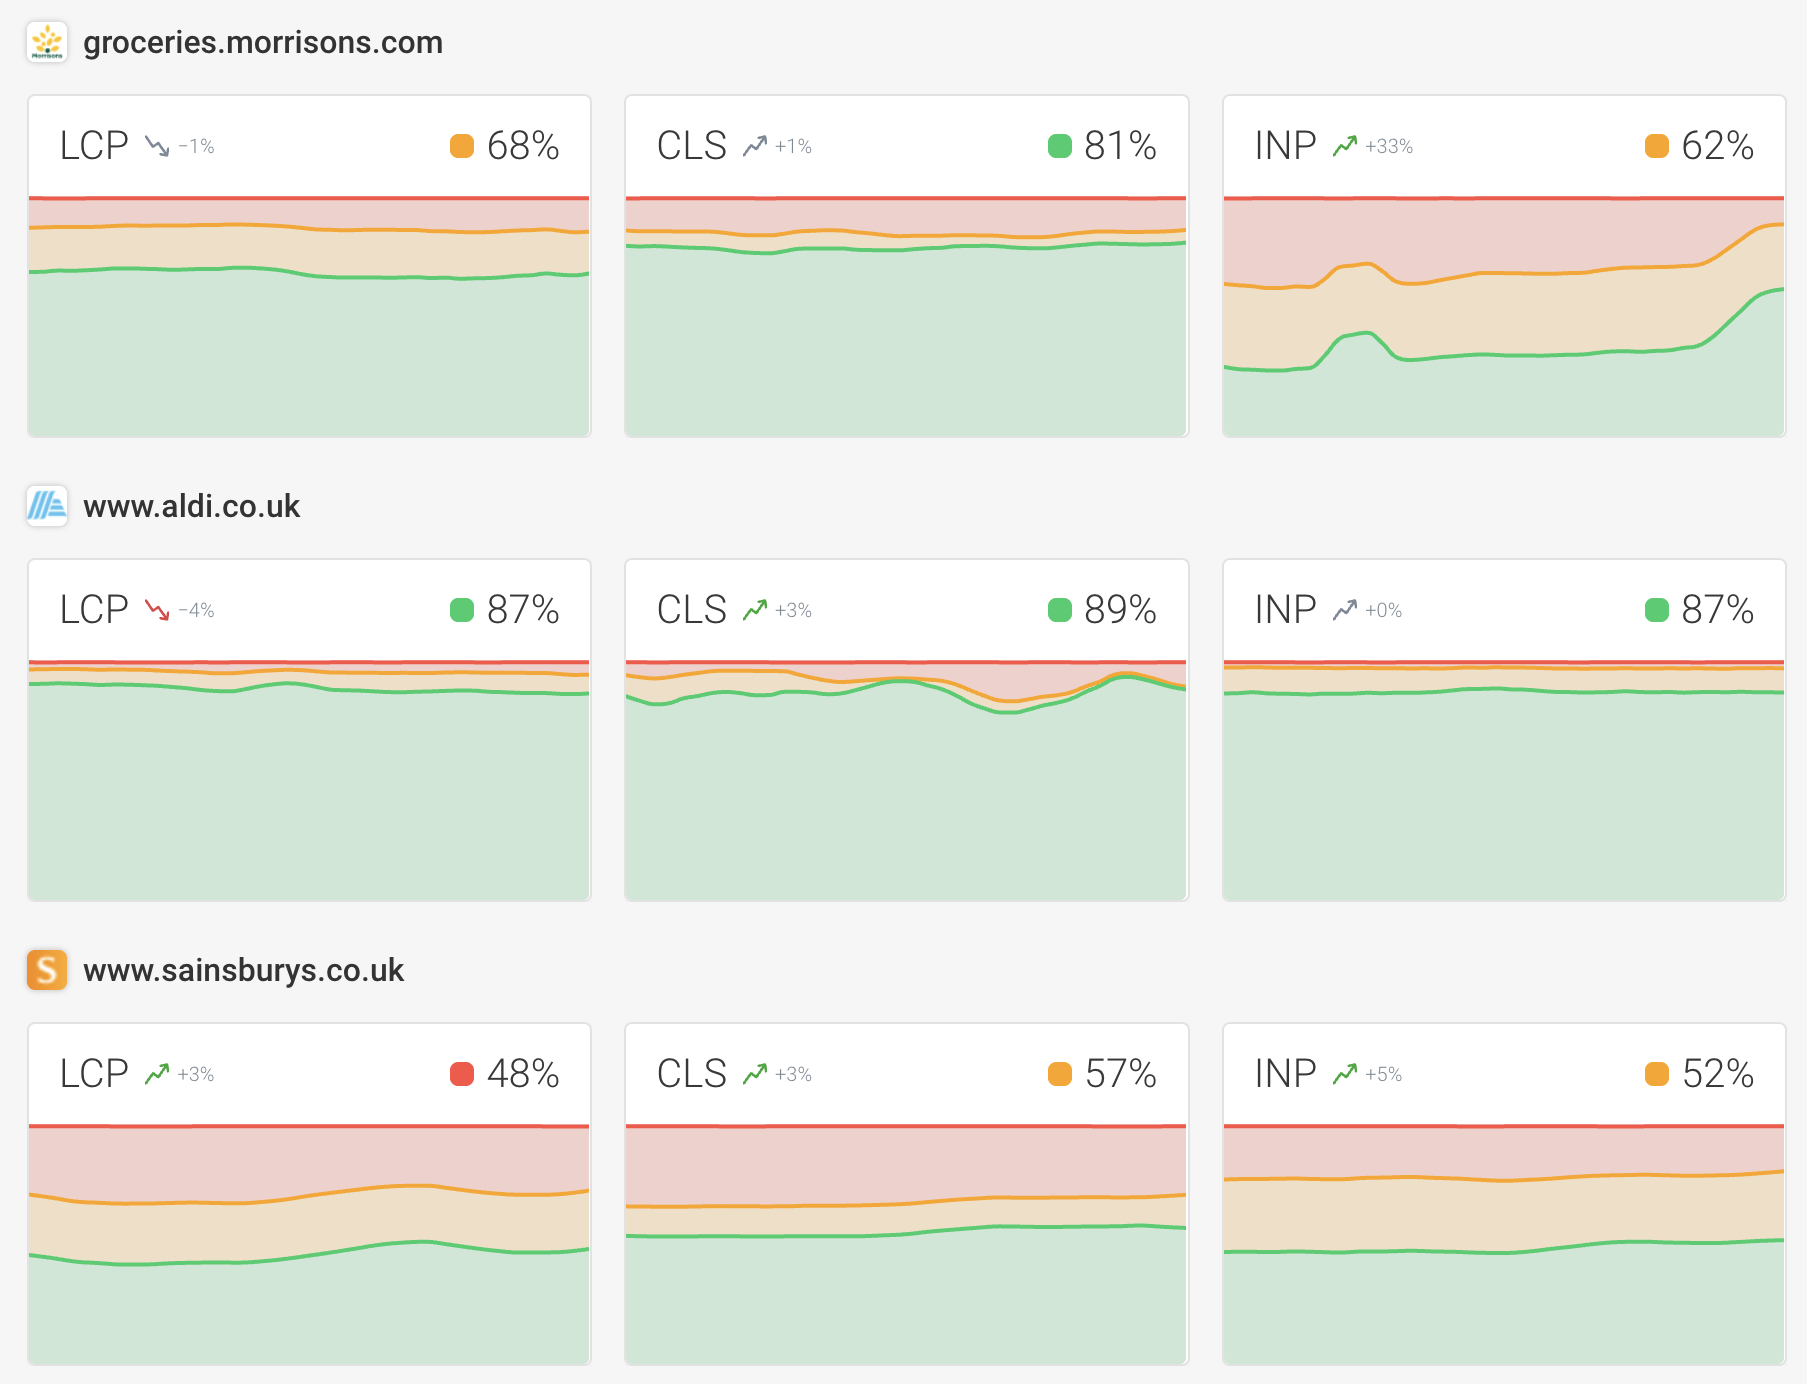
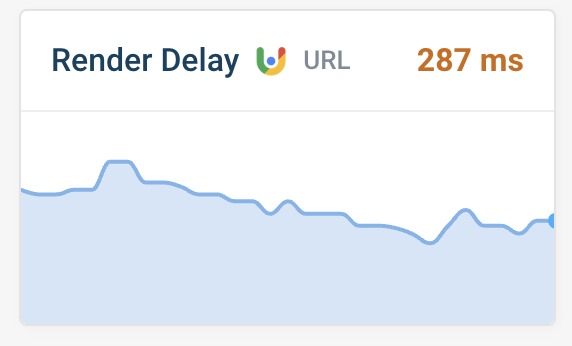
CrUX Core Web Vitals data

Continuously track web vitals metrics from Google's Chrome User Experience Report to see how your website is performing for real users.

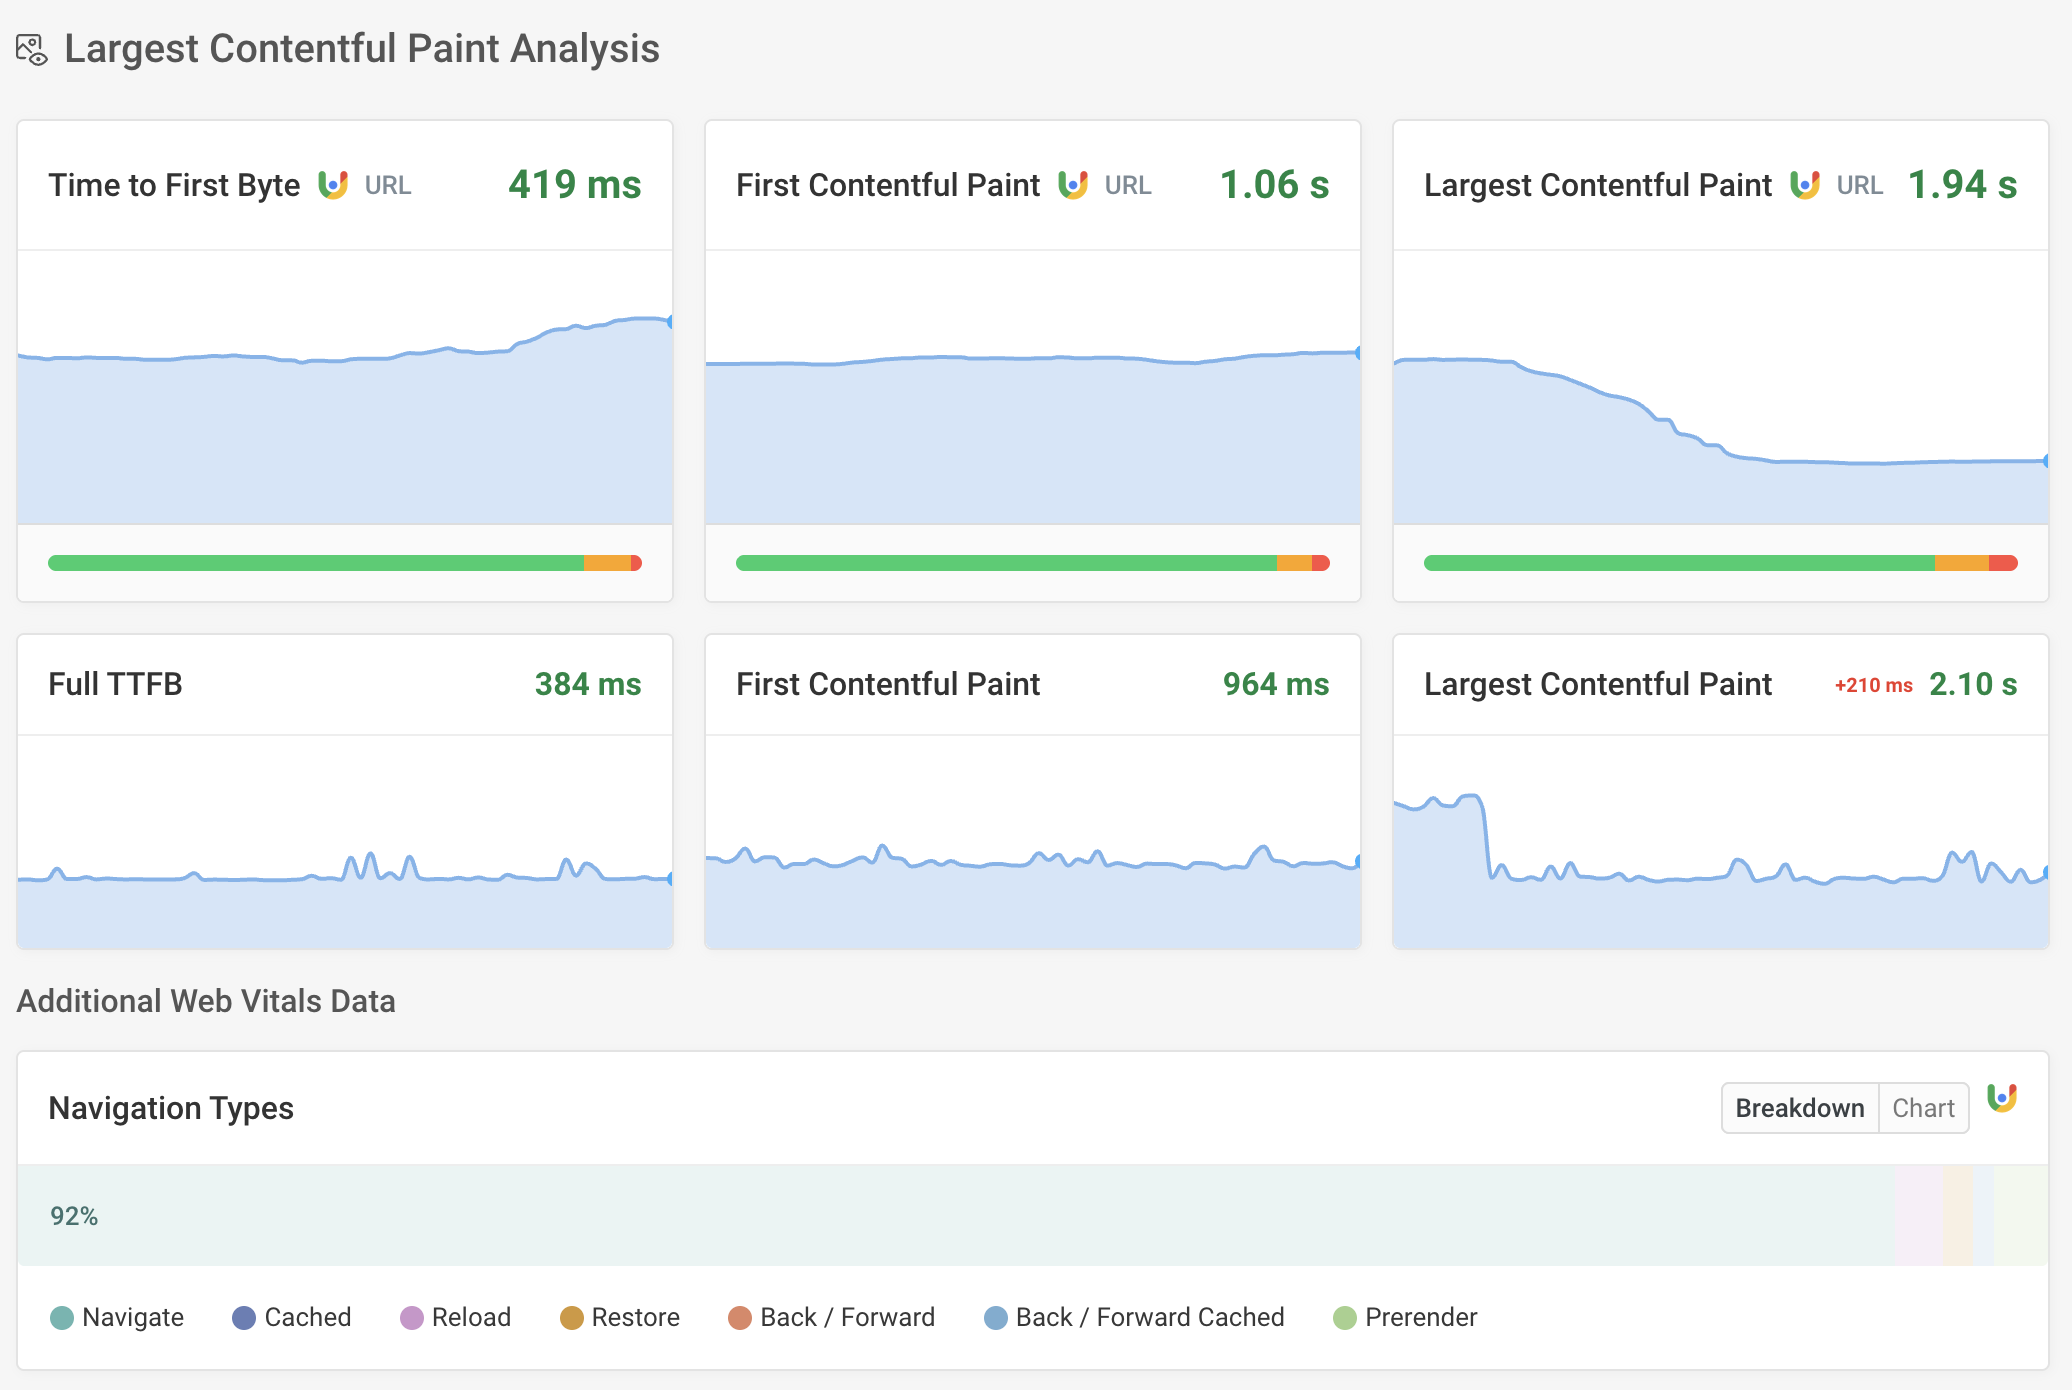
Additional CrUX metrics

In addition to the three Core Web Vitals, DebugBear also tracks debug metrics like the Time to First Byte and First Contentful Paint.

CrUX Navigation type breakdown

Not all page views on your website are new visits. The navigation type breakdown shows how often pages can be cached or preloaded.

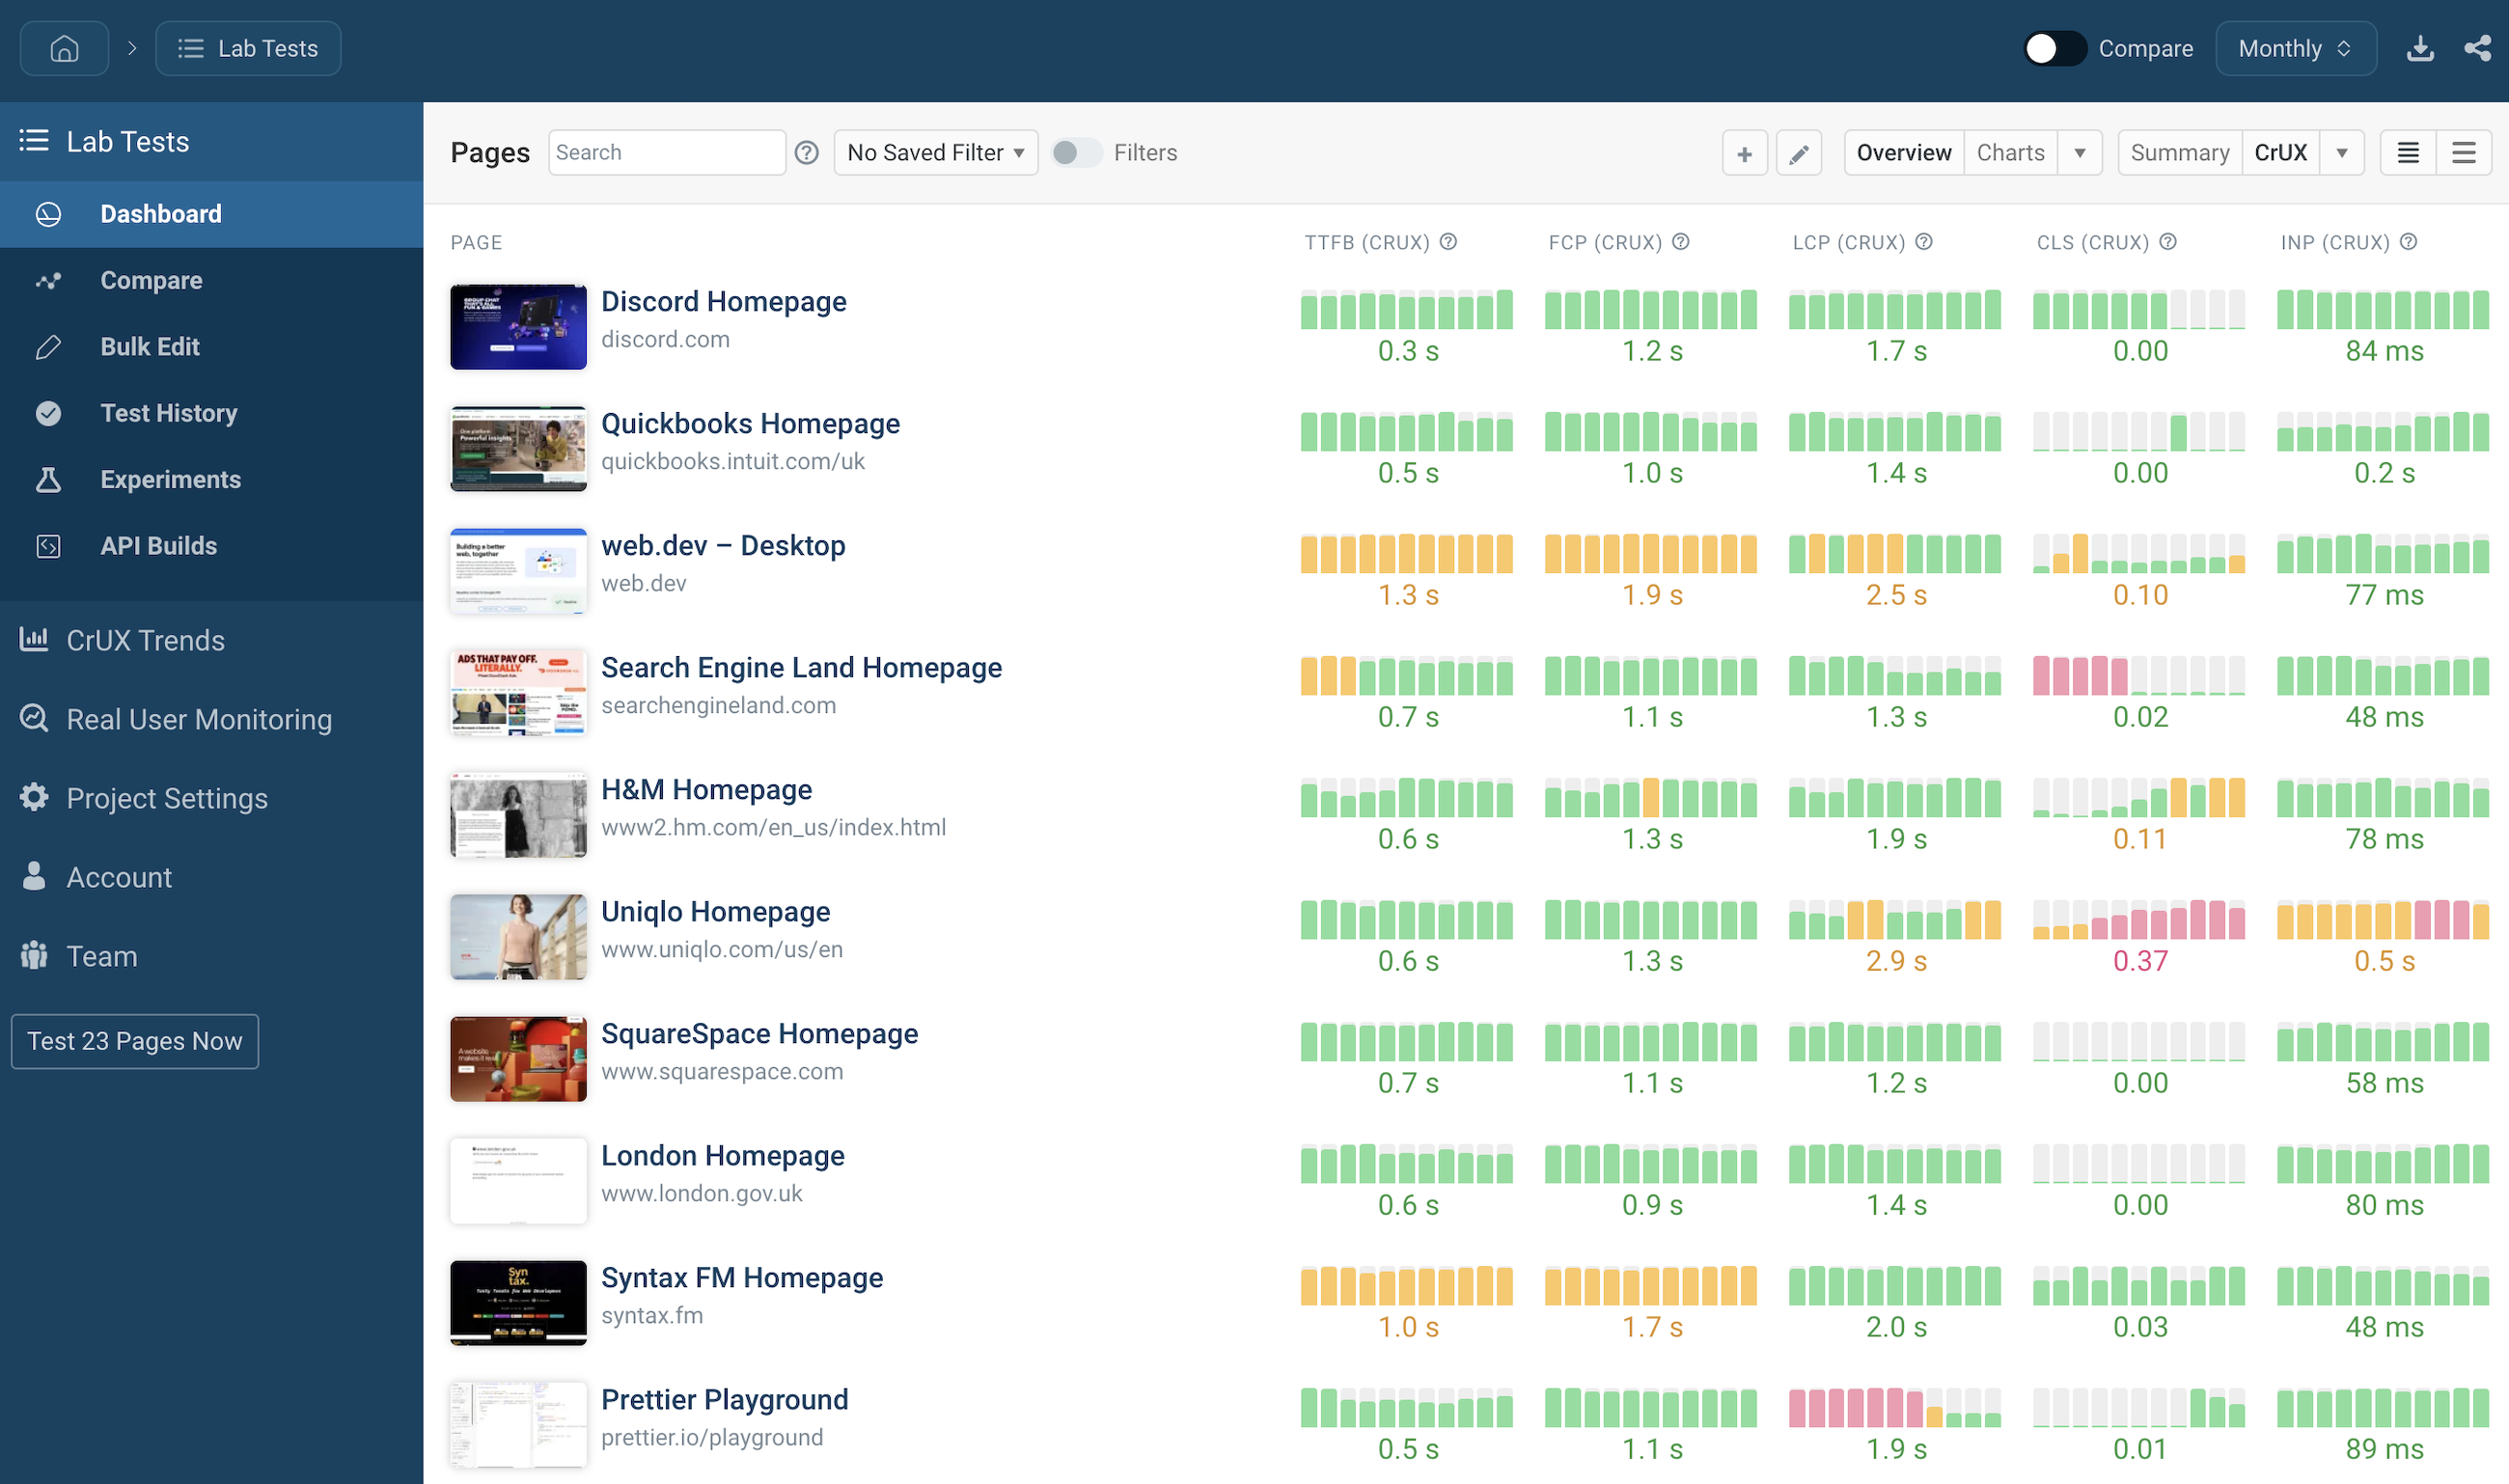
Charts with Google CrUX data

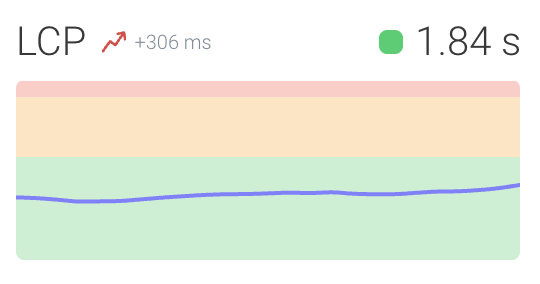
Compare CrUX and lab data

Scheduled synthetic tests

Collect detailed page speed reports and get alerted to problems before they impact real users.

CrUX data is delayed by 28 days

Google only reports CrUX data that's aggregated over a 28-day window. Lab-based tests update immediately.

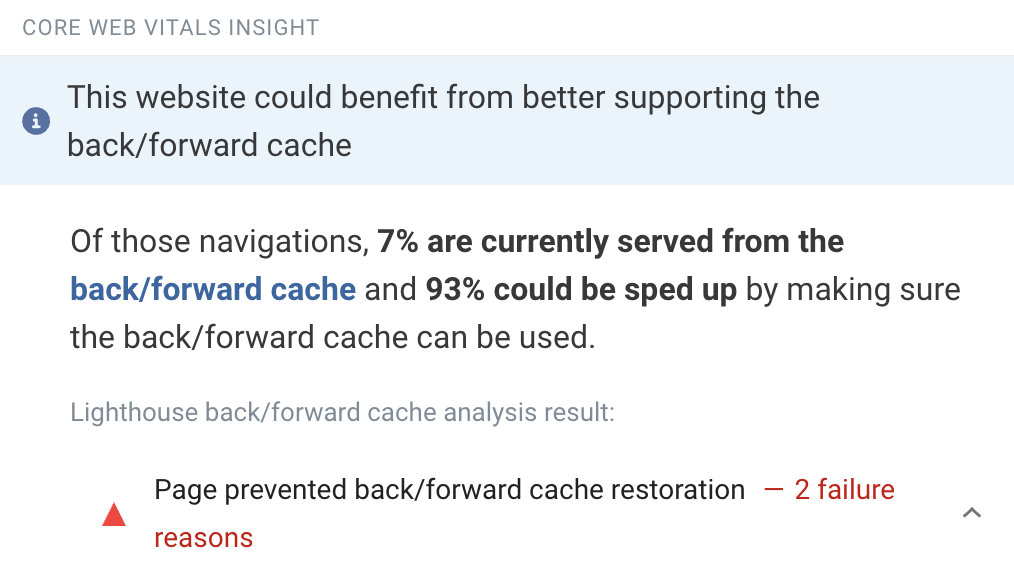
Page speed recommendations

Get website performance recommendations tailored to your website.

CrUX and lab data comparison

Real user monitoring

No 28-day wait

Only the real user CrUX data, DebugBear RUM data updates immediately.

Site-wide monitoring

URL-level CrUX data is only available for pages with enough traffic. DebugBear RUM provides detailed web vital reporting for your entire website.

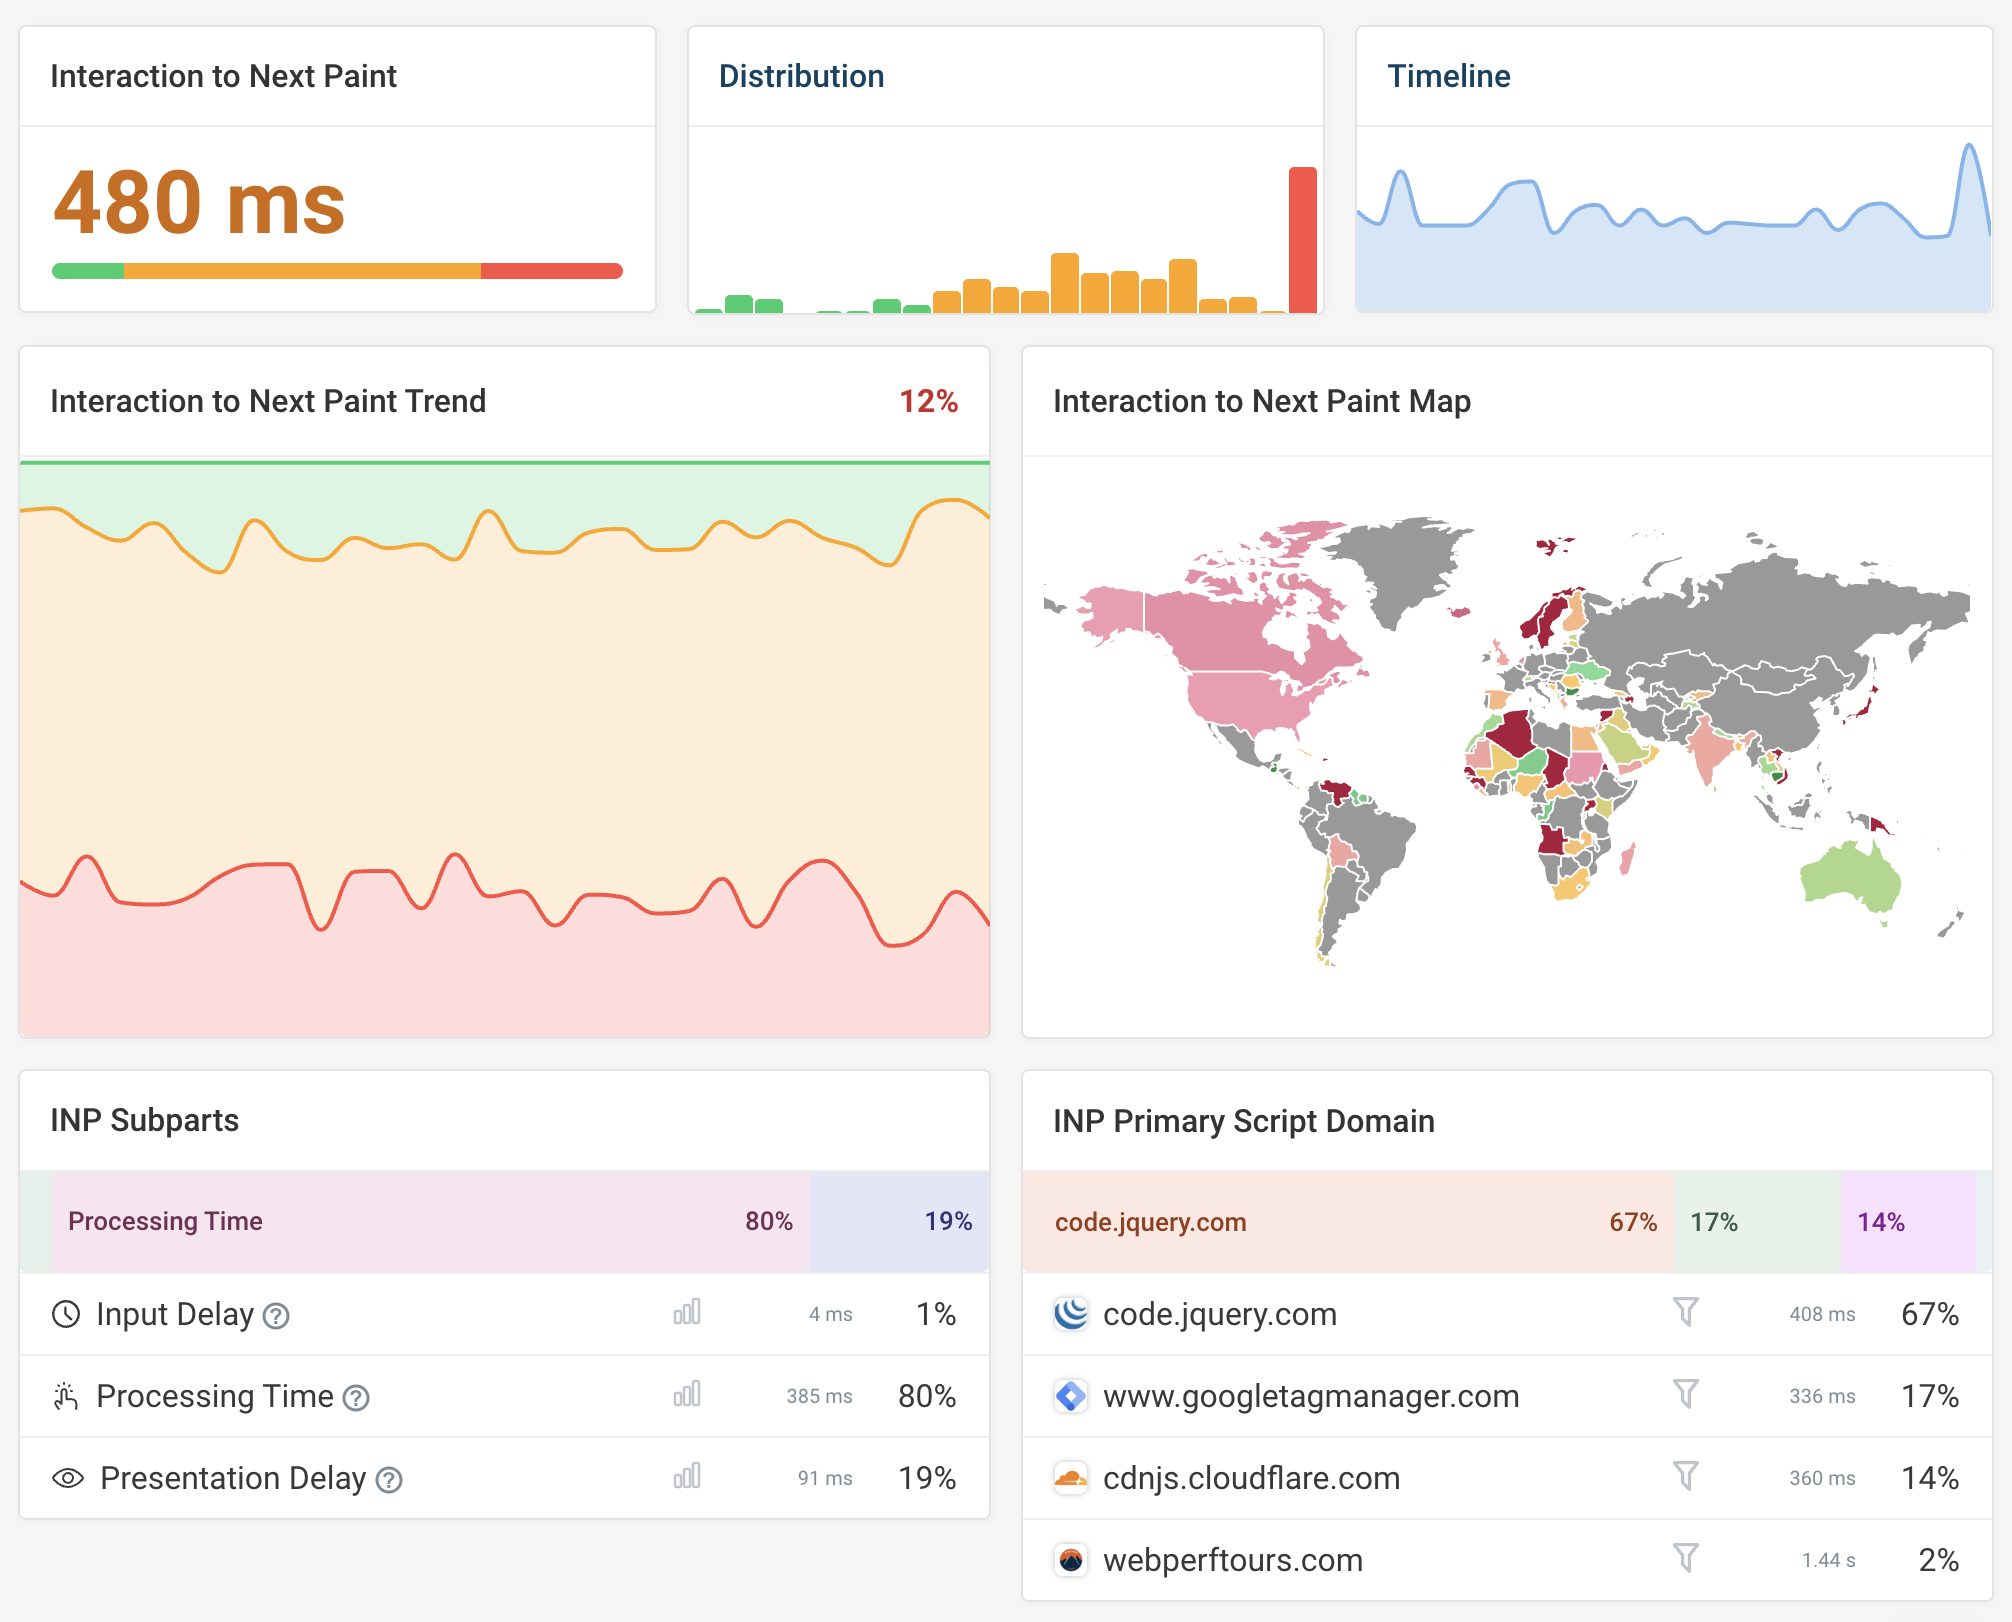
Optimize Interaction to Next Paint

See what page elements cause slow interactions and what scripts delay UI responses.

RUM dashboard screenshot
”DebugBear delivers the best stats for before and after changes in exquisite detail. It also shows clear and easy to find data for Google's Web Vitals.
Web peformance monitoring user profile picture
Tony Cosentino
Owner at The WP Guy
The WP Guy logo
”The reporting data is very helpful in pinpointing what causes site speed issues – immediately actionable. It's well above and beyond the info you get from Lighthouse and the performance tests through Chrome.“
Web peformance monitoring user profile picture
Loren McDonald
IT Director
Manncorp logo
The most actionable-info packed page speed visualization available. DebugBear provides unique features that are crucial to debugging complex issues, like request-chain visualization."
Web performance testimonial photo
Robin Marx
Web Protocol and Performance Expert
Akamai logo
”DebugBear's alerts are our early warning system. They catch new scripts that could slow us down before they become a problem.”
Web peformance monitoring user profile picture
Ryan Sullivan
Chief of Staff at SiteCare

Get set up in minutes.

No credit card required.
Start Free 14-Day Trial

You are using an old browser that is not supported anymore. You can continue using the site, but some things might not work as expected.