How To Measure And Reduce Script Evaluation Time
Script evaluation increases the work browsers have to do when loading your website. This can impact your Core Web Vitals metrics, which Google uses to measure user experience and which can influence search result rankings.
In this article we'll explain what script evaluation is, how to measure it, and what you can do to reduce it.
What is script evaluation?
Script evaluation is CPU processing work that's related to running JavaScript code on your website. This code can be embedded directly in your HTML or loaded via separate file downloads.
If your website spends a lot of time evaluating scripts your website may load more slowly, causing a poor Largest Contentful Paint score. When visitors interact with your page while a script is being evaluated that also delays the Interaction to Next Paint metric.
The term "script evaluation" isn't super precise, and different tools and online resources use a broader or narrower definition:
- Broad definition: any time spent running JavaScript code
- Narrow definition: time spent running a script immediately after it was loaded
How to measure script evaluation
You can measure script evaluation time using many website performance tools, for example:
- Google Lighthouse
- PageSpeed Insights
- Chrome DevTools
- DebugBear
Script evaluation in Lighthouse
You can test your website with Google's free Lighthouse tool to see how much time is spent on script evaluation when loading your website.
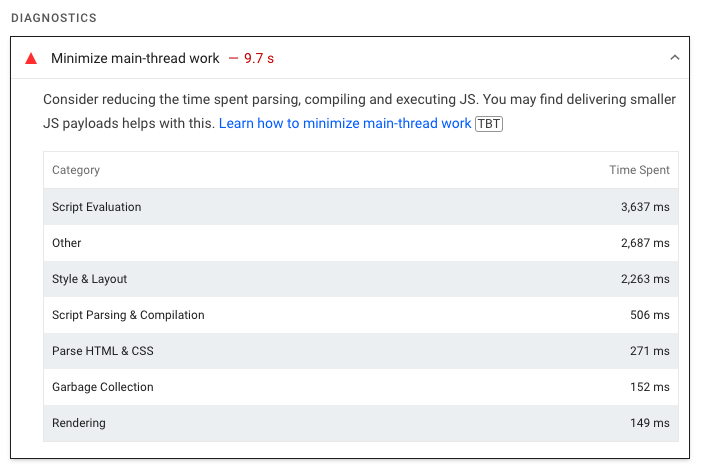
Script evaluation time is reported in two different places. The first place is the Minimize main-thread work audit, which tracks how much CPU processing happens when loading the page and breaks it down into categories like script evaluation or rendering.
Lighthouse uses the broad definition, so script evaluation time doesn't just include the initial time spent running a script but also other work like event handling and timeouts.
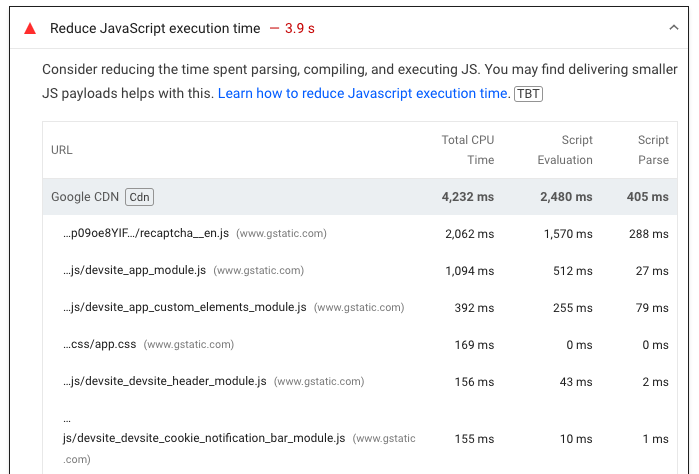
You can also look at the Reduce JavaScript execution time audit, which breaks down script evaluation and other scripting related tasks by script URL.
What's the difference between Script Parse time and Script Parsing & Compilation?
Both scripting-related audits we've mentioned separate time spent on running code from time spent parsing and compiling it. (That means processing the JavaScript code into something that can be run on a CPU.)
The Reduce JavaScript execution time audit mentions just Script Parse time, with no reference to compilation. However, it includes the same types of processing as the Script Parsing & Compilation category of the main thread work audit.
In the Lighthouse source code, script evaluation is referred to as just scripting, while the Script Parse column displays the scriptParseCompile value.
Script evaluation on PageSpeed Insights
PageSpeed Insights is built on top of Google's open source Lighthouse project, so you can find the audits discussed above in the Diagnose performance issues section.
Evaluate script in Chrome DevTools
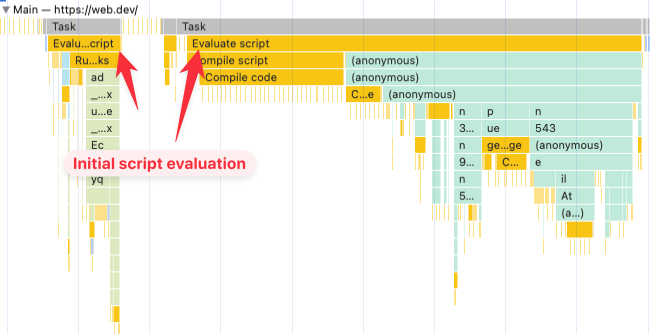
Another way to measure script evaluation time is to use the Performance panel in Chrome's developer tools.
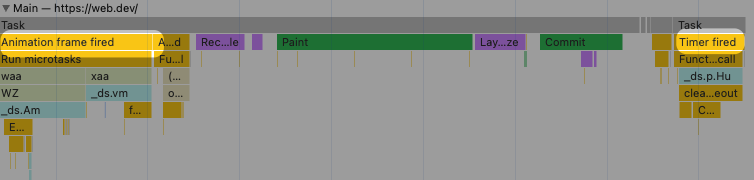
After recording a performance profile, scripts that are run for the first time after loading are marked as Evaluate script.
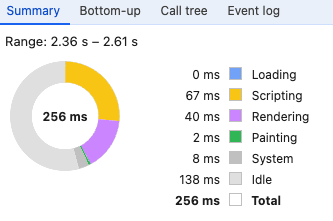
DevTools uses the narrow definition here! If you're looking for all types of scripting work, including code that runs after a timeout or after loading data, you can check the Summary section below the performance flame chart and look for the overall Scripting value.
For other types of scripting work beyond the initial evaluation you'll see a more nuanced name, for example "Animation frame fired" or "Timer fired".
Script evaluation in DebugBear
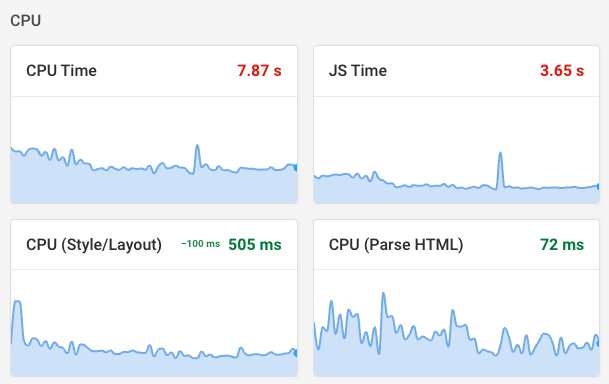
If you run a free website test with DebugBear or use it to monitor your website speed, you can find CPU metrics like script evaluation ("Run JS") or parse/compile time in the Metrics tab of your test result.
Does script evaluation include time spent loading the script?
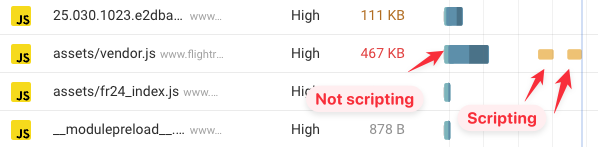
Script evaluation only counts CPU processing work done on the main thread. It does not include time spent loading the script code over the network.
How to reduce script evaluation time
There are three main ways to reduce script evaluation on your website:
- Remove unnecessary scripts
- Reduce code size
- Optimize your code to run faster
Remove unnecessary scripts
To minimize script evaluation time on your website, check the Lighthouse report to identify what scripts contribute the most CPU processing work. Then check whether these scripts are necessary, and whether they need to be loaded on all pages.
You'll often find that third-party code, like embedded widgets or marketing scripts, takes a lot of time to run on your website. Check whether these third-party tools are actively used.
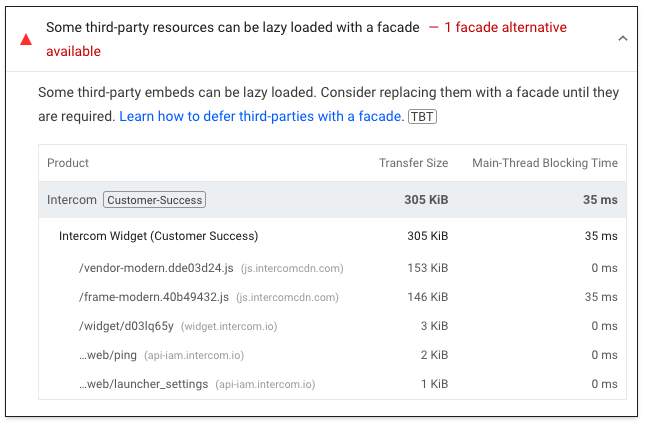
Sometimes you can also only load specific scripts when necessary, using a facade pattern. For example, you might only need to load the code for a chat widget once a visitor clicks on the chat bubble. Lighthouse can help you identify these types of scripts using the "Some third-party resources can be lazy loaded with a facade" audit.
Reduce code size
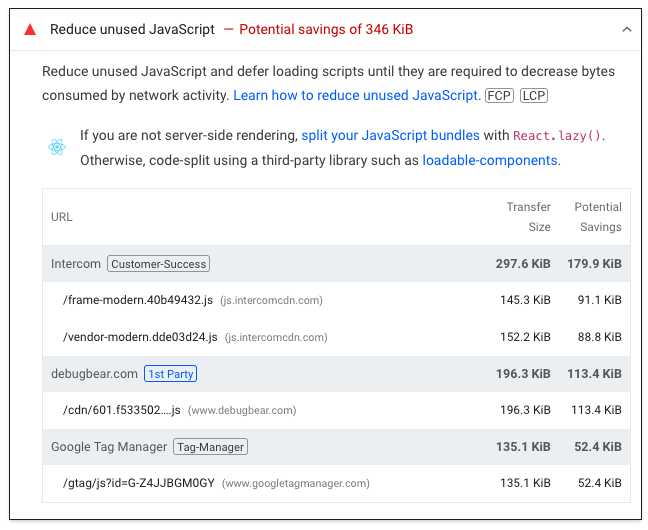
If a script is required, check if you can reduce its size. Many websites load a lot of code that is unused on the website. You can detect this code with the "Reduce unused JavaScript" audit in Lighthouse.
Your development team can also inspect their JavaScript bundle size to identify code that's loaded but not necessary on every page.
Optimize your code to run faster
Finally, you can optimize the JavaScript code itself to run faster. A good starting point here is to record a profile in DevTools to see what the browser is actually spending time on.
Identify any long tasks and what scripts are contributing to them. Then check the source code to see what the script is actually doing at that point.
Does delaying JavaScript loading reduce script evaluation time?
Some websites will recommend that you use the defer script attribute to reduce script evaluation time. This is a good idea for improving page load time, because it ensures the script doesn't block rendering.
However, it will not reduce script evaluation time! Deferred scripts run later than non-deferred scripts, but they still need to be evaluated when loading the page.
How can script evaluation impact Interaction to Next Paint?
Script evaluation contributes to your INP score in two ways:
- By delaying how quickly your website can start handling interactions
- By making interaction handling take longer
If a visitor tries to interact with your page while the browser is busy evaluating unrelated JavaScript code, then the interaction can only be handled once the existing task has completed. This contributes to the input delay component of Interaction to Next Paint.
After that the browser needs to run all applicable event handler code. That includes event handlers that are directly attached to the element as well as any global handlers added by analytics tools.
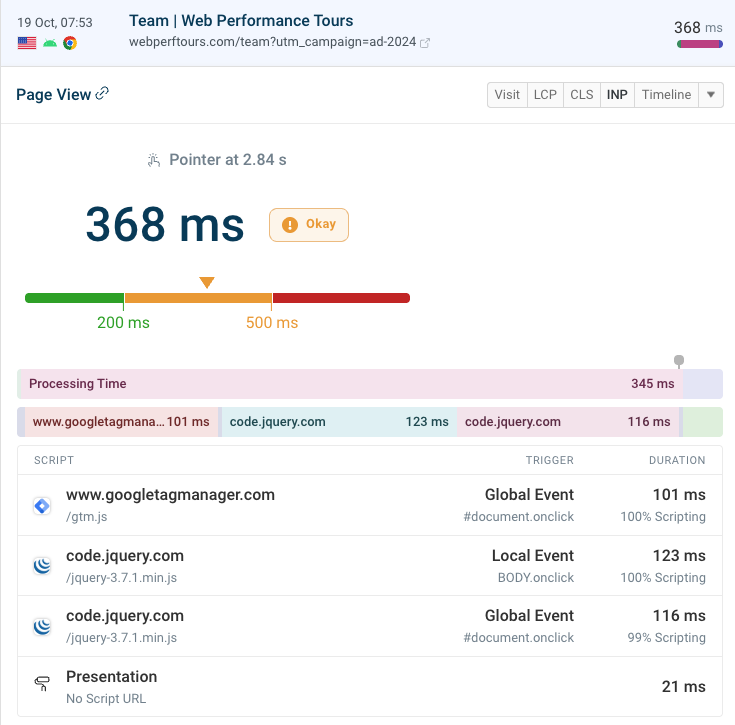
You can see an example of a global handler here. Three different scripts run in response to the click on the page, delaying the next visual update.
Deferring scripts is good for page load performance. But sometimes it can actually make INP scores worse. The deferred script runs after the page has rendered, at a point where the user is more likely to start an interaction, causing input delay. (Deferring scripts is still a good practice though.)
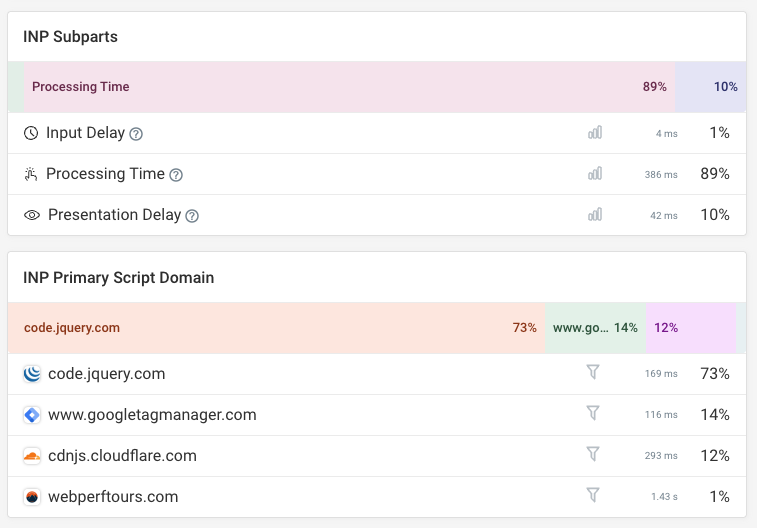
DebugBear real user monitoring provides insight into what scripts delay user input. We use Chrome's Long Animation Frames API to show what specific scripts slowed down an interaction response.
Measure script evaluation time in real user monitoring data
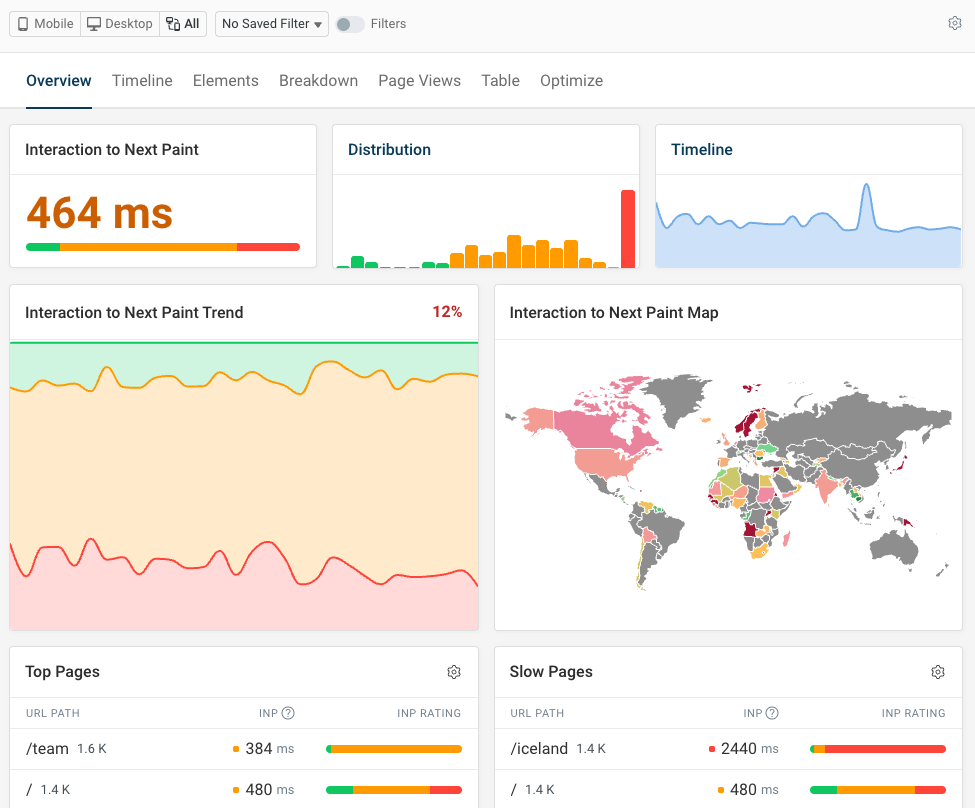
DebugBear's real user monitoring product can track website performance over time. That includes all three Google Core Web Vitals, with detailed reporting for page load time, visual stability, and interaction responsiveness.


Monitor Page Speed & Core Web Vitals
DebugBear monitoring includes:
- In-depth Page Speed Reports
- Automated Recommendations
- Real User Analytics Data