Google CrUX data impacts search rankings, but it's not always clear how to read the data. Data is reported in different tools covering different time periods and website URLs.
This article takes a look at different CrUX data sources and how to interpret the data from them.
What is the Chrome UX Report?
Google's Chrome UX Report (CrUX) provides user experience (UX) data for most websites on the internet, focusing on website performance metrics.
This means website operators can know how fast their website is for their visitors without having to install a real user monitoring tool.
Google also uses this data as a search result ranking factor.
CrUX data on PageSpeed Insights
When running a website speed test with Google PageSpeed Insights, the CrUX data is shown under the "Discover what your real users are experiencing" heading.
What do the metrics mean?
- Google continuously collects real user data and then aggregates this over a specific time period
- The values reported are the 75th percentile of visits
- PSI always reports data for a 28-day period
- In addition to that there's a 2-day data delay
You can see an example in this screenshot. I ran this test on the 5 January 2025. The period covered by the data spans from 7 December 2024 to 3 January 2025.
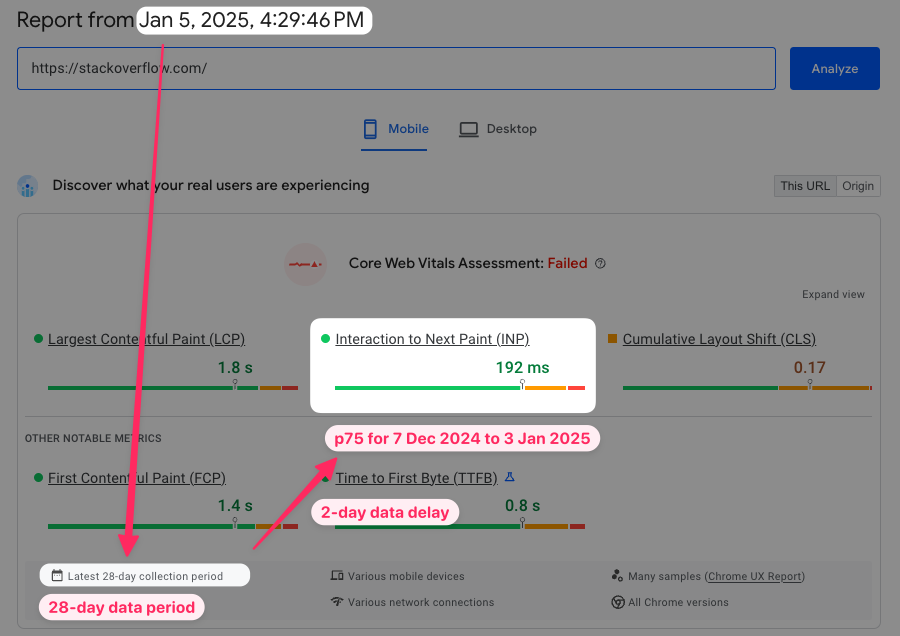
The Interaction to Next Paint value is reported as 192 milliseconds. Because this value reflects the 75th percentile of experiences we know that 25% of visitors waited longer than that for UI updates after an interaction, while 75% waited less than that.
After reading this post, Google has added the data CrUX data collection period on PageSpeed Insights 🎉
Just click on the question mark next to Latest 28-day collection period to view what date range is covered.

This URL vs Origin toggle
PageSpeed Insights provides an option to view either URL-level or origin-level data:
- This URL: CrUX data for this specific page on the website
- Origin: Data for all pages across the entire website
You may find that your website as a whole is fine, but that visitors have problems on specific pages.

Only pages with enough traffic will report page-level data. Otherwise this message will be shown:
There is insufficient real-user data for this URL. Falling back to aggregate data for all user experiences on this origin instead.
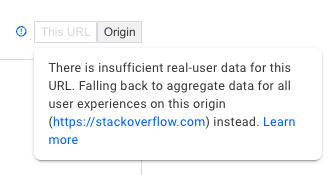
Sometimes all specific pages may show good performance, but the website origin as a whole shows a poor experience.
This would suggest that your most popular pages are fine but that there are many specific pages that are slow. This could be happening because the popular pages are cached on a CDN or website server, while less popular pages have to be generated from scratch.
How big is the CrUX data delay?
CrUX data is only delayed by two days, but always covers a 28-day period. That means after making a change on your website it will take 30 days for the change to be fully reflected in new CrUX data.
However, within 3 days of deploying a change you will start to notice small changes to your data.
If we look at the lab data in DebugBear alongside the CrUX metrics we can see that the lab test metrics update instantly but that the CrUX data then gradually follows.
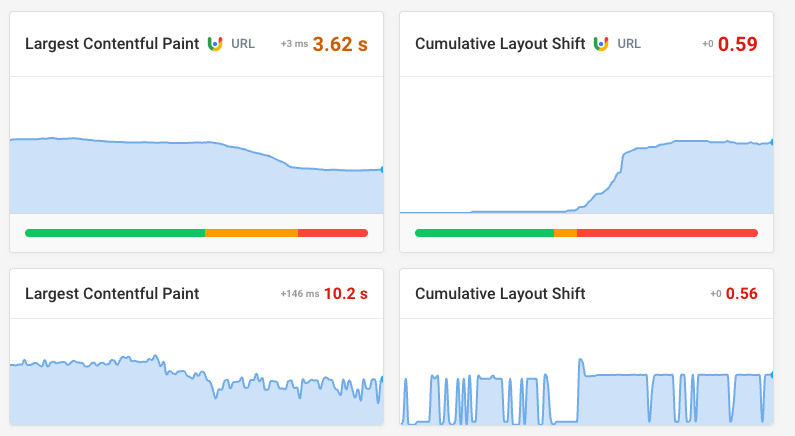
CrUX data in DebugBear
When running a free website speed test with DebugBear you can hover over the rating bar to see what date range is covered by the CrUX data.
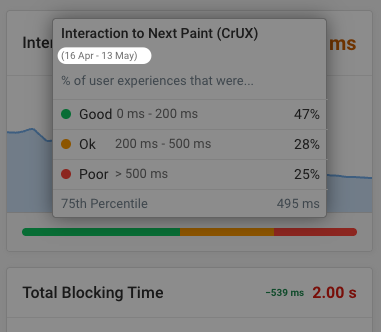
When viewing data in the CrUX trends dashboard you can hover over the chart to see what date range is covered by each value.
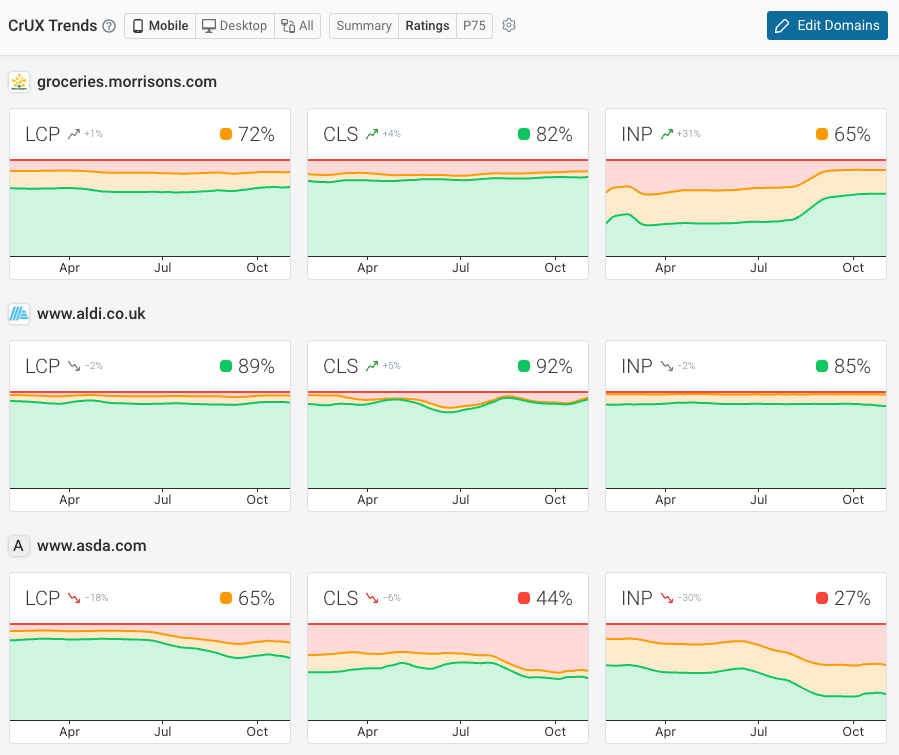
This data comes from the CrUX History API, so values only change once a week.
Additional CrUX metrics
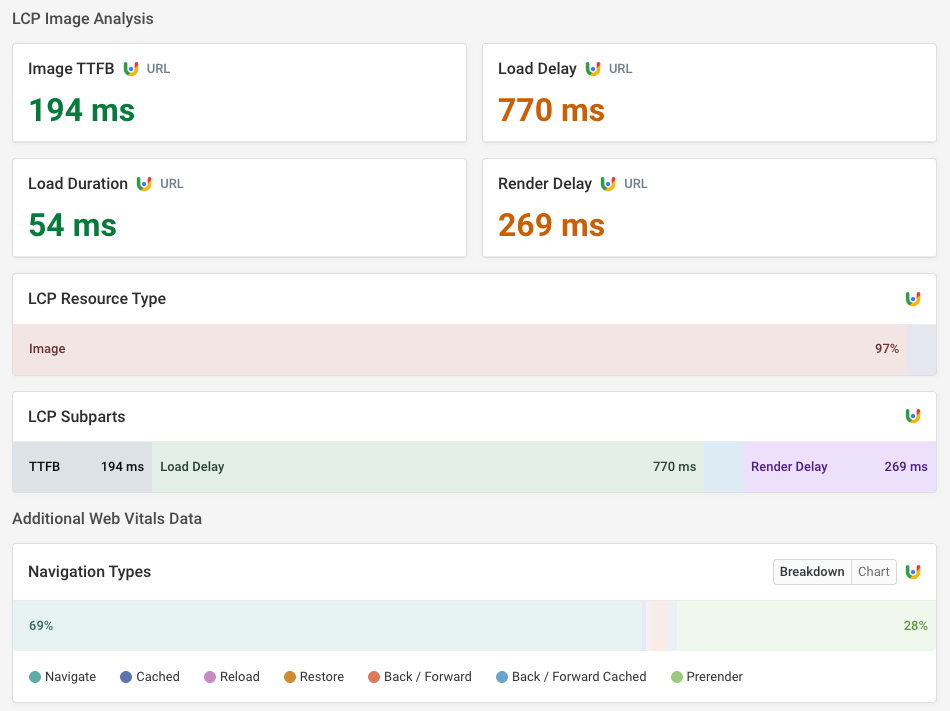
On top of the Core Web Vitals metrics, Google also publishes other data in the CrUX dataset:
- The Time to First Byte and First Contentful Paint metrics
- LCP subparts
- Navigation types (e.g. reload or back/forward navigation)
- Visitor network round trip time
You can find this data in the DebugBear Web Vitals tab.
BigQuery data
In addition to the CrUX data reported by tools like PageSpeed Insights, DebugBear, or CrUX Vis, Google also provides monthly data dumps with metrics for millions of websites.
This data is stored in Google BigQuery and tools like Treo Site Speed make it easy to access.
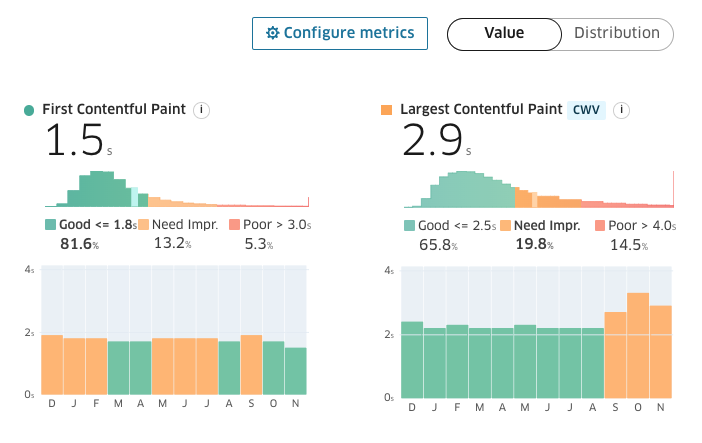
How is this data different:
- It always covers one specific calendar month
- New data is published about 10 days after the end of the month
- Only origin-level data is available
- Some additional data depth is supported, like a full histogram or geographical breakdown
CrUX data in Google Search Console
Google Search Console also reports data from the Chrome User Experience Report. This data also covers a 28-day rolling period.
How is Search Console data different? Instead of aggregating by URL or origin it instead reports data at a page group level. A page group is a group of URLs on your website that Google identifies automatically (often in a confusing way where it's not clear why pages are grouped together).
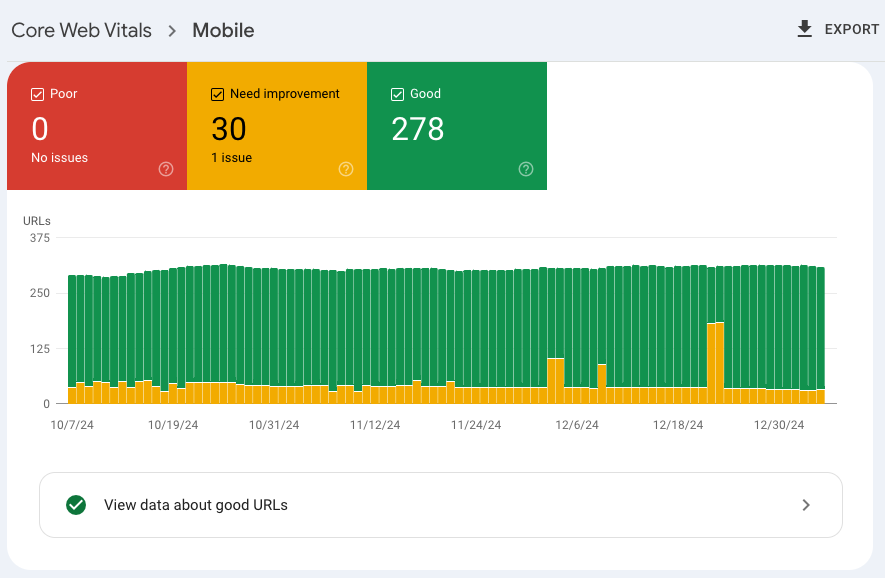
Just because a page is in a slow page group in Search Console that doesn't mean it's slow! Only the group as a whole provides a poor experience.
Likewise, a fast page group may still contain specific slow pages.
How to get real time Core Web Vitals data without delays
Google CrUX data always comes with some reporting delays. If you want real time reporting you can use a tool like DebugBear to run daily page speed tests and collect real user data from your visitors.
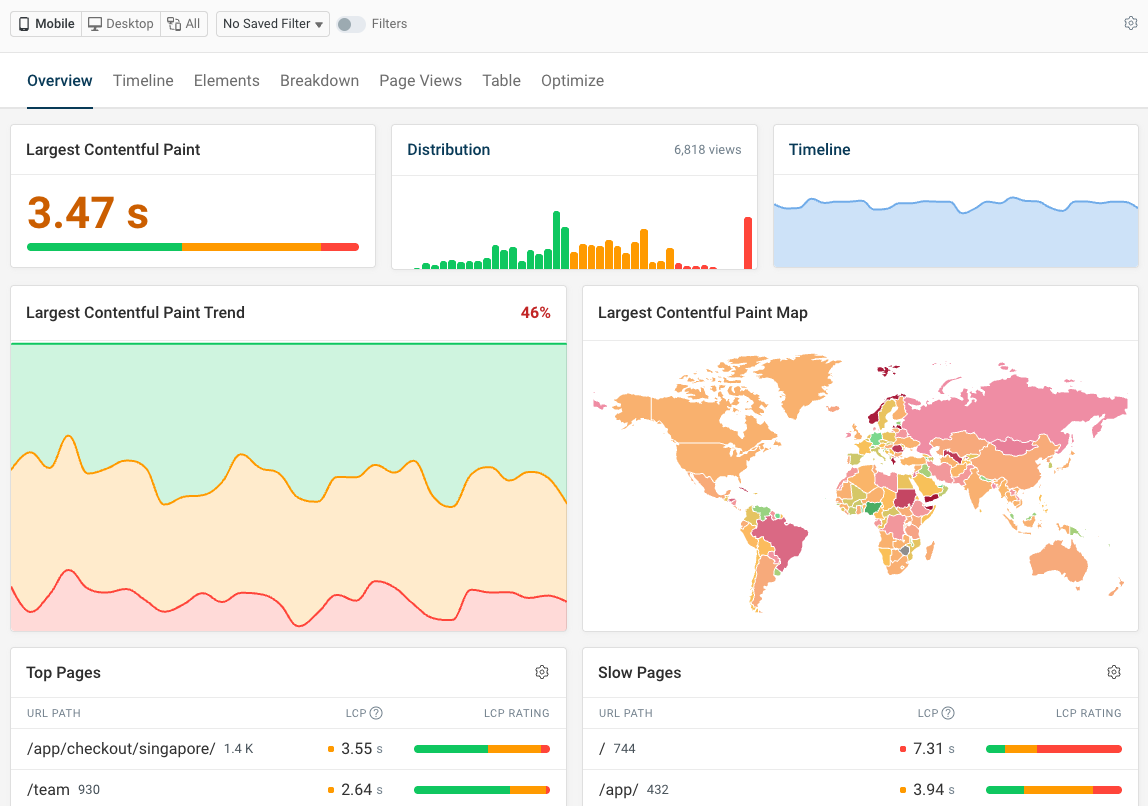
With DebugBear you will:
- See performance changes more quickly
- Get alerted to Core Web Vitals regressions
- Have more insight on how to optimize your website


Monitor Page Speed & Core Web Vitals
DebugBear monitoring includes:
- In-depth Page Speed Reports
- Automated Recommendations
- Real User Analytics Data
