
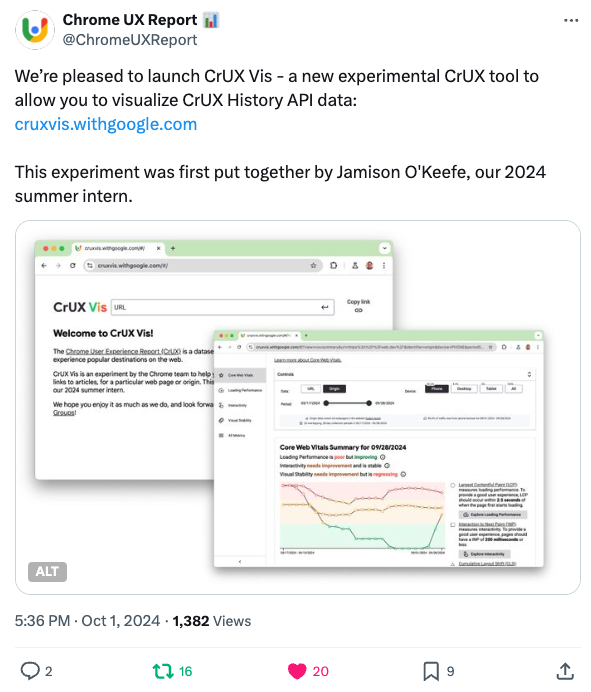
Google launched a new Core Web Vitals tool called CrUX Vis today!
While Google has provided historical CrUX data via an API for over a year, CrUX Vis provides an easy-to-access tool for viewing this historical Core Web Vitals data.
How to test your website with CrUX Vis
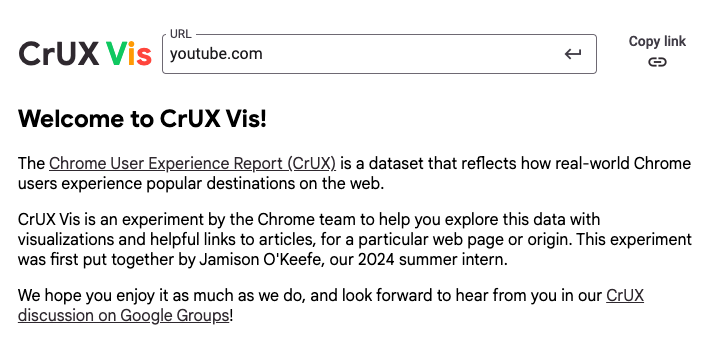
To view your Core Web Vitals data on CrUX Vis:
- Open cruxvis.withgoogle.com
- Enter your website in the URL field
- Press the Enter key
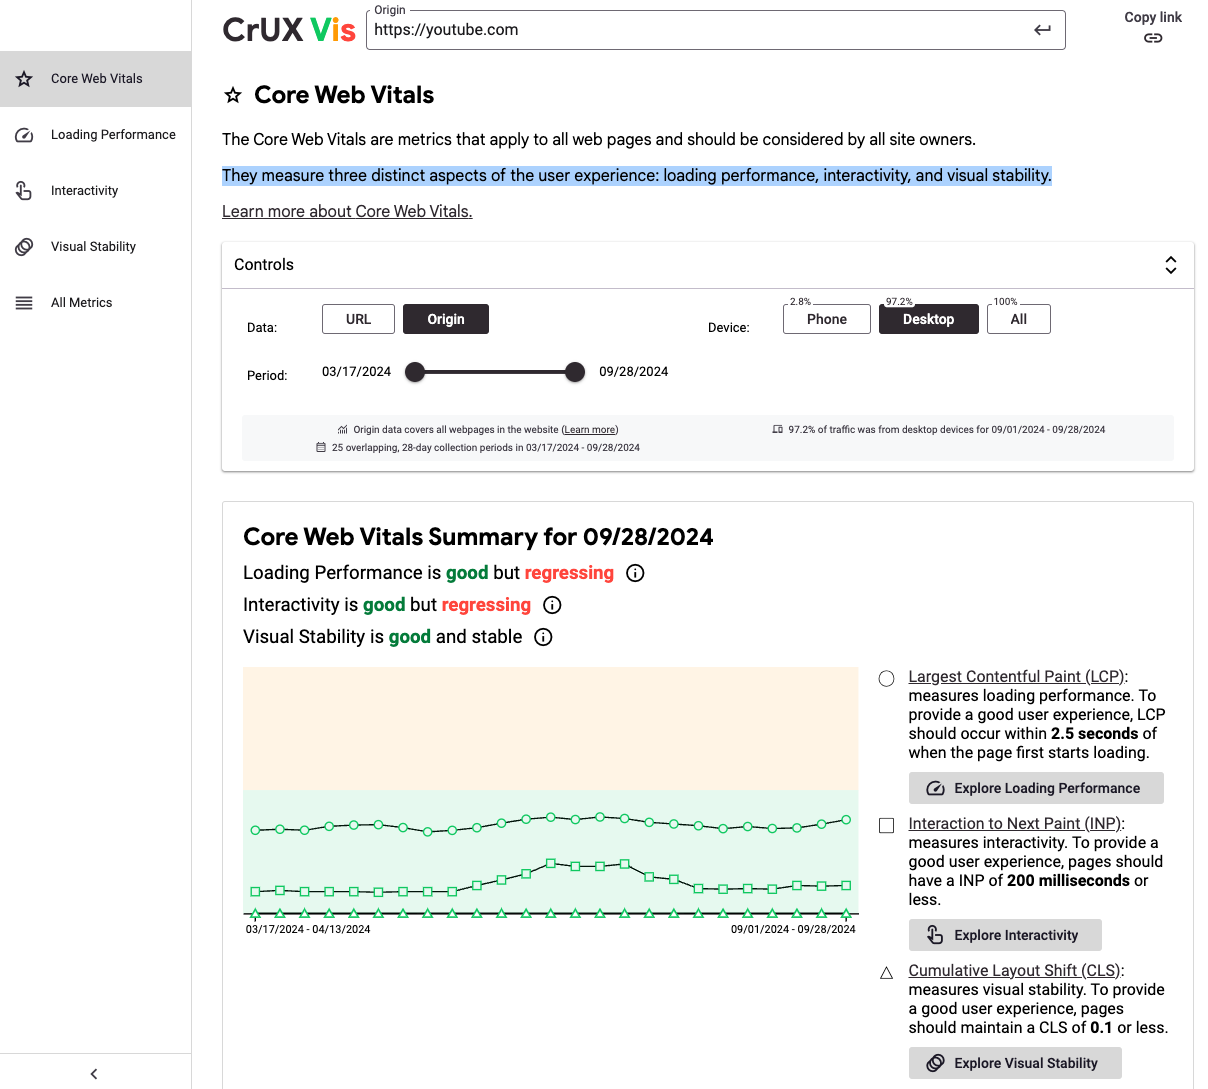
You'll then see how your three Core Web Vitals metrics have developed over the last 40 weeks.
What is the Chrome User Experience Report (CrUX)?
The Chrome User Experience Report is a website performance dataset that Google collects from real Chrome users. Data is only collected from users who are logged into their Google account, have enabled usage statistics reporting, and are using the Chrome browser.
On mobile, CrUX data is only collected on Android, not in Chrome on iOS.
CrUX data is not available for every website, only those that have enough traffic. If your website does not get enough traffic you'll see a "CrUX data is not available" message.

Google updates the historical CrUX data on a weekly basis; however, each value spans a rolling 28-day period. That means if you make a change on your website, your Web Vitals data will take 4 weeks to fully update.
What data does CrUX Vis provide?
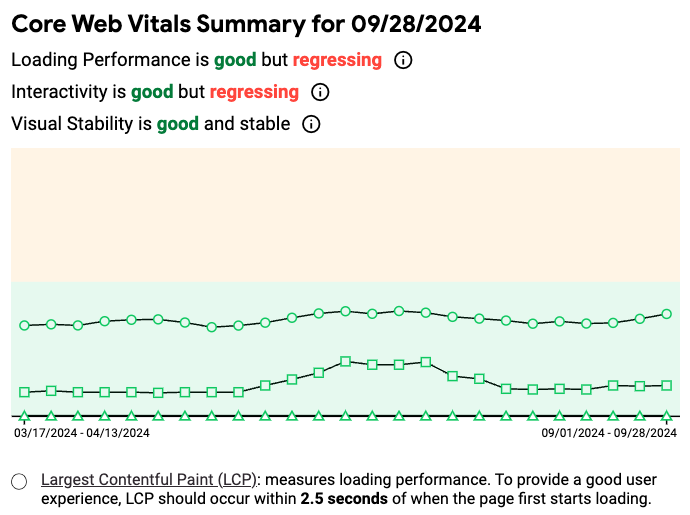
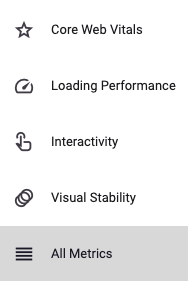
On the landing page, CrUX Vis provides a timeline with data for the three Core Web Vitals metrics:
- Largest Contentful Paint: Loading Performance
- Cumulative Layout Shift: Visual Stability
- Interaction to Next Paint: Interactivity
CrUX Vis also tells you whether your website is improving or regressing on these metrics.
The CrUX Vis sidebar provides a way to view more details on each of the three metrics.
Configuring what data to display
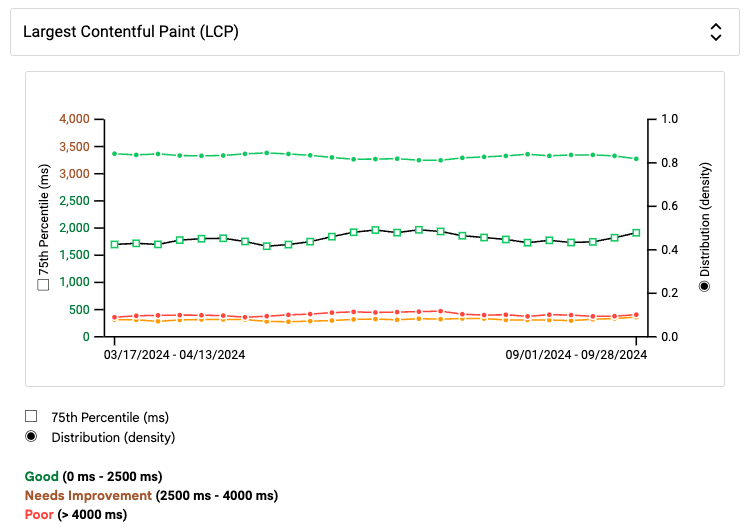
By default, Google's new CrUX data tool shows the 75th percentile for each metric. That means if your LCP score is 1.5 seconds, then 75% of visitors wait no more than 1.5 seconds, while another 25% wait longer.
However, in the individual metric tabs, CrUX Vis also provides an option to view distributions of experiences rated as Good, Needs Improvement, or Poor.
Loading Performance Detail
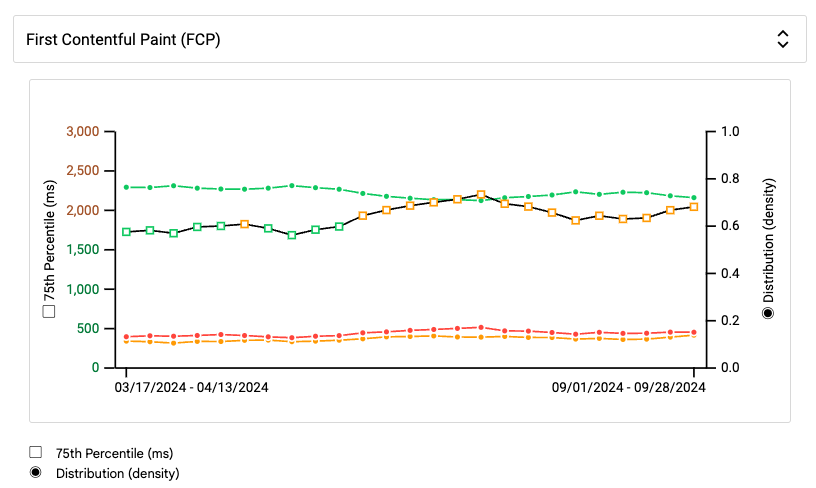
In addition to the Largest Contentful Paint metric, you can also see other metrics that are relevant for understanding and optimizing your website performance.
For example, you can view the First Contentful Paint metric or the Time to First Byte. These two metrics can provide insight into what's holding back your main page content from appearing.
For example, if the First Contentful Paint is high you'll want to check if there are many render-blocking resources on your website. If the Time to First Byte is slow, that means you need to work on your server response time.
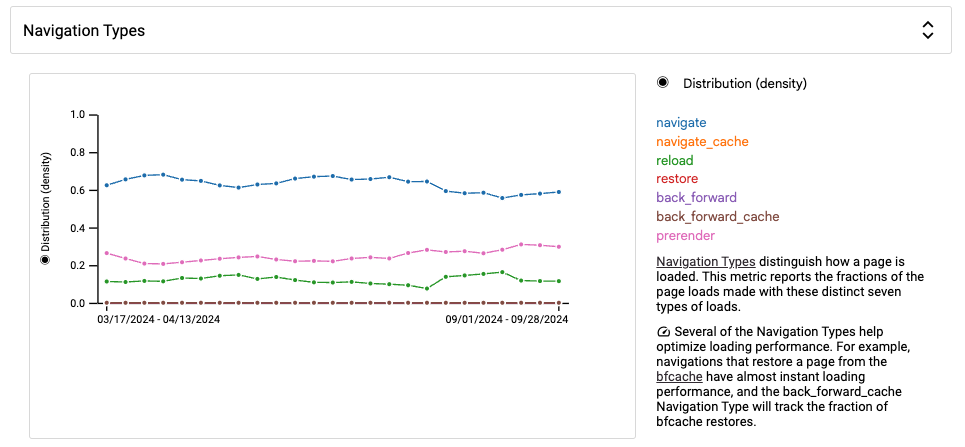
CrUX Vis also provides information on how users are accessing your website, for example, the device form factor or the navigation type.
Navigation Types tell you whether your website benefits from HTTP caching, content prerendering, or what percentage of visits could benefit from better support for the back/forward cache.
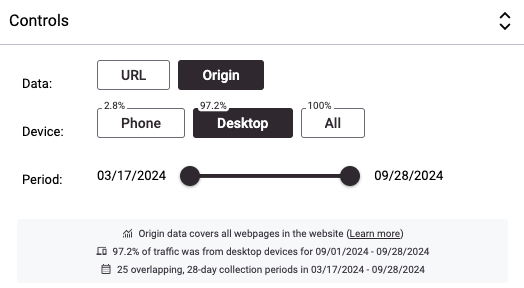
Filtering CrUX Vis data
The tool offers various filtering options, for example, by date range.
You can also choose to view only mobile or desktop data. Conveniently, you're also shown what percentage of your traffic comes from mobile or desktop devices.
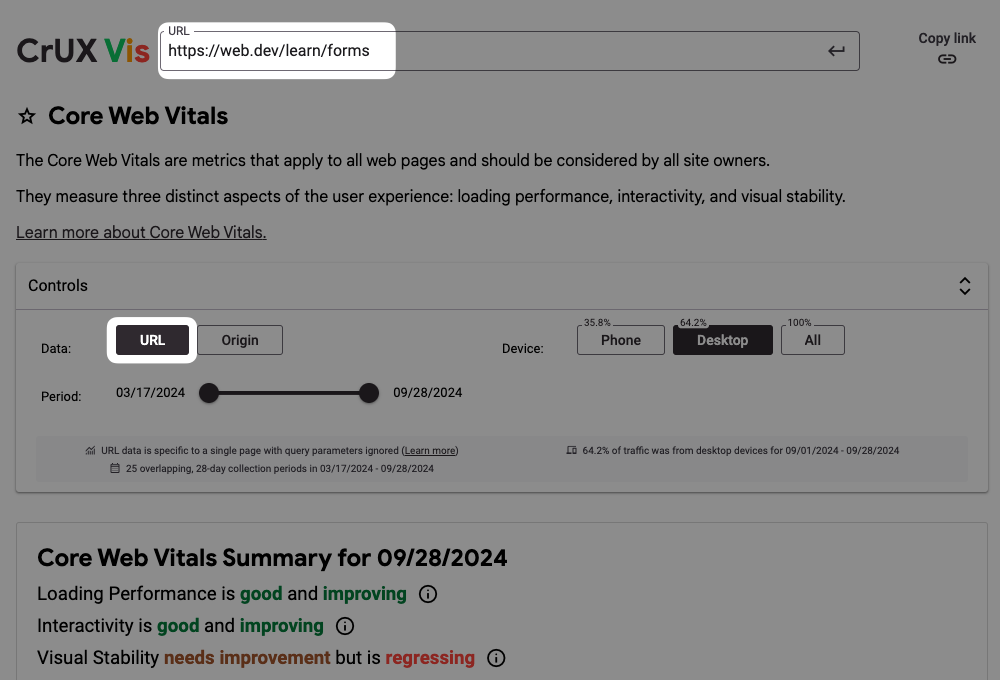
Viewing URL-level data with CrUX Vis
Similar to PageSpeed Insights, CrUX Vis can show you not just origin-wide data but also data for a specific URL. However, keep in mind that only URLs with enough traffic will have URL-specific data.
How does CrUX Vis fit in with other tools
CrUX Vis is a bit more advanced than PageSpeed Insights, as it includes historical data and greater depth. However, unlike PageSpeed Insights, it doesn't offer specific performance recommendations. In PSI, these are provided by running a Lighthouse lab test.
Google's CrUX Dashboard provides the ability to view historical data; however, it is less user friendly and only provides monthly instead of weekly data.
Try out the free website speed test from DebugBear if you want in-depth lab results as well as current and historical CrUX metrics!
DebugBear monitoring can keep track of Core Web Vitals CrUX data as well as running scheduled synthetic tests.
Create a CrUX dashboard with competitor data
DebugBear's CrUX Trends feature lets you pick a number of websites in your industry to set up a competitor dashboard. You can see rating data across all three Core Web Vitals metrics.
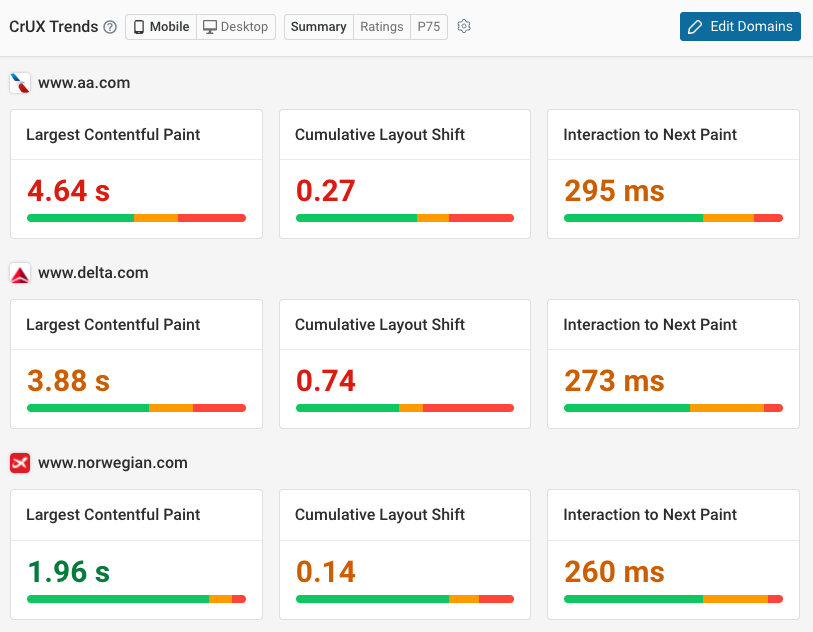
By switching to the Ratings view you can instead see how performance has trended historically and how many visitors have a good experience.
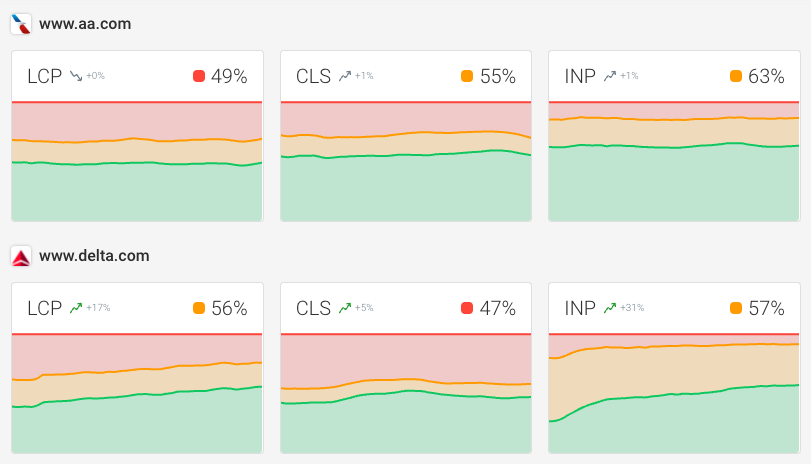
You can also break down the Largest Contentful Paint metric into the Time to First Byte and First Contentful Paint components, and see how those values have changed over time.
Here we're looking at the P75 view, which shows 75th percentile scores over time.

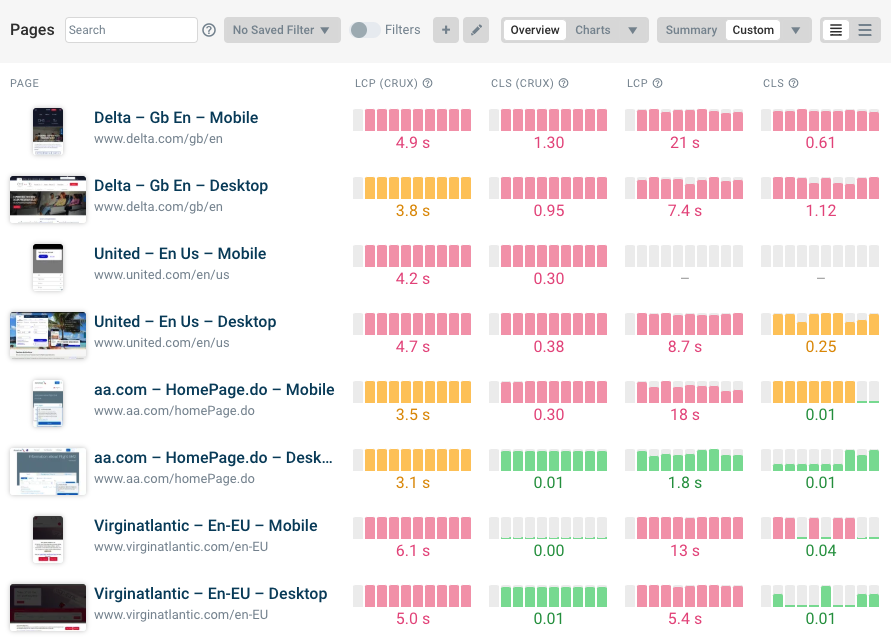
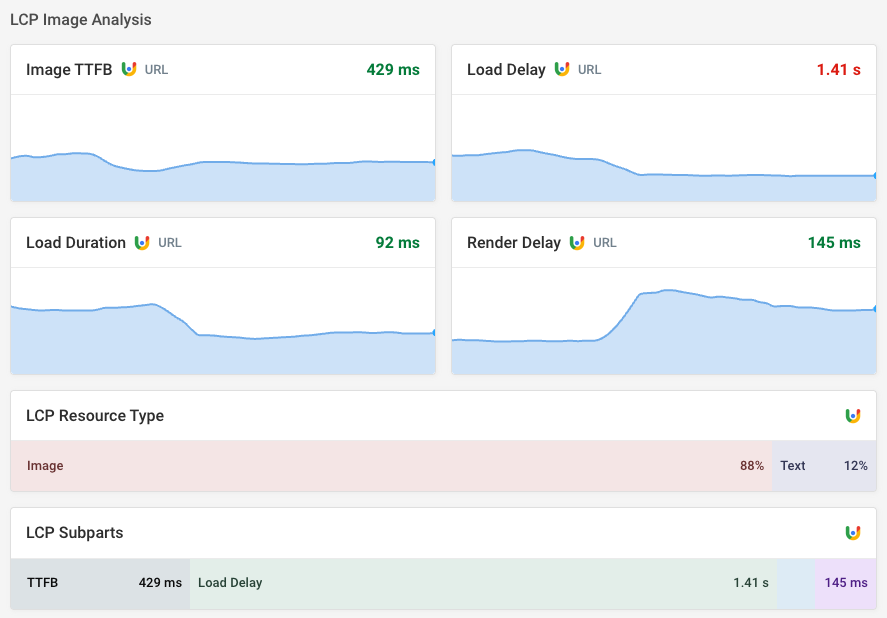
Tracking LCP subparts data
Google's CrUX report also includes data on the four LCP subparts that contribute to the overall Largest Contentful Paint score. Set up a scheduled synthetic test on DebugBear to regularly collect lab and CrUX data.
The CrUX report only provides subpart data when the largest content element on the page is an image. You can see how often the LCP resource type is an image or text element by checking the LCP resource type breakdown.
Real user Core Web Vitals monitoring for your website
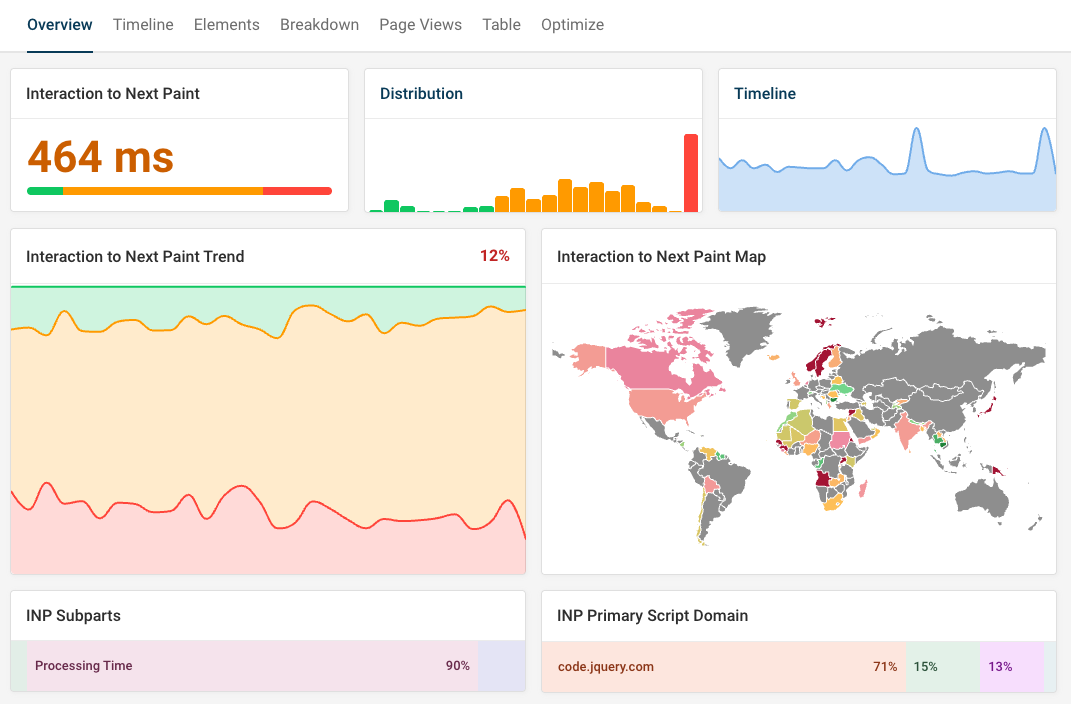
To get the most insight into your Core Web Vitals, you can set up real user monitoring on your website. That way, you don't just get to track high-level web vitals data, but can also view breakdowns across devices, countries, or browsers.
For the Interaction to Next Paint metric, you also get helpful debug data: see what page elements caused slow interactions and what scripts delayed them.
Sign up for a free DebugBear trial to get comprehensive Core Web Vitals monitoring across lab test results, CrUX data, and real user analytics.


Monitor Page Speed & Core Web Vitals
DebugBear monitoring includes:
- In-depth Page Speed Reports
- Automated Recommendations
- Real User Analytics Data