Reduce initial server response time is one of Lighthouse's performance audits. It evaluates the time it takes for the browser to receive the first byte of the root document (usually the main HTML file) from the server, excluding the connection setup time.
To pass the Reduce initial server response time audit, you'll mainly need to focus on your hosting environment, caching strategy, and backend performance optimization.
In this article, we'll look into what initial server response time is exactly, how it hurts web performance if it becomes too long, and how you can pass this Lighthouse audit.
What Is Initial Server Response Time?
Initial server response time is the second phase of the full Time To First Byte (TTFB) value, which is one of the additional Web Vitals Lighthouse tracks beyond Core Web Vitals.
It equals the time it takes for the server to receive the first HTTP request from the browser (on an already established connection), generate the root document, and send it to the browser.
Initial server response time refers to the root document, which is the first file the browser requests after a user enters a URL into the address bar. This is usually the main HTML file, but it can also be a PDF, XML, SVG, or another document. When optimizing specifically for the Reduce initial server response time audit, you only need to focus on this file.
Lighthouse (and Lighthouse-based web performance monitoring tools, such as DebugBear) reports initial server response time at the moment when the browser receives the first byte of the root document from the server.
The below diagram is from our TTFB documentation page. Initial server response time is the blue part of the chart, also referred to as HTTP Request TTFB:
As you can see above, initial server response time does not include:
- the time the browser needs to set up the connection, which consists of:
- connecting to the DNS (Domain Name Server) to get the IP address of the requested domain
- establishing a secure connection between the browser and server (TCP and SSL in the above diagram — however, note that HTTP/3 uses the QUIC and UDP protocols instead of TCP and SSL)
- the time the browser needs to download the full page content (note that the download time is not included in TTFB, either)
How to measure initial server response time
Measure server response time in Lighthouse
Google's Lighthouse tool, which powers PageSpeed Insights, shows the initial server response time as one of the Performance audits.
If the value is high, Lighthouse shows a "Server responded slowly" message under the document request latency audit.
Here the server took 2.5 seconds to respond to the request.
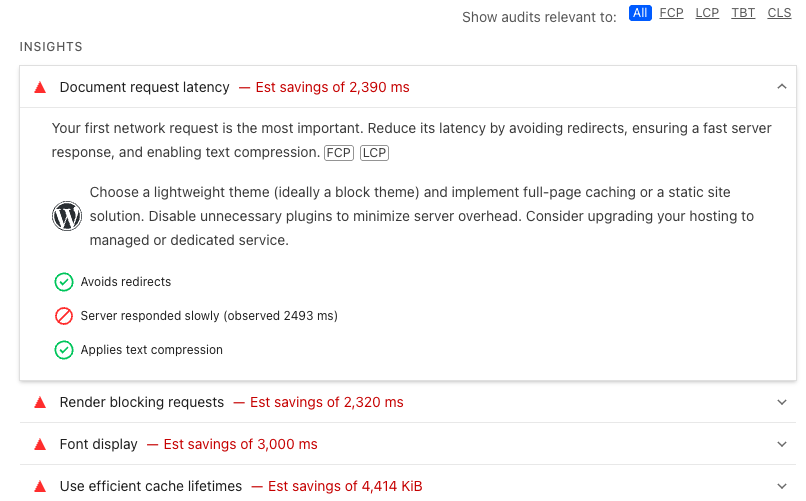
::: Lighthouse runs a throttling simulation to estimate page load time on a mobile network. However, the server responded slowly insights item reports the raw observed response time rather than the simulated one. :::
Measure server response time in DebugBear
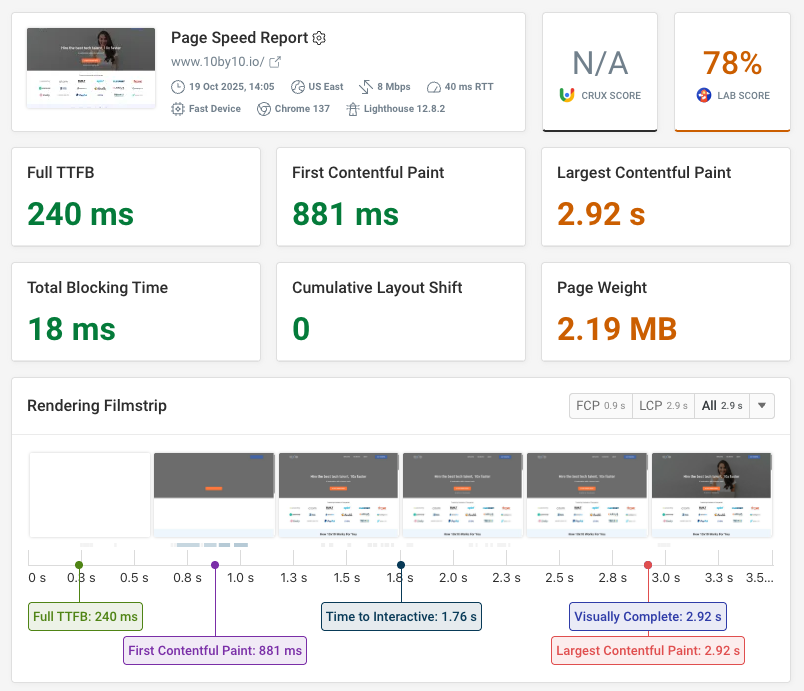
The DebugBear website speed test shows server response time as part of the Time to First Byte metric. This also includes time spent establishing an HTTP server connection.
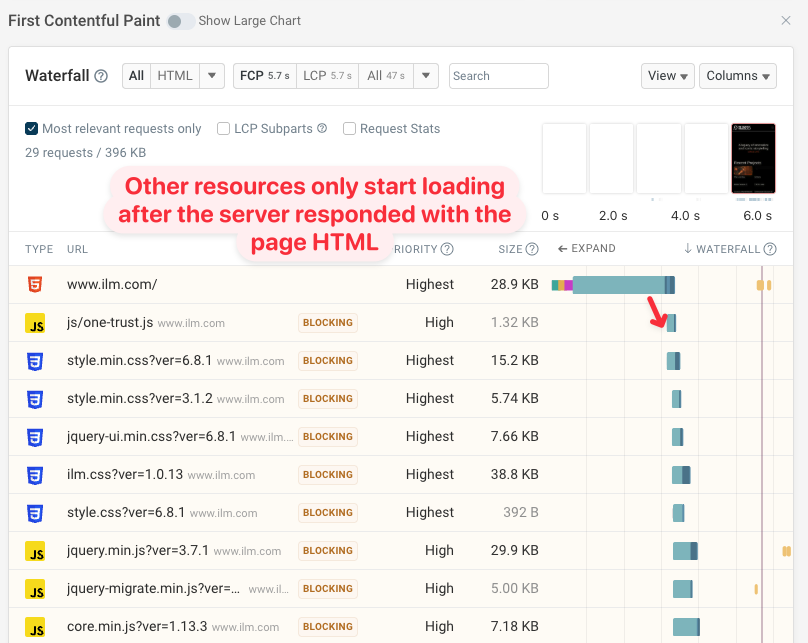
The waterfall view shows how the browser can only start requesting other resources once the HTML response has been received.
That means a slow server response slows down page load time overall.
Server response time in Google CrUX data
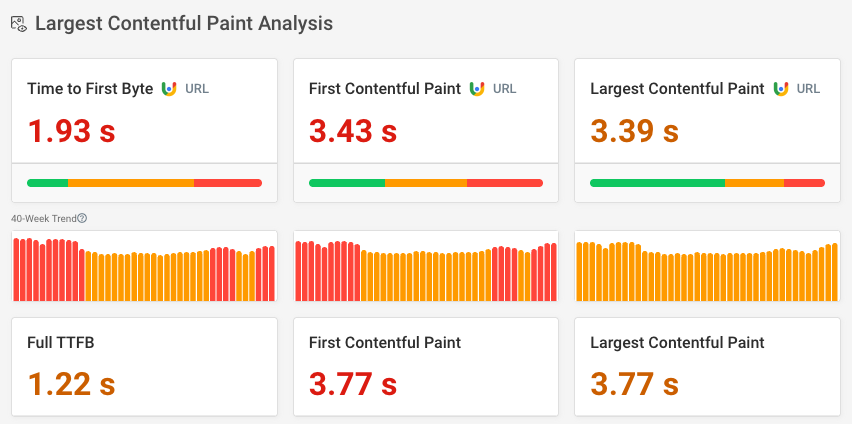
The Web Vitals test of the DebugBear speed test result shows real user server response time data based on Google's Chrome User Experience Report (CrUX).
You can also see how these metrics have developed over the past 40 weeks.
When Does Initial Server Response Time Get Too Long?
To pass the Reduce initial server response time audit, you need to keep its value below 600 milliseconds.
This is 75 percent of the passing threshold for Time To First Byte (i.e. 800 milliseconds), which is a reasonable goal, as the initial server response time is typically the longer part of TTFB.
Lighthouse flags the Reduce initial server response time audit using two colors:
- You get the grey (info) flag if you pass the audit (under 600 milliseconds).
- You get the red flag if you fail the audit (above 600 milliseconds).
Lighthouse can assign one of four flags (red, yellow, grey, green) to its audits, but it doesn't use all of them for every audit. Based on our experiments, it never assigns the green flag for web performance signals it considers the most important. The best you can receive for these audits is the grey flag.
For example, for Reduce initial server response time, you can only get the grey and red flags. Lighthouse uses other color combinations as well, e.g. the Avoid enormous network payloads audit can only be flagged in grey and yellow.
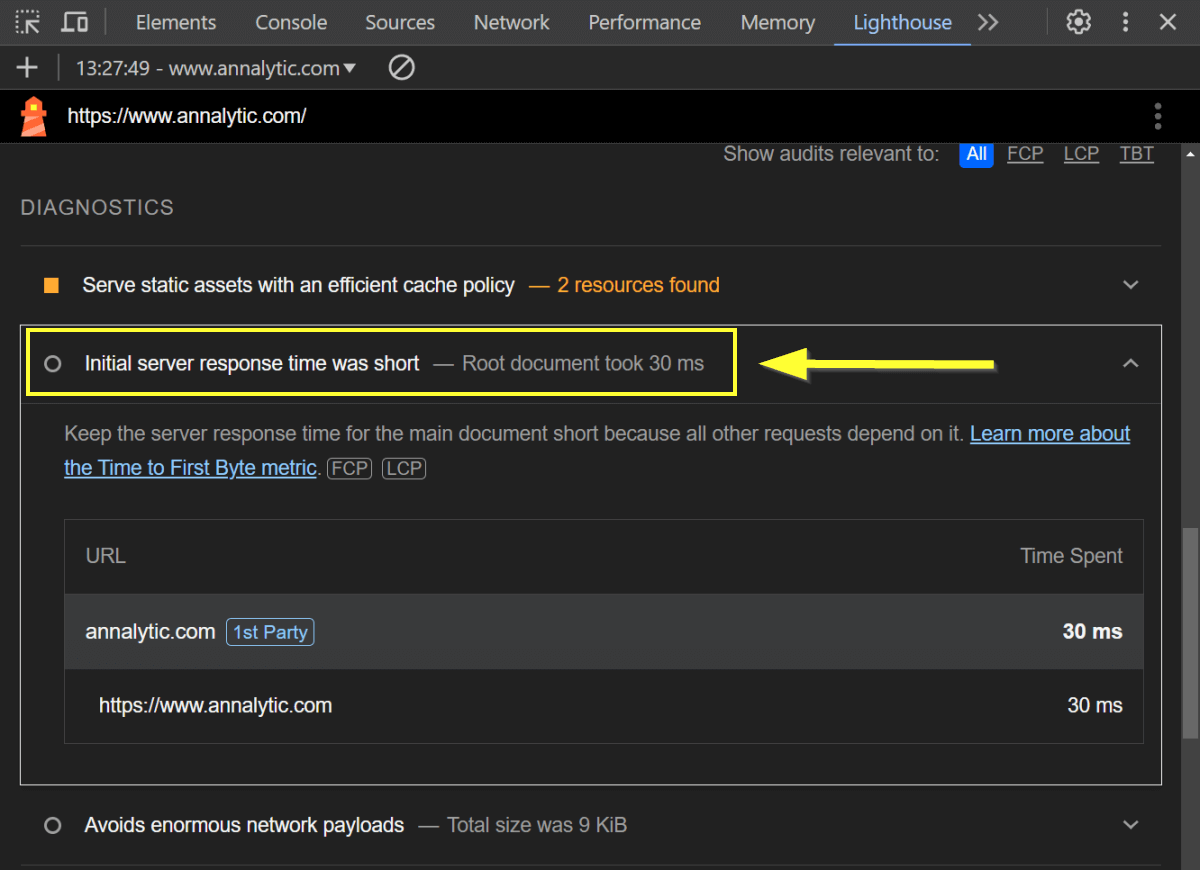
Below is the result from the mobile Lighthouse report conducted on my personal website in Chrome DevTools.
Since this is an extremely simple web page using SSG (Static Site Generation) with 11ty, which generates the HTML page at build time (so the root document is already prepared when the browser request arrives), the initial server response time was just 30 milliseconds. However, I still received the grey info flag instead of the green one:
Why Reduce Initial Server Response Time
A high value for initial server response time negatively impacts user experience and results in an increase in the following web performance metrics:
- Time To First Byte (TTFB) – TTFB measures the time between the browser's initial request and the arrival of the first byte of data of the requested file. As the second phase of TTFB is the initial server response time (see the explanation above), if the latter grows, TTFB will become longer as well.
- First Contentful Paint (FCP) – FCP quantifies the time between the browser's request and the appearance of the first pixel of content on the screen. As the first phase of FCP is TTFB, if TTFB grows, FCP will also increase.
- Largest Contentful Paint (LCP) – Lighthouse reports LCP when the largest content element above the fold has finished rendering. As the first phase of LCP is FCP, if FCP grows, LCP will have a higher value, too.
Since LCP is one of the three Core Web Vitals, consistently poor initial server response times may contribute to a drop in search engine rankings as well.
Now, let's see some practical recommendations that can help you reduce initial server response time.
How to reduce initial server response time
Depending on what causes delays, there are a number of techniques you can use to reduce server response time:
- Find a Fast Web Host
- Use a Content Delivery Network
- Implement Server Caching
- Optimize Your Backend Code for Performance
- Optimize Your Database Operations
Let's take a look at each of these techniques to see why they can help and what you can do to apply them.
1. Find a Fast Web Host
As I mentioned above, you'll need to mainly focus on server-side performance to pass this audit — and server-side performance hugely depends on hosting.
Ideally, you should find a web host that provides a fast, reliable, and scalable service. Improving your hosting conditions will help you reduce initial server response times as well.
Here are the most important things to look for when searching for a suitable hosting provider:
Isolated Resources
Choose a hosting plan that provides isolated resources dedicated to your website, whether it's:
- a VPS, which is short for Virtual Private Server and offers dedicated virtual resources on a physical server
- cloud hosting, which lets you scale resources up or down depending on traffic
- a dedicated server, which is a physical server that only hosts your website
Websites hosted on shared servers can be negatively impacted by high traffic or technical issues from other sites hosted on the same server.
Due to this, shared hosting is not recommended if you want consistently fast server response times. It's only suitable for smaller brochure sites and hobby projects, and even then, it's usually still a better option to set up a cheaper droplet on DigitalOcean or a similar service.
Performant Hardware
Check the technical details of the hardware your web host allocates to your website, including storage, CPU, and memory.
If you need to reduce initial server response times on your site, you can also consider upgrading your server stack.
High Uptime Percentage
Uptime percentage is an important web performance metric that receives less attention these days than it deserves. However, if your server is down, initial server response time will be infinitely long.
To ensure your server always responds to user requests, look for a hosting provider that offers an uptime guarantee (e.g. 99.9% uptime commitment).
Advanced Web Performance Features
Go for a hosting plan that includes additional web performance features, such as:
- support for the HTTP/3 communication protocol
- using modern HTTP text compression algorithms _(e.g. GZIP, Brotli, Zstandard, etc.)
- integration with content delivery networks
- various caching solutions
- ... and others
2. Use a Content Delivery Network
A Content Delivery Network (or CDN for short) stores copies of your static website files (e.g. HTML, CSS, JavaScript, images, etc.) on a globally distributed network of edge servers, so each of your website visitors can be served from the geographical closest location to them.
Adding a CDN to your hosting stack decreases latency, which reduces initial server response times, as the root file will travel from the server to your user's browser in less time.
Latency measures how long it takes for a network packet to move from one physical location to another. Network packets are tiny data units that the TCP/IP protocol divides each file into so that it can transmit it over the internet.
In the context of CDNs, latency is the time difference between the packet's departure from the edge server and its arrival at the user's browser. As an edge server is typically closer to the user than a server at a central location, the duration of the packet's journey (i.e. latency) will be shorter.
Some examples of reliable CDN providers are Akamai, Fastly, Cloudflare, Bunny CDN, and KeyCDN.
You have a couple of options to add CDN to your hosting stack, including:
- You can sign up for a CDN account and connect it manually to your website by following the CDN provider's documentation.
- These days, some hosting plans include out-of-the-box integration with one or more CDNs (e.g. Kinsta or Rocket.net) while others offer it as an add-on (e.g. Cloudways).
- If you have a WordPress site, bigger CDNs offer free integration plugins (e.g. CDN Enabler by KeyCDN or bunny.net by Bunny CDN).
3. Implement Server Caching
If you have a dynamically generated website (coded in a backend language such as PHP, Java, Node.js, Python, etc.), the server needs to put together the HTML page by executing the code, pulling data from the database, making API calls, and performing other actions.
Server caching stores copies of ready-made HTML files in a temporary location on the server. As a result, the server doesn't need to generate them on the fly and can respond to the browser's initial requests faster. Server caching can be especially useful for files that don't frequently change.
While you can't implement full page caching on each HTML file, as some pages (e.g. the homepage of a popular blog) often change, you can still cache parts of these pages, which will help your server generate the static HTML file faster — for example, you can cache frequently used database queries or API calls.
If you have a WordPress site, you can install a caching plugin that comes with server caching, such as LiteSpeed Cache, FlyingPress, or WP Rocket (note that some free plugins in the official WordPress repository only include browser caching).
CDNs (see above) are primarily large caches that store static content (e.g. the root HTML file) closer to users.
Implementing both CDN and server caching, you can create a flexible server-side caching strategy. You can cache full HTML pages on the CDN's edge servers while database queries, API calls, and other partial elements (e.g. headers, footers, sidebars, etc.) can be stored in the server cache.
To learn more about how CDN caching works, check out our Caching on a Content Delivery Network (CDN) article, too.
4. Optimize Your Backend Code for Performance
To reduce initial server response time, you can also audit and improve your backend (a.k.a. server-side) logic to help your server generate the HTML markup faster.
The optimization techniques you'll need to implement depend on the programming language you use. All popular backend languages and frameworks have their own best practices, which can help you improve (or, if necessary, refactor) your existing code base.
For server-side languages, it's also important to regularly update your server so that it runs the latest stable version of the language, as new releases frequently include performance optimizations. Many hosting providers do this automatically and display the version of the programming language your server uses somewhere in your hosting account.
In addition to regularly updating your backend language (e.g. PHP, Node.js, Java, etc.) and framework (e.g. WordPress, Laravel, Express.js, etc.), it's also important to use the latest stable version of your web server software (e.g. Apache, Nginx, etc.) to improve server-side performance.
To debug backend performance issues, you can use an application monitoring (APM) tool that runs on the server. APM is language-based, so you'll need to choose an APM tool that supports the backend language you use (e.g. PHP, Java, .NET, Node.js, Python, etc.). Some examples of the best APM apps are Raygun, New Relic, Datadog, Stackify Retrace, and others.
Frontend performance monitoring tools, such as DebugBear, allow you to investigate and improve how your website or application performs in your visitors' browsers, but they can't provide insight into server-side performance beyond measuring TTFB and initial server response time.
For the best results, implement both frontend and backend performance monitoring.
5. Optimize Your Database Operations
Speeding up database operations can help you reduce initial server response time, too. Database performance optimization highly depends on the database management system (DBMS) you use.
Here are some resources for the most popular database management systems that can decrease the time your server needs to retrieve all the necessary data from your database(s):
- SQL DBMSs:
- MySQL:
- SQLite:
- SQLite Optimizations for Ultra-High Performance by Ralf Kistner
- Optimizing SQLite Performance: Tips and Techniques by Jenny Muralidharan
- PostgreSQL:
- PostgreSQL Performance Tuning: Optimize Your Database Server by Vik Fearing
- How to Master PostgreSQL Performance Like Never Before by Adam Furmanek and Italy Braun
- MSSQL:
- How to Tune Microsoft SQL Server for Performance by Sripal Reddy Vindyala
- Best Practices for Query Optimization in MSSQL by LoadForge
- NoSQL DBMSs:
- MongoDB:
- Comprehensive Guide to Optimising MongoDB Performance by Srinivas Mutyala
- Fixing MongoDB Performance Issues: A Detailed Guide by Jilesh Patadiya
- Cassandra:
- MongoDB:
Beyond system-specific best practices, there are some general tips as well that you can use for most DBMSs, e.g. you can concatenate database queries to reduce the number of HTTP requests or implement database caching that stores the results of common queries either on the application server or a dedicated caching server.
If you're just starting out, it's also worth considering the performance implications of different database management systems. Overall, there's no one-size-fits-all solution, and the best DBMS for your use case depends on the structure of your data and the types of operations you need to perform.
Historically, NoSQL DBMSs have offered faster performance for read and write operations with semi-structured and unstructured data, while SQL DBMSs have processed complex queries faster and been able to handle ACID transactions.
ACID stands for Atomicity, Consistency, Isolation, Durability. These four database transaction properties are essential for data integrity when handling sensitive data. ACID transactions increase security and reliability, but they come with a performance overhead.
However, differences between SQL and NoSQL database management systems have blurred in recent years, e.g. NoSQL databases such as MongoDB have added support for ACID transactions and schema validation, while SQL databases such as PostgreSQL have introduced semi-structured data storage through JSON columns and document querying capabilities.
If you have a large and busy application, you can also combine SQL and NoSQL databases to handle different types of operations and data efficiently (while a hybrid database setup increases the complexity of your stack, it may still be worth it for the performance advantages).
To learn more about using both SQL and NoSQL DBMSs, check out Paul Carnell's Integration Strategies Between SQL and NoSQL Databases article.
Measure server response time across the globe
Running a free TTFB test is one way to see at a glance how well your website is performing. Simply enter a website URL to test and then check the result for the server response time.
TTFB also includes time spent establishing a server connection, so you'll need to look at the final "Response" component if you only want to measure the server response time directly.
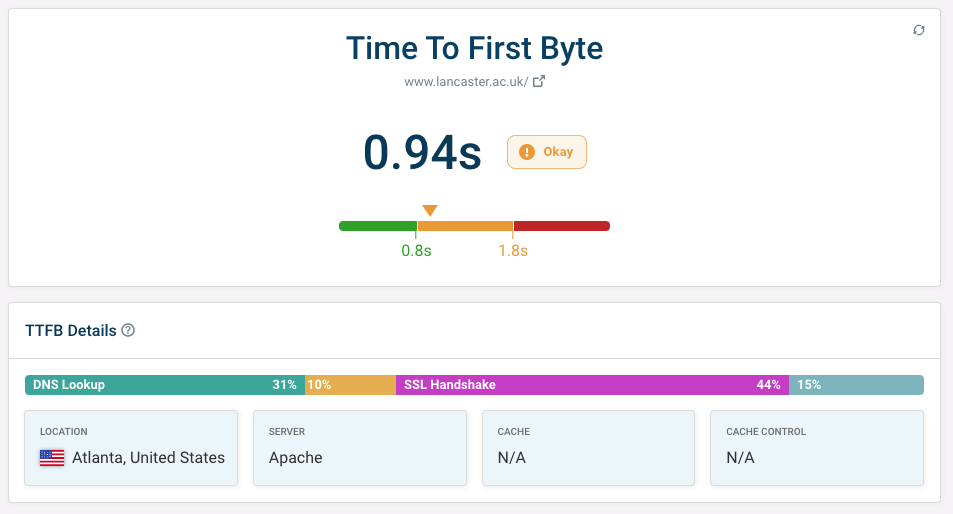
You can also see whether server response time varies by test location. If it does, implementing a Content Delivery Network can help you optimize this.

Next Steps to Reduce Initial Server Response Time
Reduce initial server response time is an important Lighthouse performance audit you're constantly supposed to work on. To do so, you'll primarily need to improve server-side performance and optimize your hosting environment. However, some frontend techniques, such as minifying and compressing your root HTML file and reducing its size, can also help.
The best way to ensure that your server consistently responds fast to user requests is by continuously monitoring key metrics and signals using a web performance auditing tool such as DebugBear.
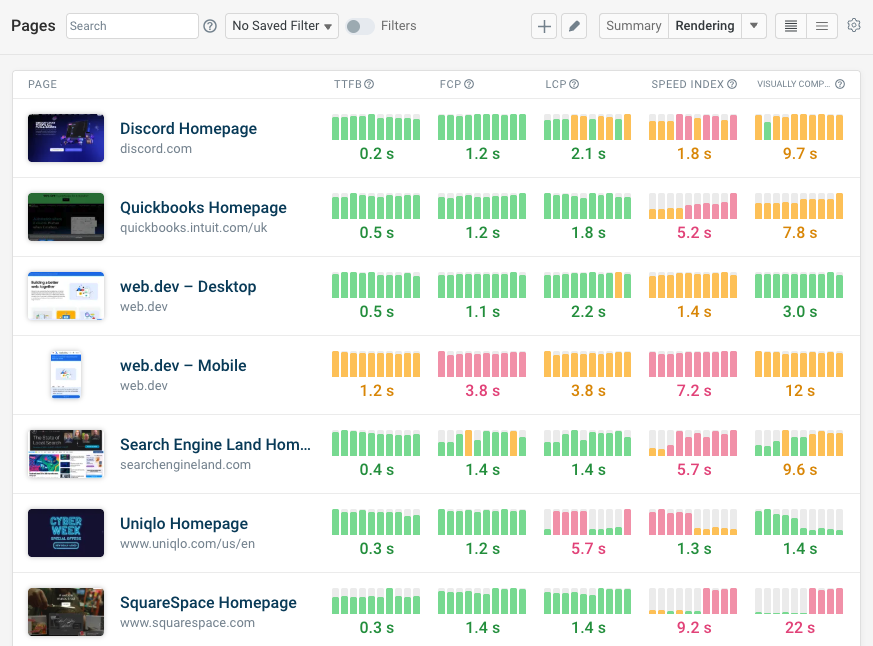
As DebugBear runs on the Lighthouse API, it uses Google's official formulas for calculating Core Web Vitals and other web performance metrics, allowing you to conduct your tests with the same standards used for search engine rankings.
Beyond that, DebugBear also lets you set up scheduled lab tests from 30+ test locations worldwide, monitor real user behavior, compare test results, see detailed breakdowns of your web performance issues, get access to historical data, and more.
To get started, run a free website speed test for your key pages, check out our interactive demo, or sign up for a free 14-day trial for the full DebugBear web performance monitoring experience (no credit card required).
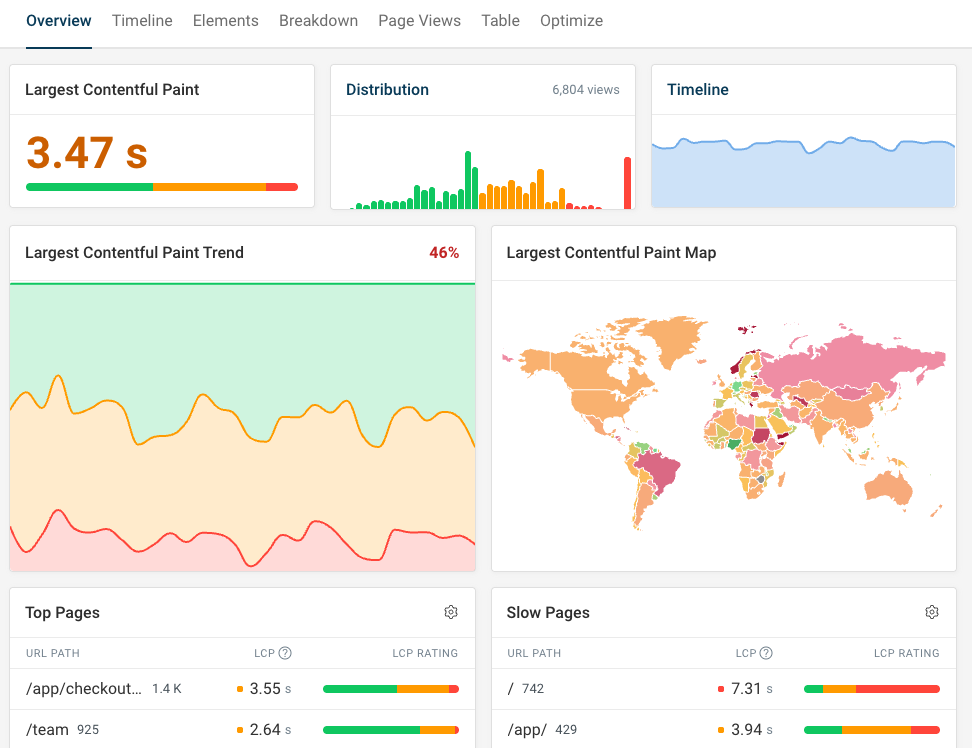


Monitor Page Speed & Core Web Vitals
DebugBear monitoring includes:
- In-depth Page Speed Reports
- Automated Recommendations
- Real User Analytics Data
