
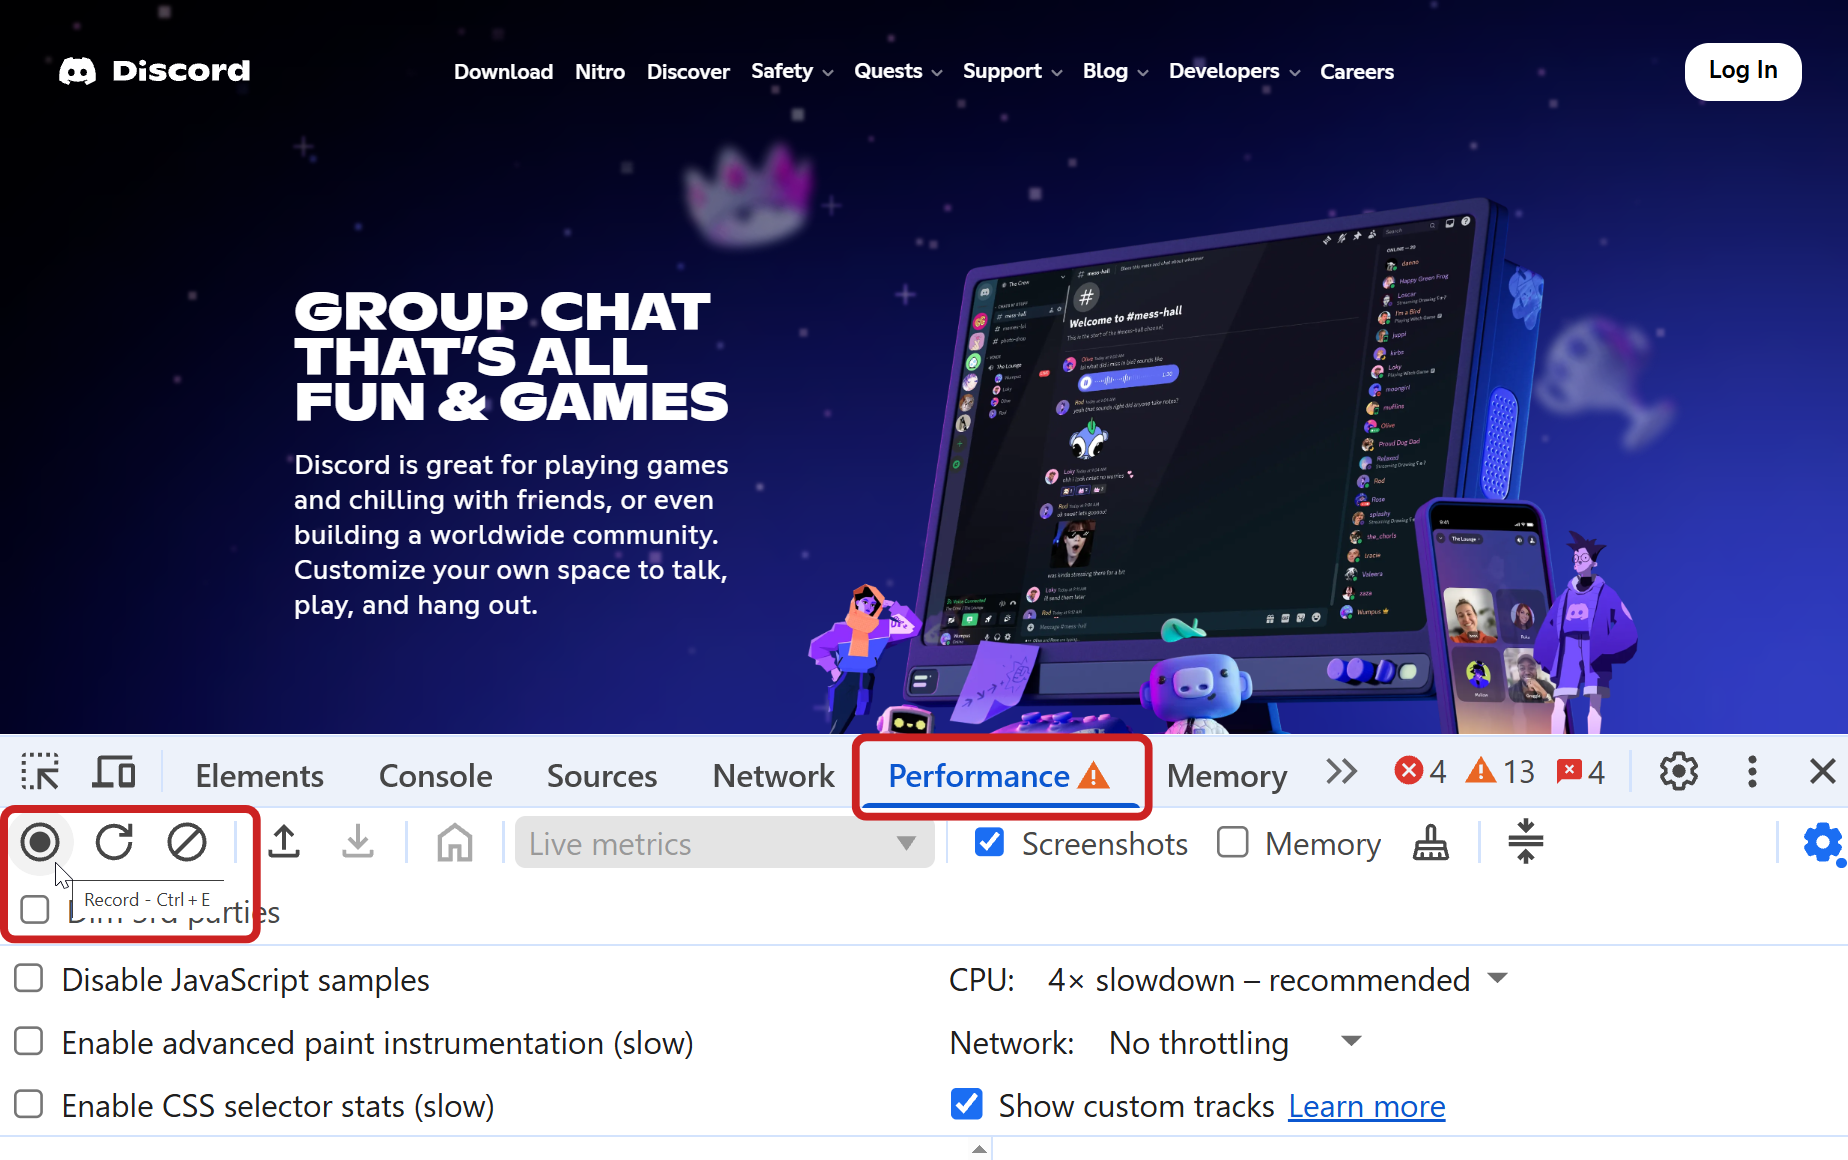
Google is introducing new insight audits in DevTools to help optimize Core Web Vitals and highlight performance issues. After running a performance profile, you are able to gain information on how to improve Largest Contentful Paint (LCP) request discovery.
What is LCP request discovery?
LCP request discovery is the process of finding the specific file or resource that's needed to display the main image on a web page. Since LCP measures how fast the largest rendered element loads, discovering the request helps developers learn how to present this content sooner.
If the LCP element is an image the browser needs to find the image URL and initiate the download as soon as possible to avoid delays.
LCP request discovery in Chrome DevTools
To view the LCP request discovery insight, run a performance profile and wait for the results.
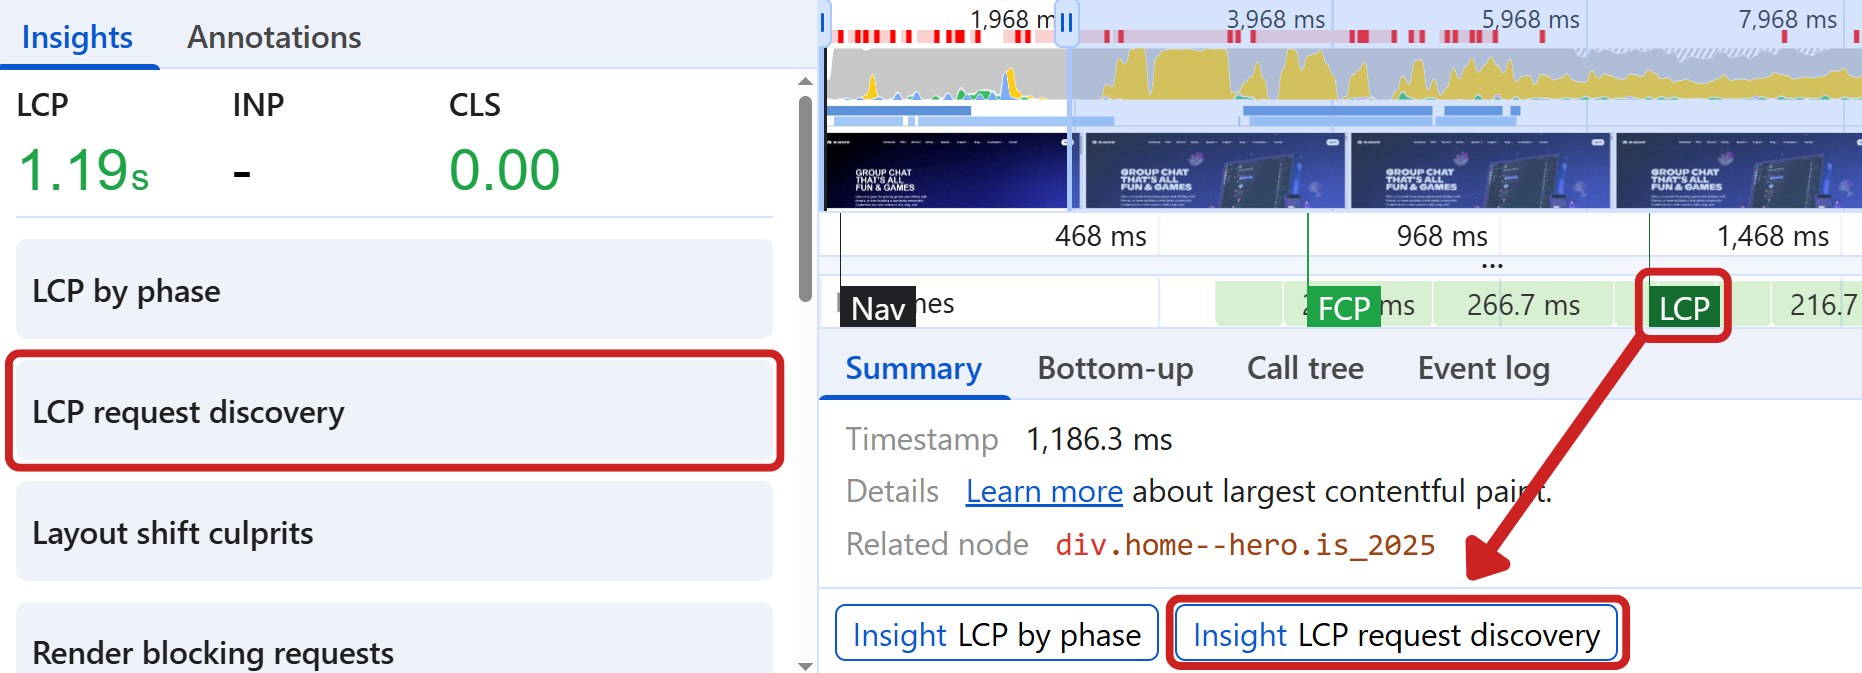
Insights are listed in the sidebar. The LCP insights are typically listed at the top. They can also be found when clicking on the LCP marker in the timeline.
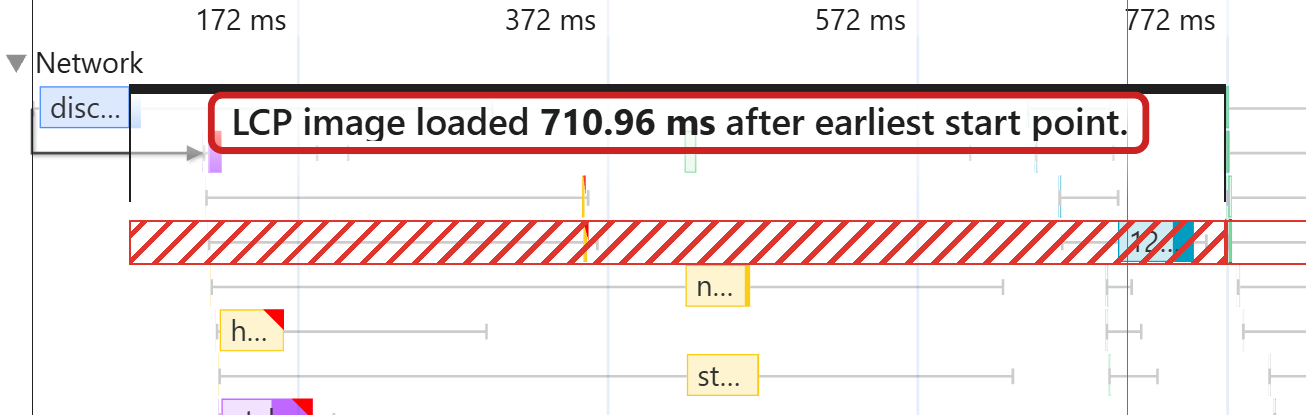
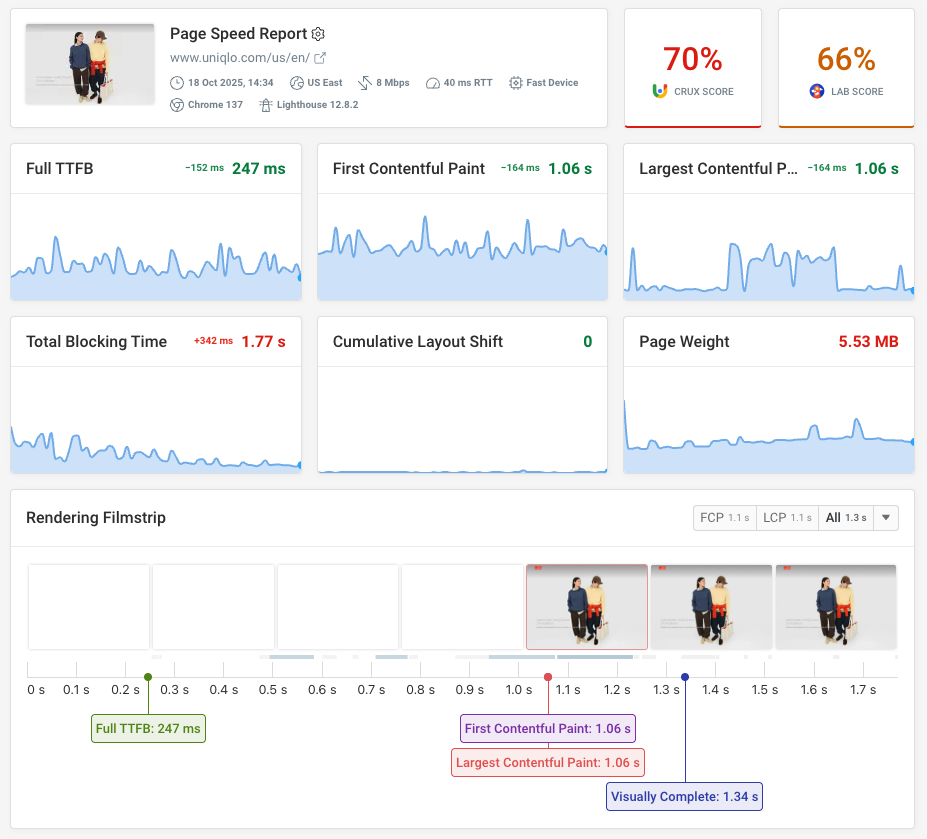
The network timeline highlights when the LCP image begins loading, along with the earliest load point the image could have started loading. The earliest start point is the moment the browser discovers the image when parsing the HTML document.
In this example the LCP image loaded 711 ms after the earliest start point. This is known as resource load delay. Identifying a potential optimization to load the resource earlier can improve page speed.
LCP request discovery audits
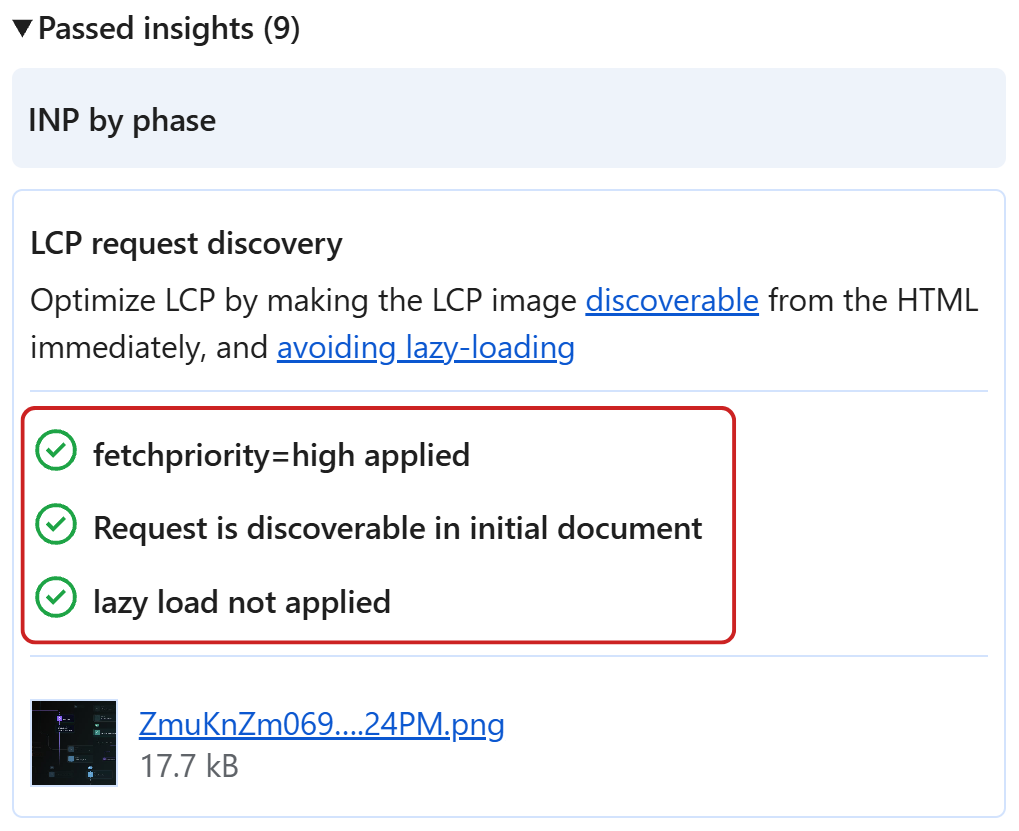
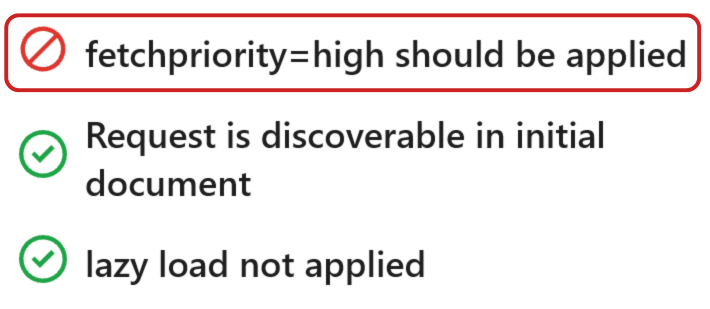
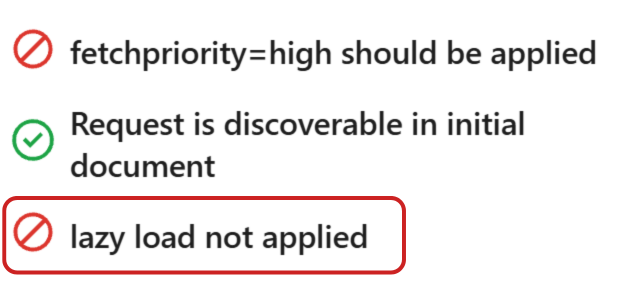
The LCP request discovery shares three audits to help discover potential LCP optimizations:
fetchpriority="high"should be applied- Request is discoverable in initial document
- Lazy load not applied
If the page passes all these audits, the result can be found at the bottom of the insights tab under passed audits. Lighthouse also shows this general advice:
Optimize LCP by making the LCP image discoverable from the HTML immediately, and avoiding lazy-loading.
Let’s take a look at each of the audits and how they can help improve LCP request discovery.
fetchpriority="high" should be applied
Images are considered low priority by the browser by default. After identifying the LCP image for a page, we can add the fetchpriority="high" attribute to the image tag to improve LCP request discovery. This attribute allows the browser to recognize the importance of the request earlier, scheduling the image ahead of low priority resources.
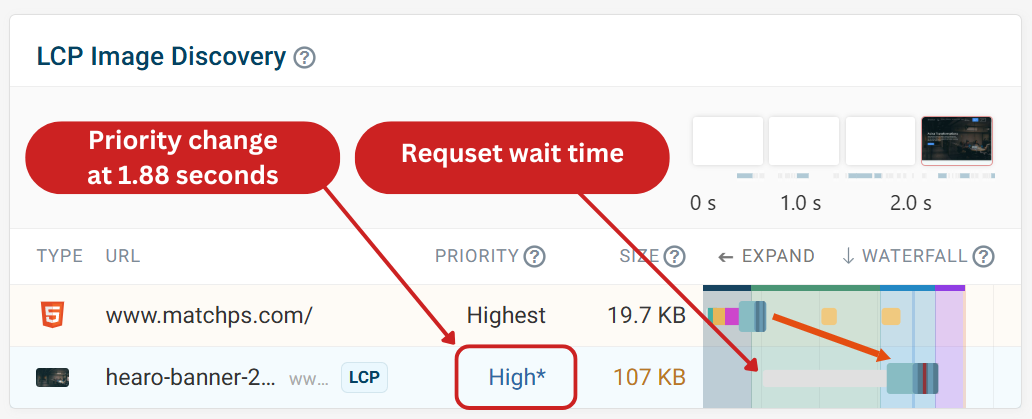
In this request waterfall we can see the LCP image request has a priority change at 1.88 seconds, changing from low to high priority. The grey bar represents the waiting time. This is when the browser has identified the request but hasn't started loading the request yet due to low priority.
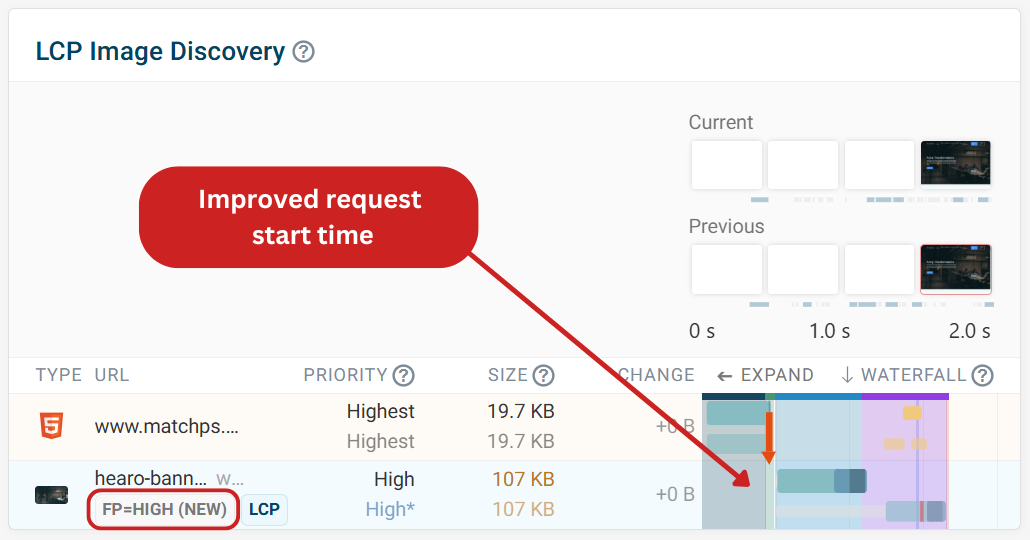
After running an experiment adding fetchpriority="high", we can see a difference in how the browser handles the LCP image request, loading the image much sooner. This change improves the LCP score by 200 ms.
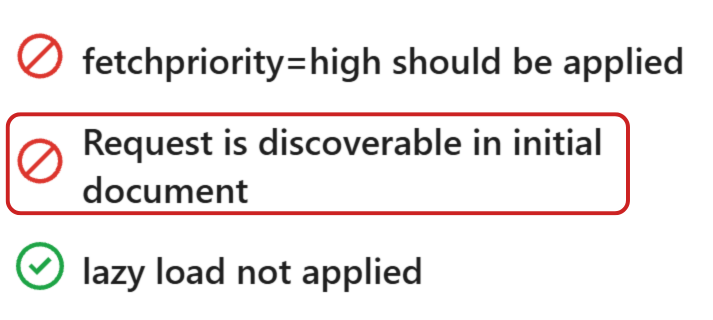
Request is discoverable in initial document
In this example we can see this page has not passed the “request is discoverable in initial document” audit.
When reviewing the LCP request chain, we can see that the LCP element is a background image loaded from a CSS request, meaning that the image is not discovered until after the CSS request is complete. The request chain is causing a load delay of 1.34 seconds.
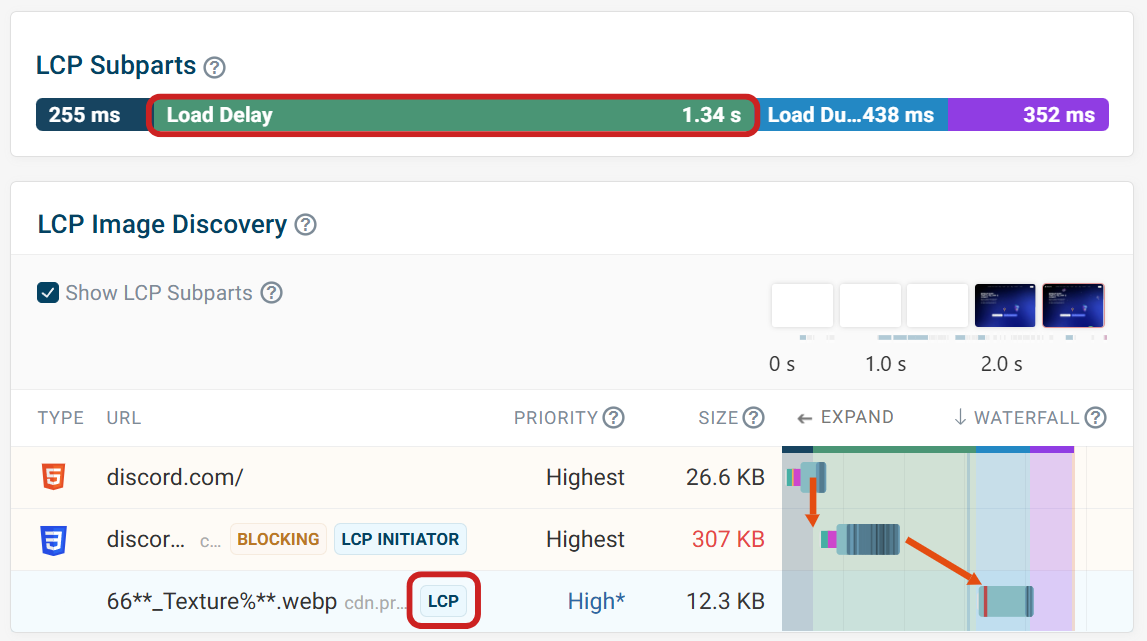
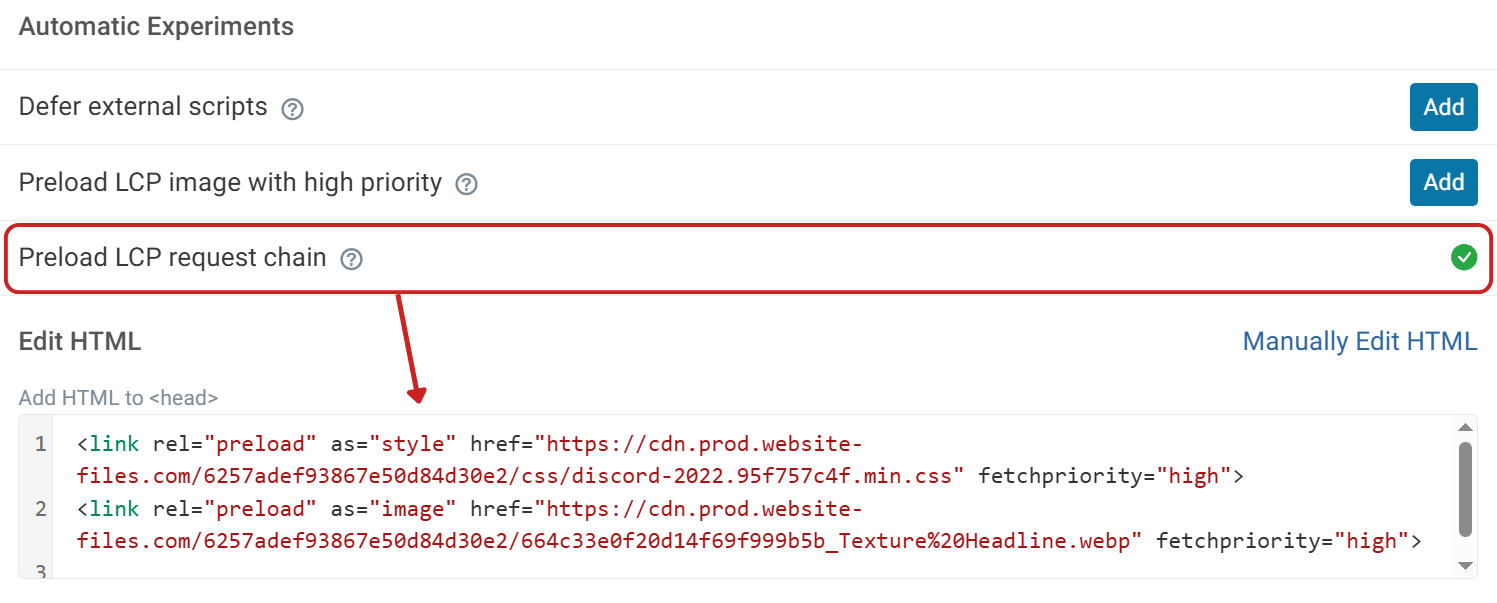
Ensuring the image is discoverable in the HTML document should improve the LCP load delay. We can do this by preloading the LCP request chain.
Lazy load not applied
Lazy load is a useful technique for images below the fold. Lazy loading images can improve bandwidth competition for more important requests. This can be done using the loading="lazy" attribute.
However, lazy loading the LCP element is counter productive, as we want the LCP image to load as early as possible.
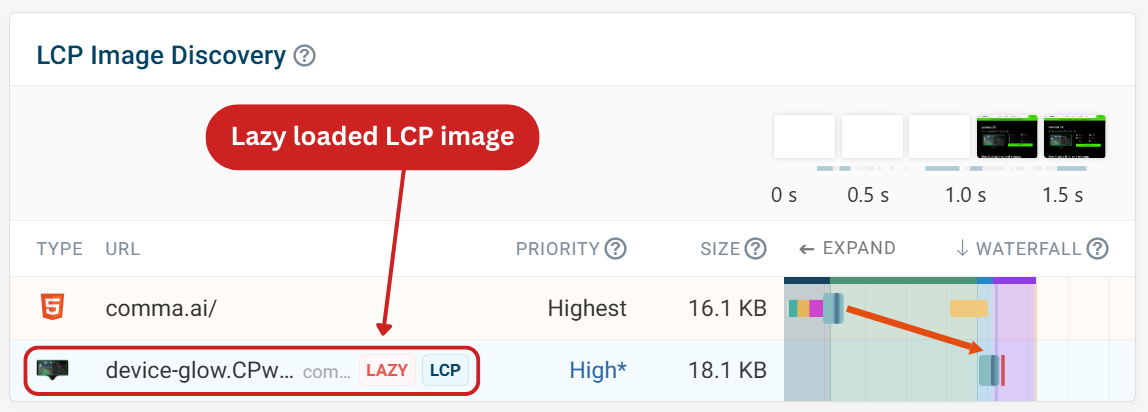
If the LCP image uses the loading="lazy" attribute, the audit will fail and highlight the problem.
Lazy loaded LCP images are highlighted in DebugBear’s request waterfall with the red lazy badge.
Monitor your LCP score
Continuous monitoring of your website is important to catch any potential LCP regressions. With DebugBear monitoring, you can see a complete overview of how your pages are performing throughout time. You can also set up performance budgets to get alerted to regressions as they happen.
Each test comes with recommendations and best practices, similar to the ones mentioned in this article. With the option to test out optimizations with experiments before pushing changes to your live site.


Monitor Page Speed & Core Web Vitals
DebugBear monitoring includes:
- In-depth Page Speed Reports
- Automated Recommendations
- Real User Analytics Data