CrUX history data, new compare UI, more detailed data exports, better debug data for priority changes and preload headers.
Chrome User Experience Report history
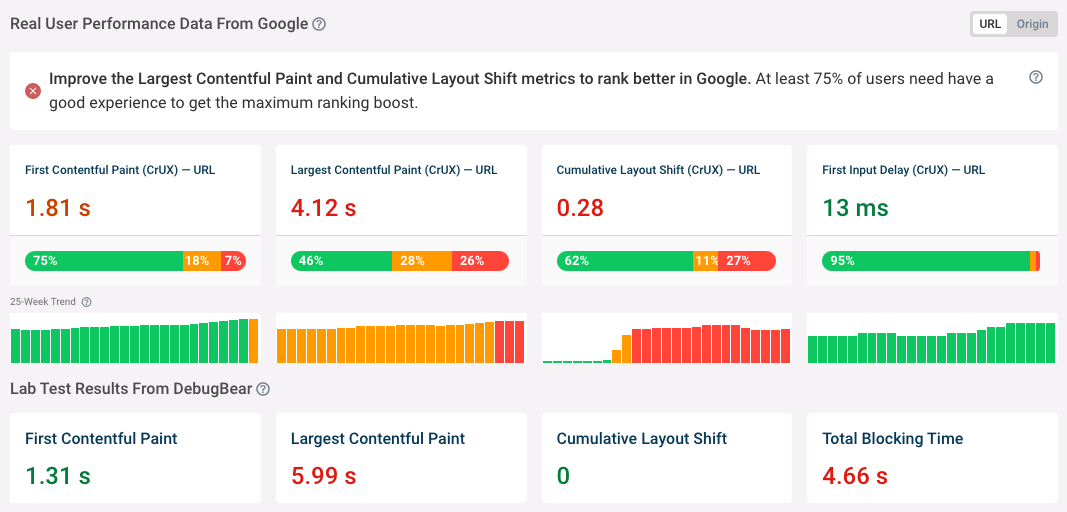
We now use Google's CrUX history API to show real user data before monitoring for a page was set up.

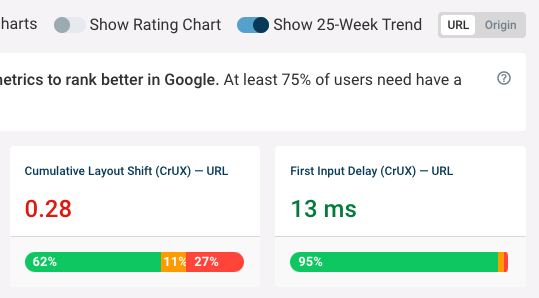
This is enabled by default for new pages that don't have much continuous monitoring data yet. For older pages you can open the UI using the Show 25-week trends toggle.

All metrics included in data export
When exporting data using the CSV export or the API previously only a subset of metrics were included. We now provide all 114 metrics.
For example, you can now access:
thirdParty.bytes: page weight added by third party scripts and widgetsrecalcStyleCount: number of style recalculations made when rendering the pagecrux.url.inp.p75: real user 75th percentile value for the Interaction to Next Paint metric at the URL levelcrux.origin.fcp.good: percentage of real users having a good First Contentful Paint experience across the whole domain
New page compare interface
We've updated the comparison interface to make it more intuitive to use. Instead of explicitly adding a test result to comparison you can now simply select from one of your recently viewed test results.

Priority change timing
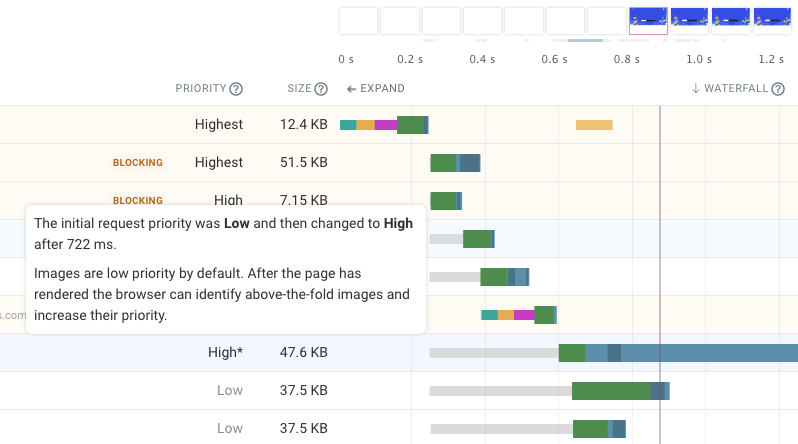
Request priority changes most often occur in response to the initial render, when the browser realizes which page elements are in the viewport.
When hovering over a priority change we now show when the change happened.

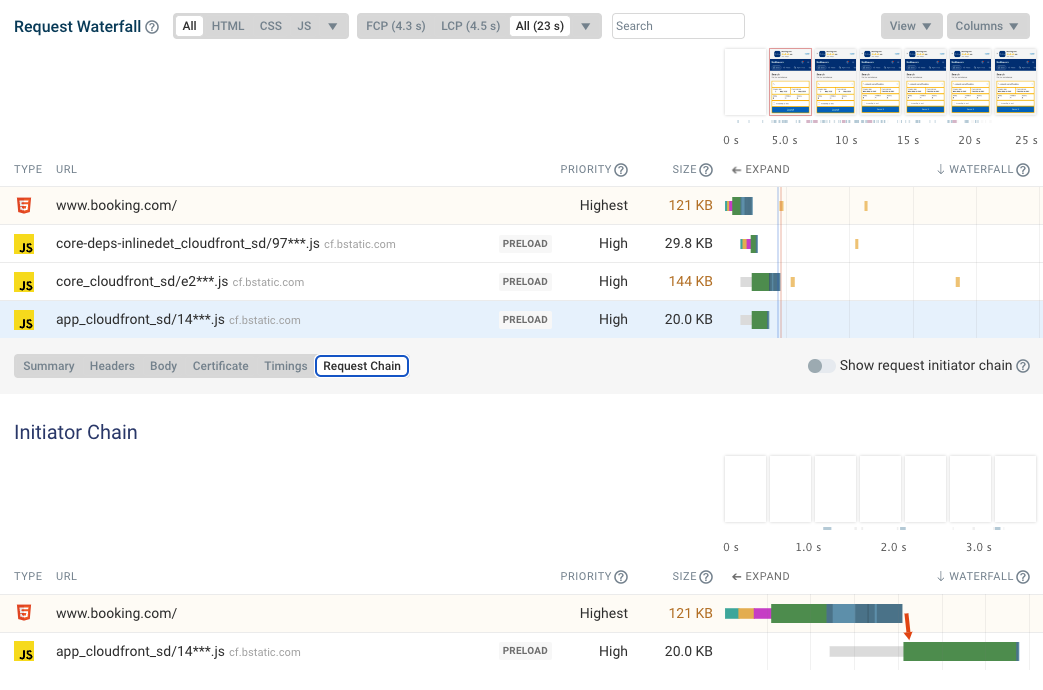
View request chains involving preload link headers
When a request is triggered by a preload header we now correctly identify the request initiator and show it in the request chain view.

New articles
- Make Your Website Load Fast By Optimizing Request Priorities: learn how browser prioritize requests and how you can ensure resources are correctly prioritized
- Is Reducing Page Weight Important For Website Speed?: find out for what files page weight is important and when it's less likely to cause issues