New RUM errors tab, a new UI for looking at INP, better performance budget alert controls, and new educational content. Here's what's new in DebugBear for November 2024.
RUM Errors Tab
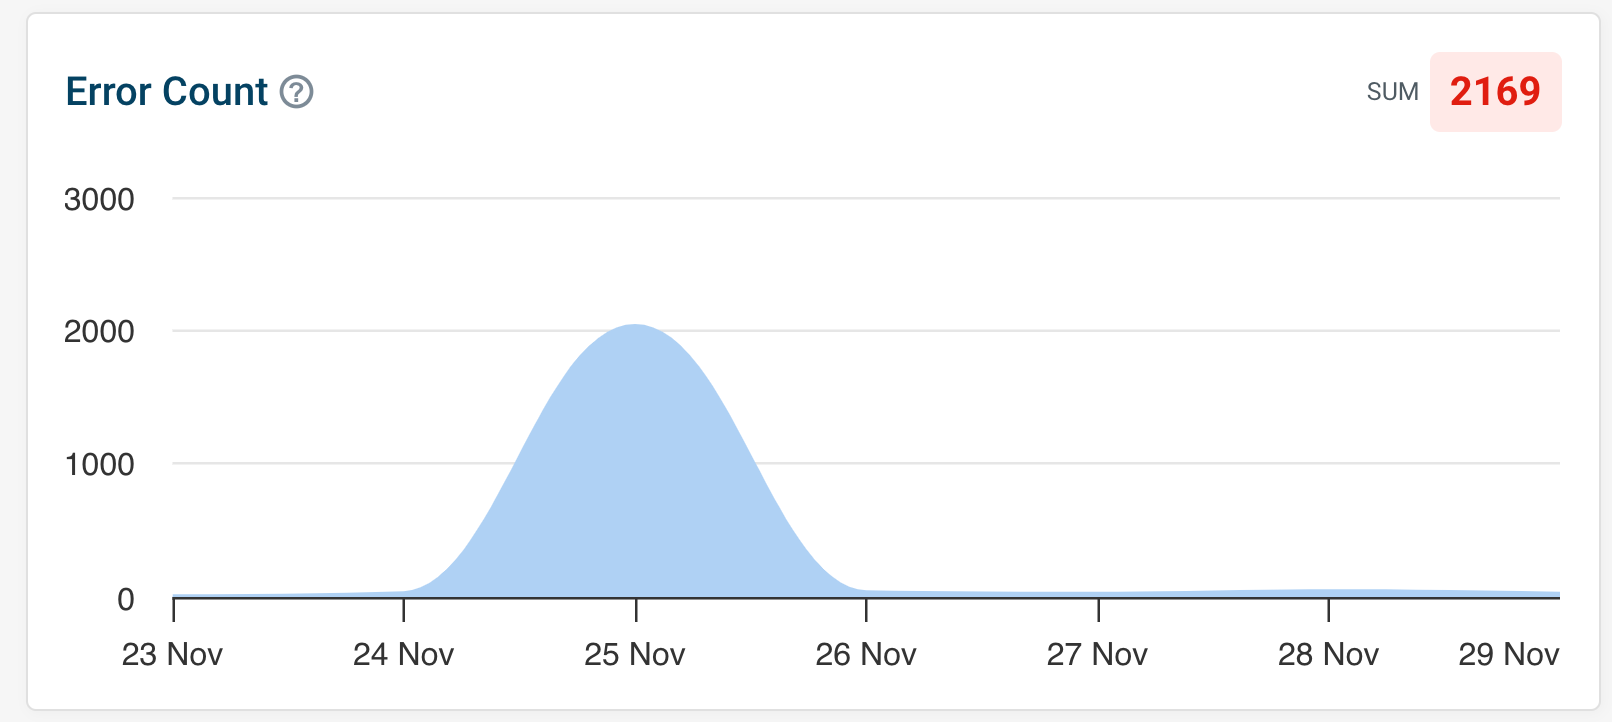
We've added a new tab to the Real User Monitoring dashboard that shows you the total number of errors, top error messages, and top script URLs that are causing errors on your site. This can help you quickly identify and fix issues that are affecting your users.
New UI for INP
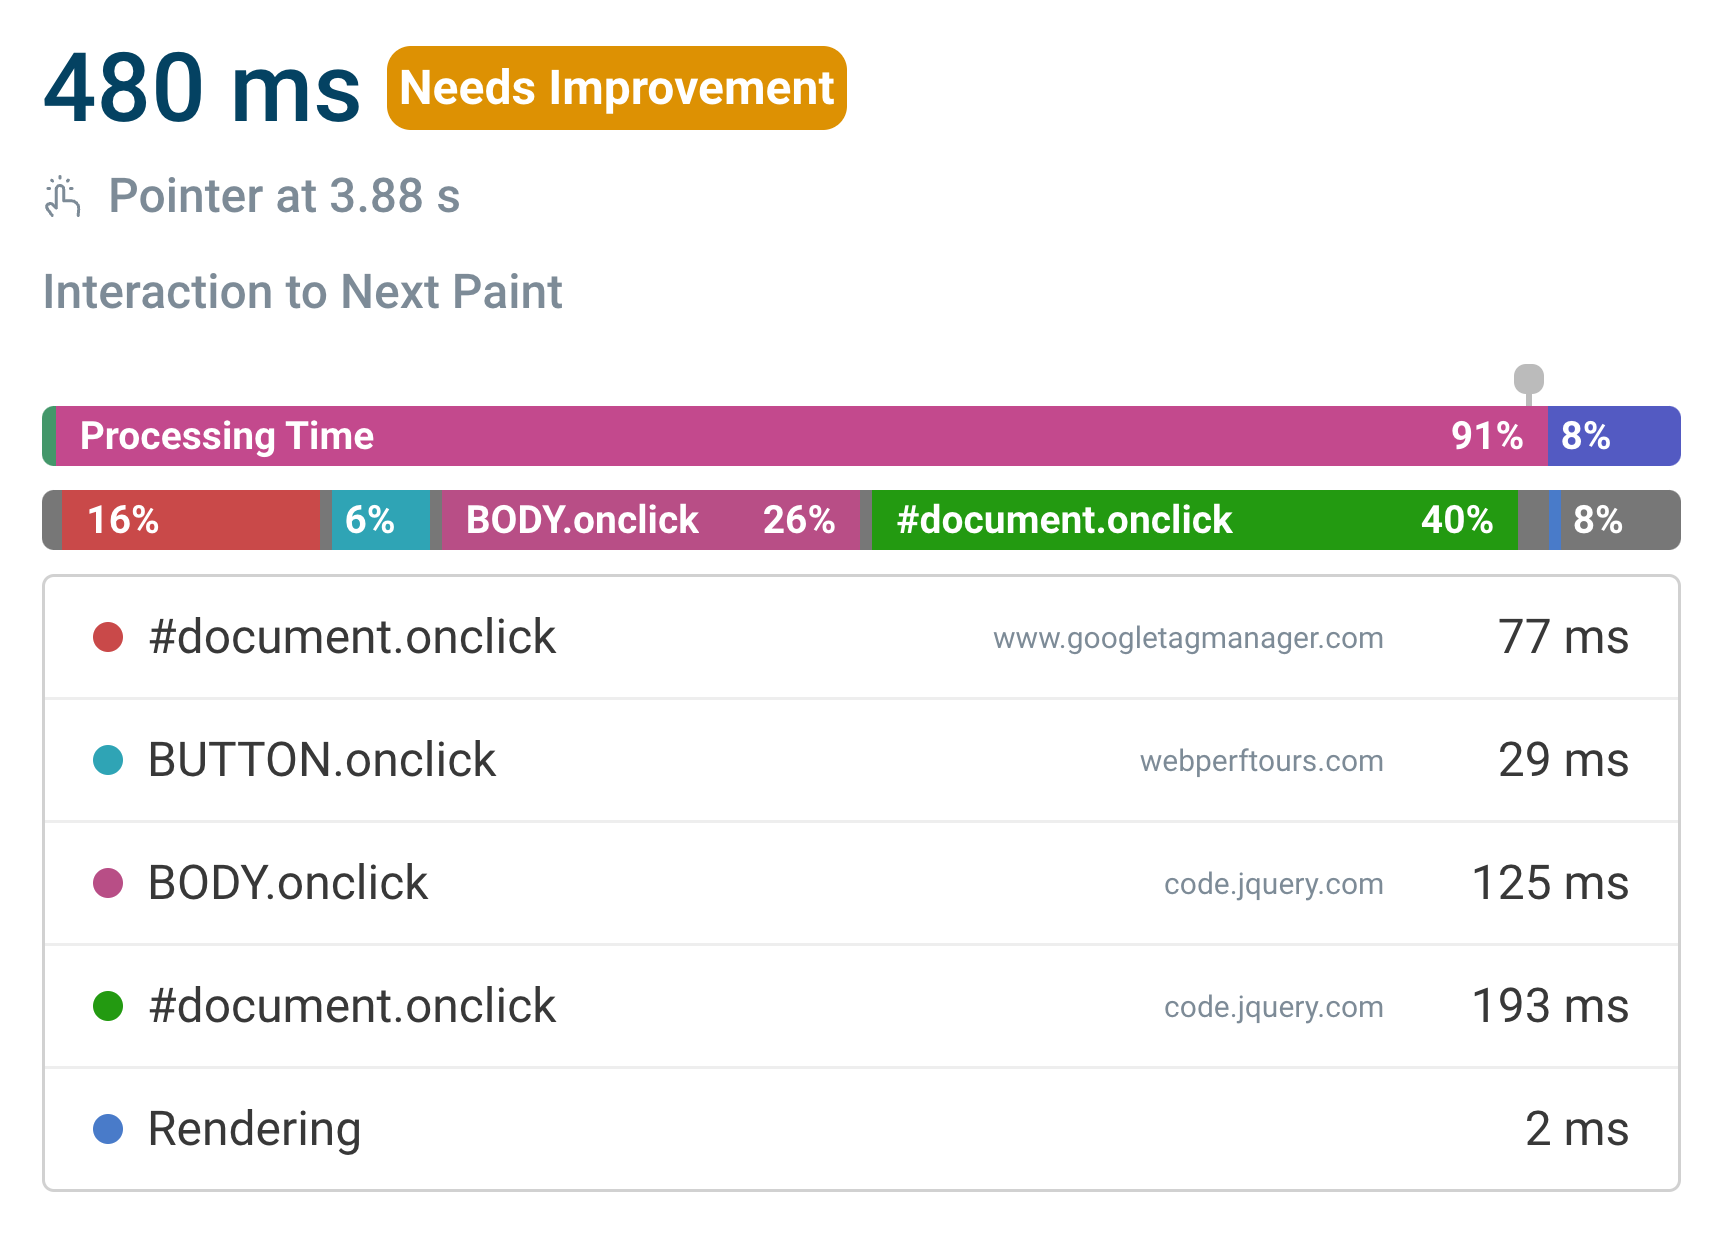
There's a new user interface for looking at Interaction to Next Paint (INP) data within the RUM dashboard.
This UI shows when looking at an individual page view within your RUM dashboard, assuming you have INP data available.
UTM Campaign Breakdown Option
You can now break down your performance data by UTM campaign parameters. This can help you understand how different marketing campaigns are affecting your site's performance.

Performance Budget Alert Controls
You can now control whether custom performance budgets trigger alerts, and trigger an alert for every time a budget is breached rather than just for new breaches.
You can find this option under the Performance Budgets Alert settings within the Project Settings > Integrations section.

New RUM Filter Options
There's now a "matches" and "does not match" filter options for the RUM dashboard. This can help you filter your RUM data more effectively. These filters are now compatible with wildcard characters (*).

New Blog Posts
We've published a few new blog posts that you might find interesting:
-
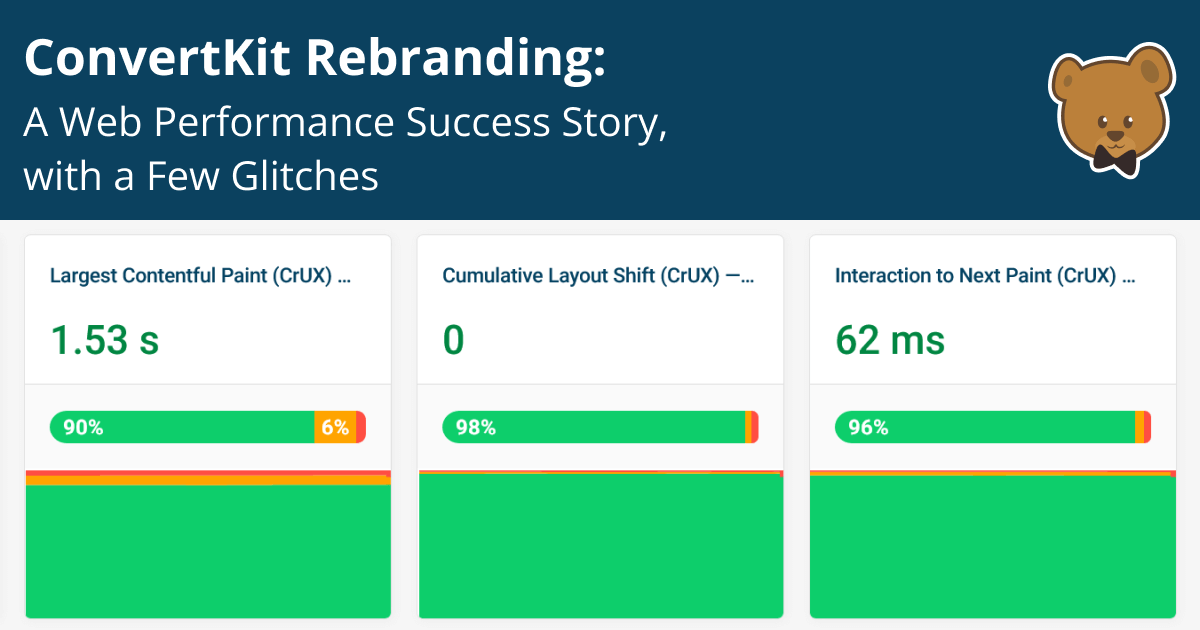
ConvertKit Rebranding: A Web Performance Success Story, With A Few Glitches - Kit's rebranding was largely a web performance success story, with consistently green Core Web Vitals scores, well-optimized resource hints and web fonts, and zero render blocking resources.
-
Layout Shift Culprits: Debugging CLS with Chrome DevTools - Learn about the new layout shift debugging tools in Chrome DevTools that make it easier to identify the causes of layout shifts on your page.
-
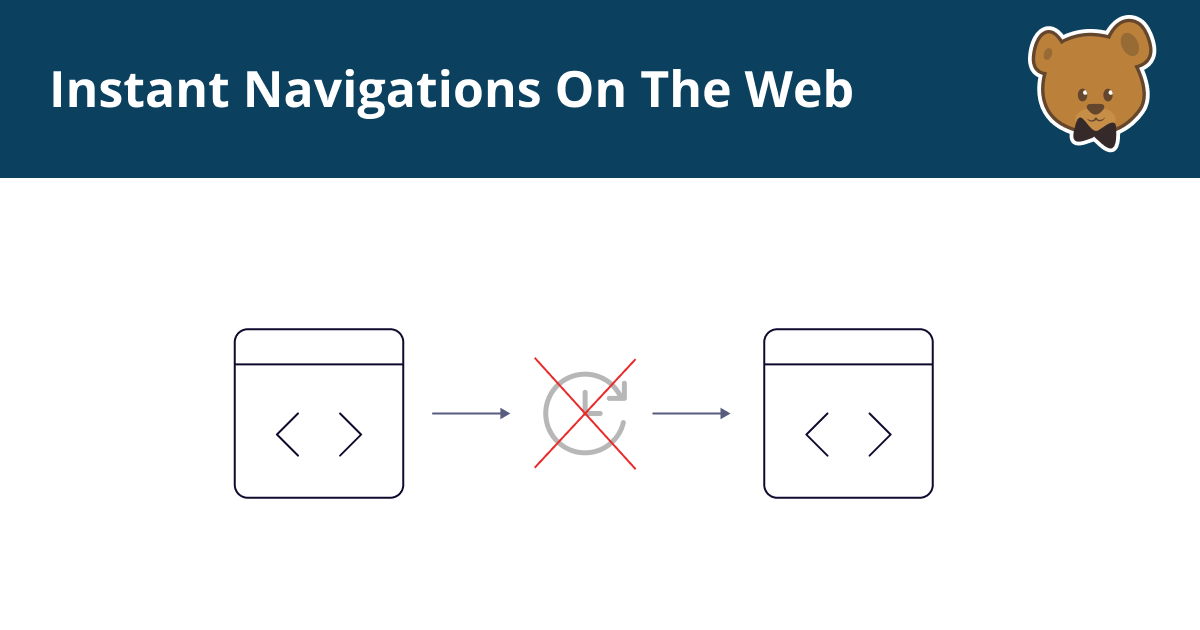
How To Achieve Instant Navigations On The Web - Opening a web page normally means waiting a few seconds for content to load. But what if website navigations could be instant?
-
How To Annotate A Chrome DevTools Performance Trace - Learn how to add annotations to Chrome DevTools performance recordings to document your findings and discuss them with your team.
-
How To Optimize Performance In Vue Apps - Vue is built with performance in mind, but sometimes you’ll need to take some extra steps to optimize your website. This guide explains what techniques you can use to make your Vue App fast.
-
View Transitions API: Single Page Apps Without a Framework - An introduction to View Transitions, a modern web platform feature to improve user experience and perceived performance.
-
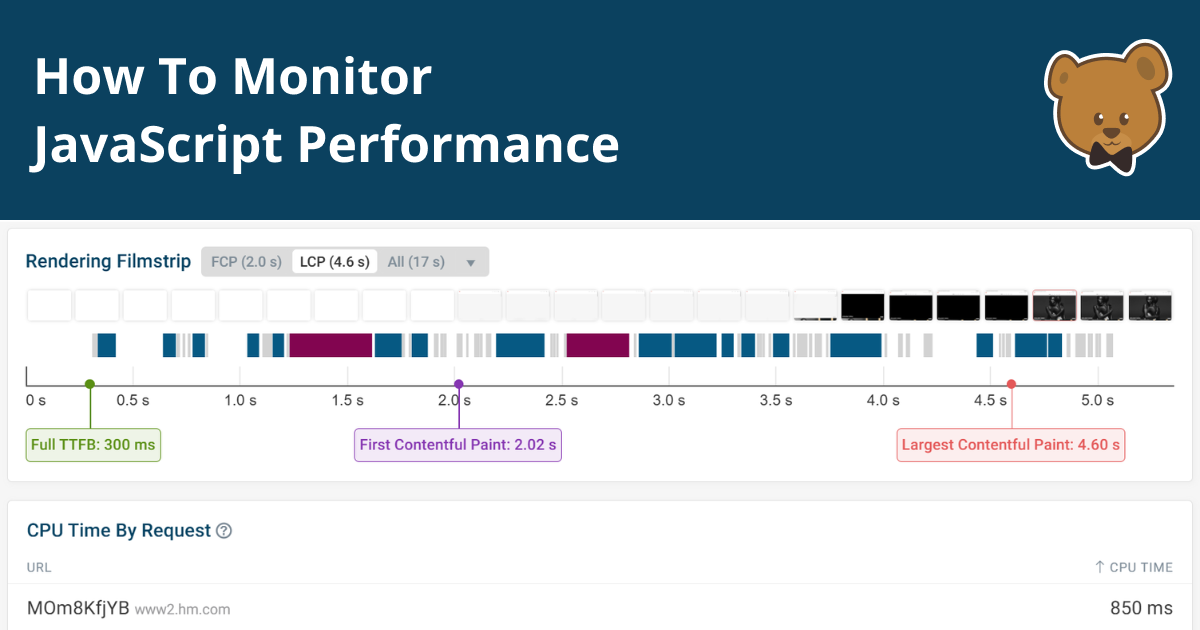
How To Monitor JavaScript Performance - As websites rely more on JavaScript for page load and interactive elements, performance monitoring has become essential to ensure smooth user experiences and prevent slowdowns.
-
How To Reduce JavaScript Execution Time - Reducing JavaScript execution time optimizes web performance by minimizing main thread blocking, improving interactivity and could improve Interaction to Next Paint.
-
How To Optimize Performance In Nuxt Apps - Nuxt, a powerful framework built on top of Vue.js, offers a rich ecosystem for developing performant and scalable web applications. This article dives into the key strategies and best practices for optimizing performance in Nuxt applications.
-
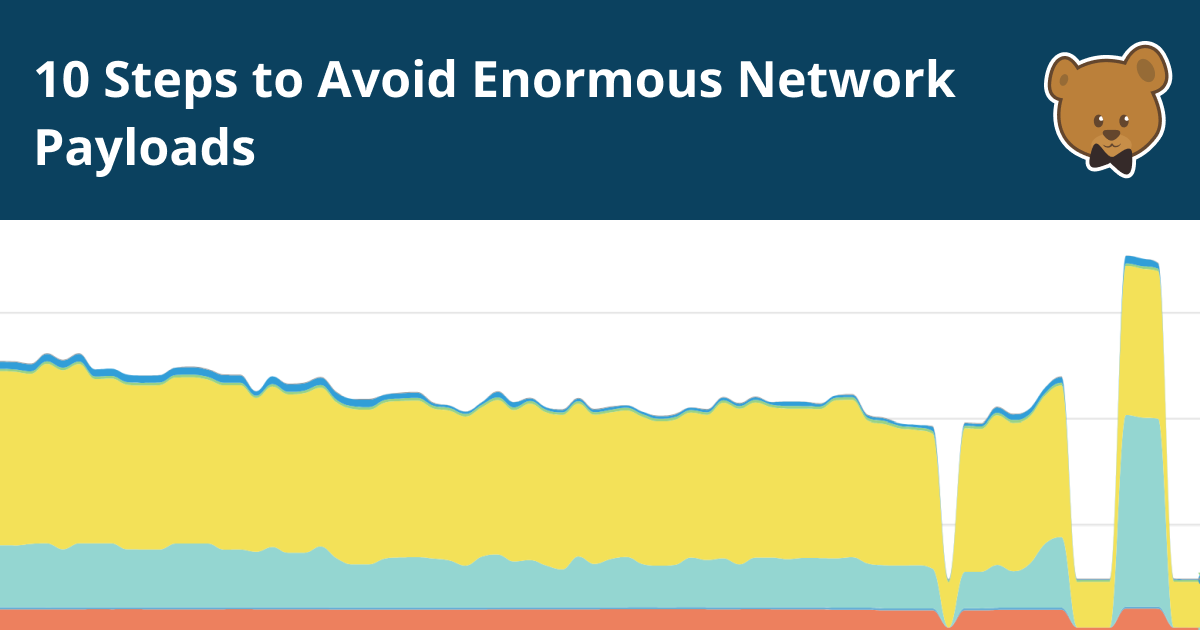
10 Steps to Avoid Enormous Network Payloads - Avoid enormous network payloads is a Lighthouse audit that measures and evaluates the total size of frontend files a web page downloads from the network.
New Videos
-
Add CSS View Transitions to your website, with DevTools - Quickly add View Transitions to your website, with DevTools.
-
Single Page Apps without JavaScript Frameworks! - This video walks you through some demos with the View Transitions API.
-
Fixing Largest Contentful Paint: 3 examples where the LCP element is text - Let's take a look at three network request waterfalls and what they tell us about how to optimize the Largest Contentful Paint metric.
-
Debug Interaction to Next Paint with the Long Animation Frames API (LoAF) - Take a look at the LoAF API in Chrome to see how it can help you identify slow scripts.
