Use the metric groups feature to customize your site speed dashboards. We've also upgraded Lighthouse and improved our performance recommendations.
Customize performance metrics
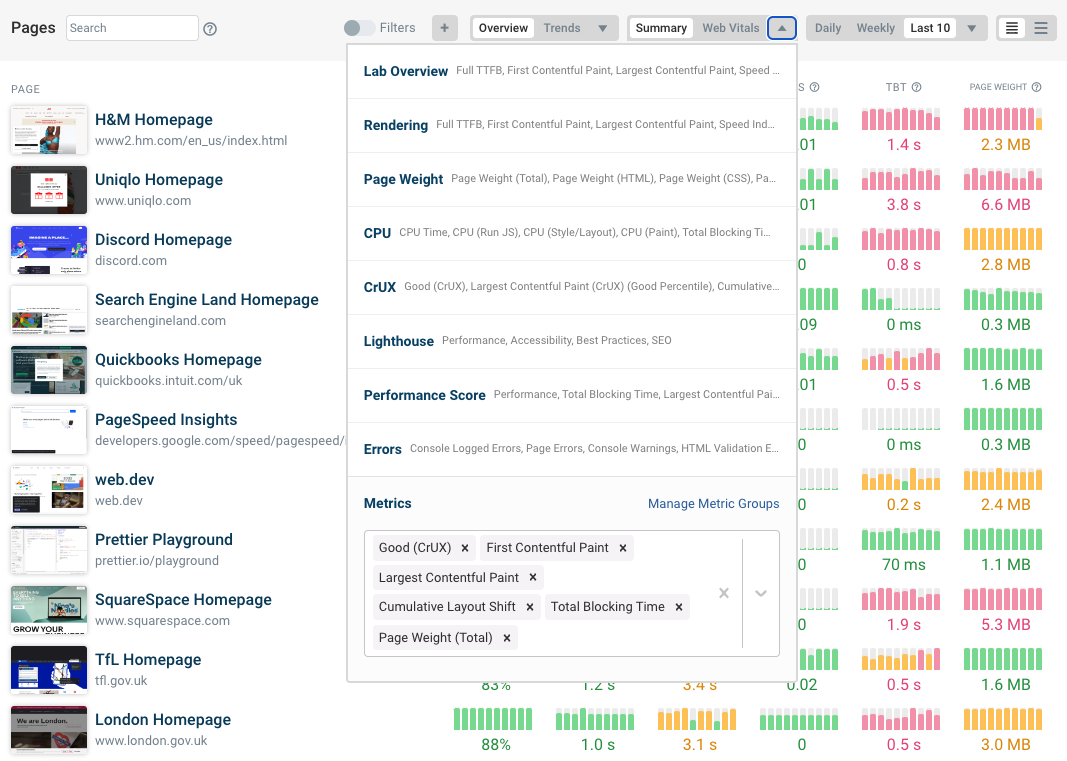
You can now customize what metrics are shown on your performance dashboards. You can then save them as metric groups so that you can share the selection with your team and reuse it in the future.

Lighthouse 10 and Chrome 110
We now use Lighthouse 10.0.1 and Chrome 110 to run our performance tests. Important changes:
- The Time to Interactive metric no longer impacts the Performance score
- The Cumulative Layout Shift metric has increased in importance
- There's a new audit for the back/forward cache
Improved performance recommendations
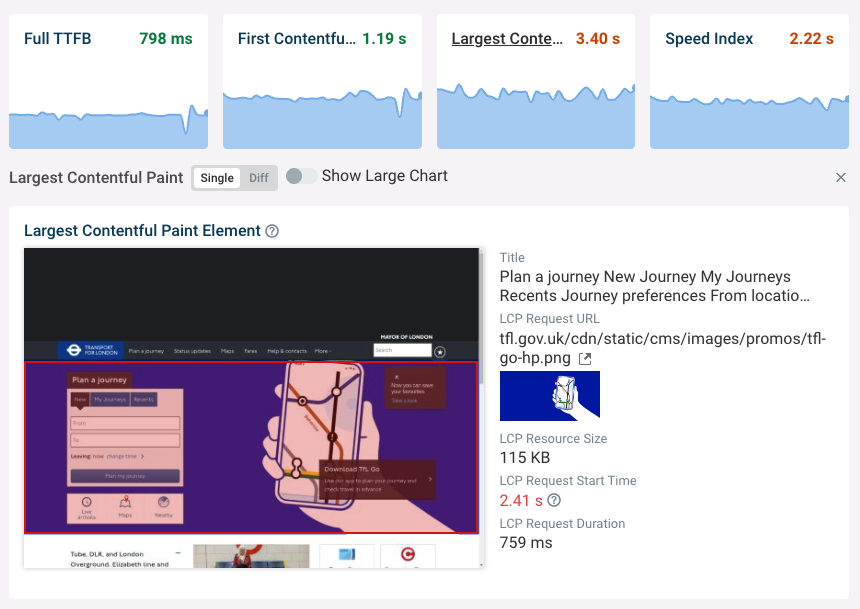
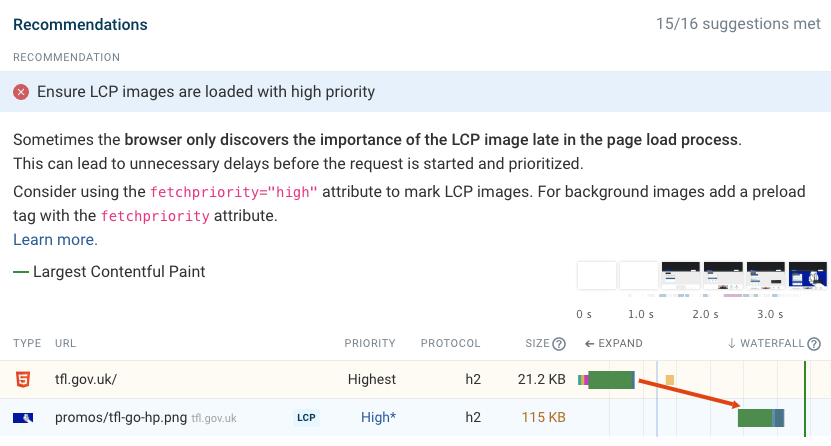
We now show more performance recommendations alongside metric data, for example for the LCP request start time:

As well as adding new items to the recommendations.

New articles
- How HTTP Server Connections Work On The Web – an in-depth look at server connections and how they impact page speed
- How Do Websites Work: A Technical Introduction – originally written as an introduction to the server connections article, this post takes a higher-level look at how website load resources
- Is Google PageSpeed Insights Reliable? – a guide on how to interpret the data on PageSpeed Insights