More performance metrics in the overview tab, a new test location in Israel, plus a Google Chrome update.
View more metrics in the project overview
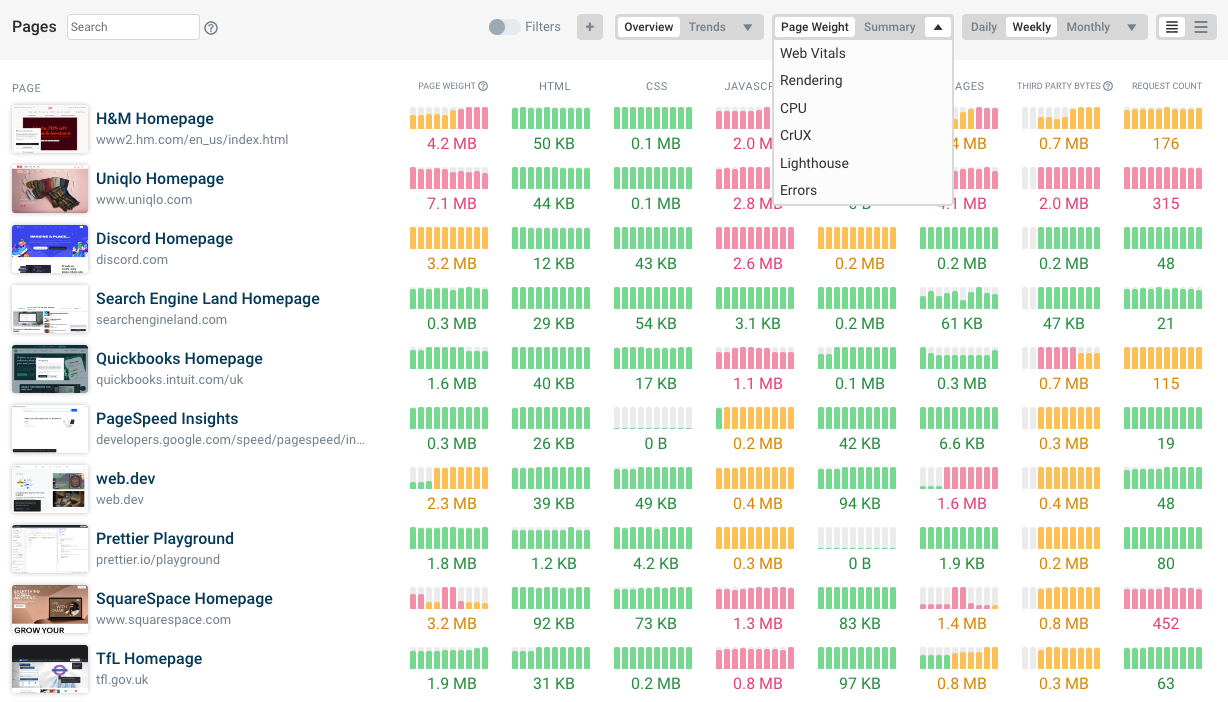
You can now view a wider range of metrics in the page listing:
- Rendering: key page load milestones like TTFB, FCP, LCP, and Speed Index
- CPU: break CPU activity down by type, and view third party CPU time
- Page weight: break page weight down by resource size
- CrUX: view "Good" percentiles as well as Interaction to Next Paint

New test location in Israel
Tel Aviv is our 21st test location.
Chrome 107
We've updated from Chrome 106 to 107.
New articles
- What Is CSS @import And Why Can It Slow Down Your Website? – the @import rule can cause render-blocking request chains
- What Does The Back/Forward Cache Mean For Site Speed? – a look at how browser history navigations can be sped up
- Using Local Overrides To Run Core Web Vitals Experiments In Chrome – see the potential impact of site speed optimizations
- Why use DebugBear? – a look at what makes DebugBear different from other tools