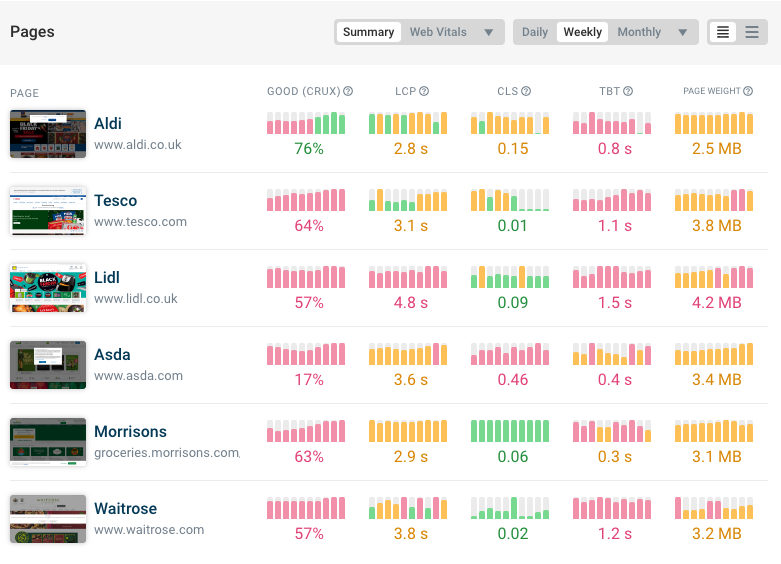
Track page speed over time and get alerts if there's a performance regression.
See why your website is slow
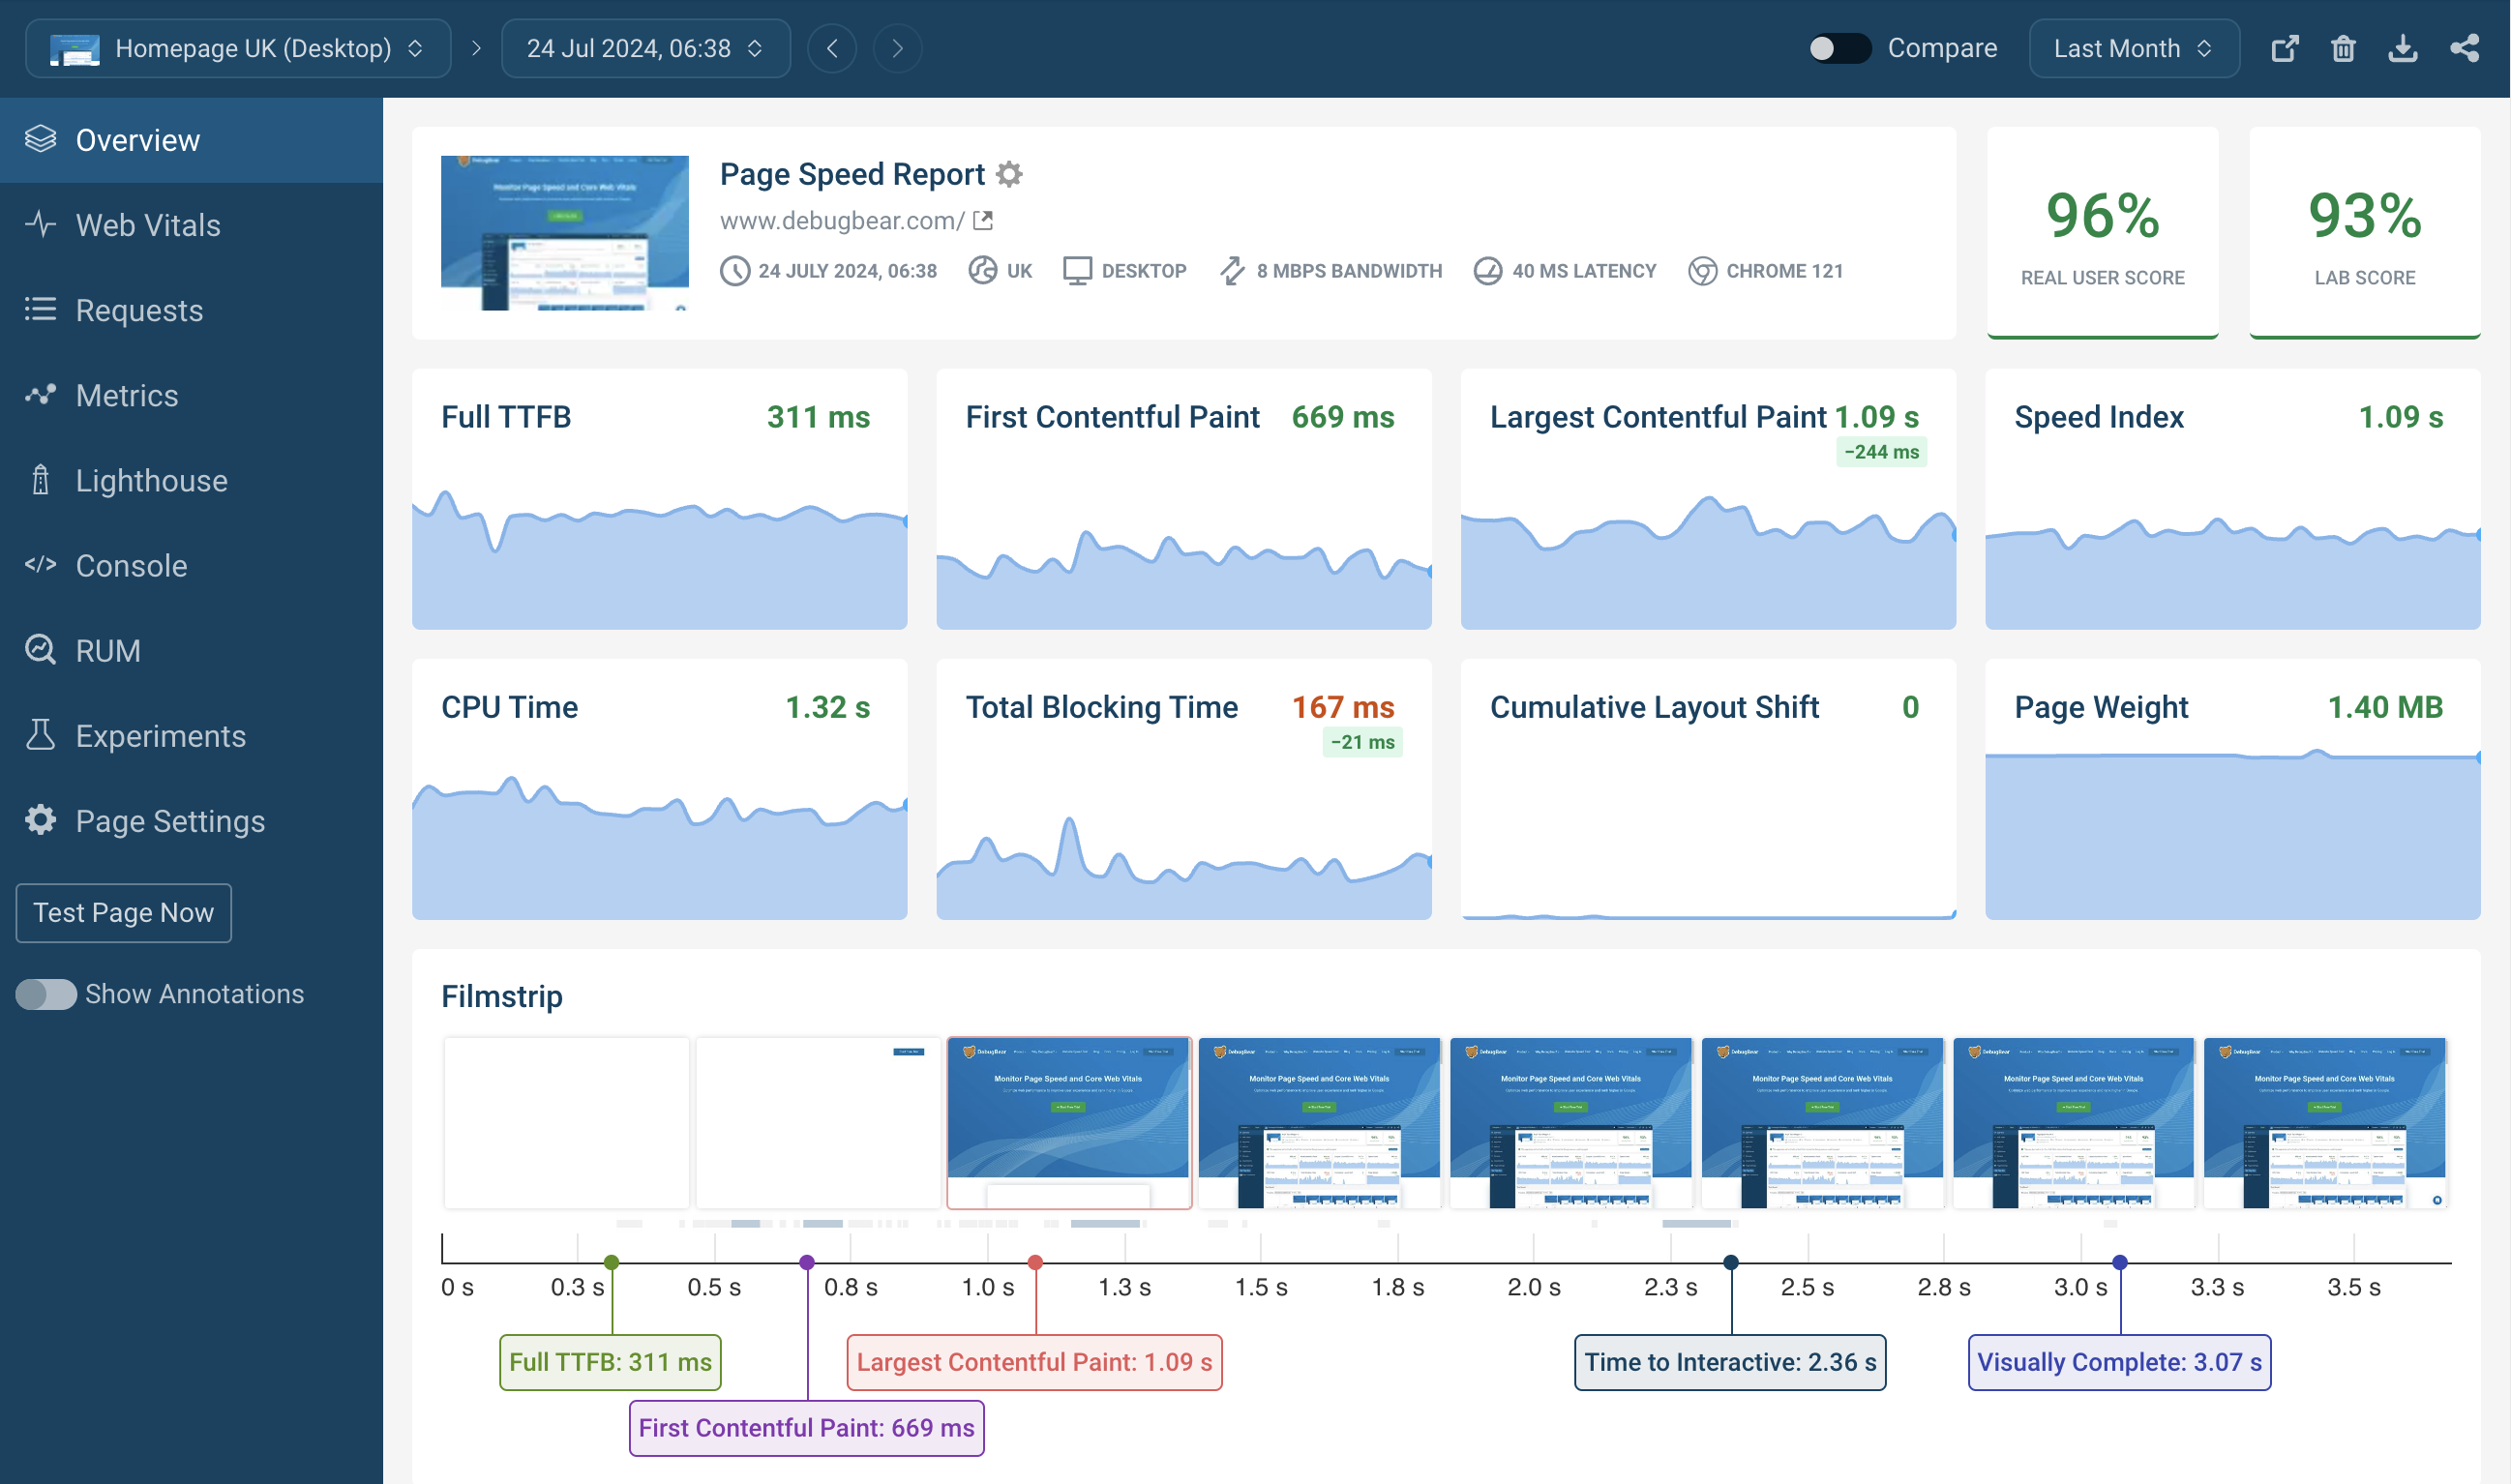
Filmstrip and video view
See how users on a mobile connection would experience your website.
Clearly communicate problems to your team and show off successes to clients.
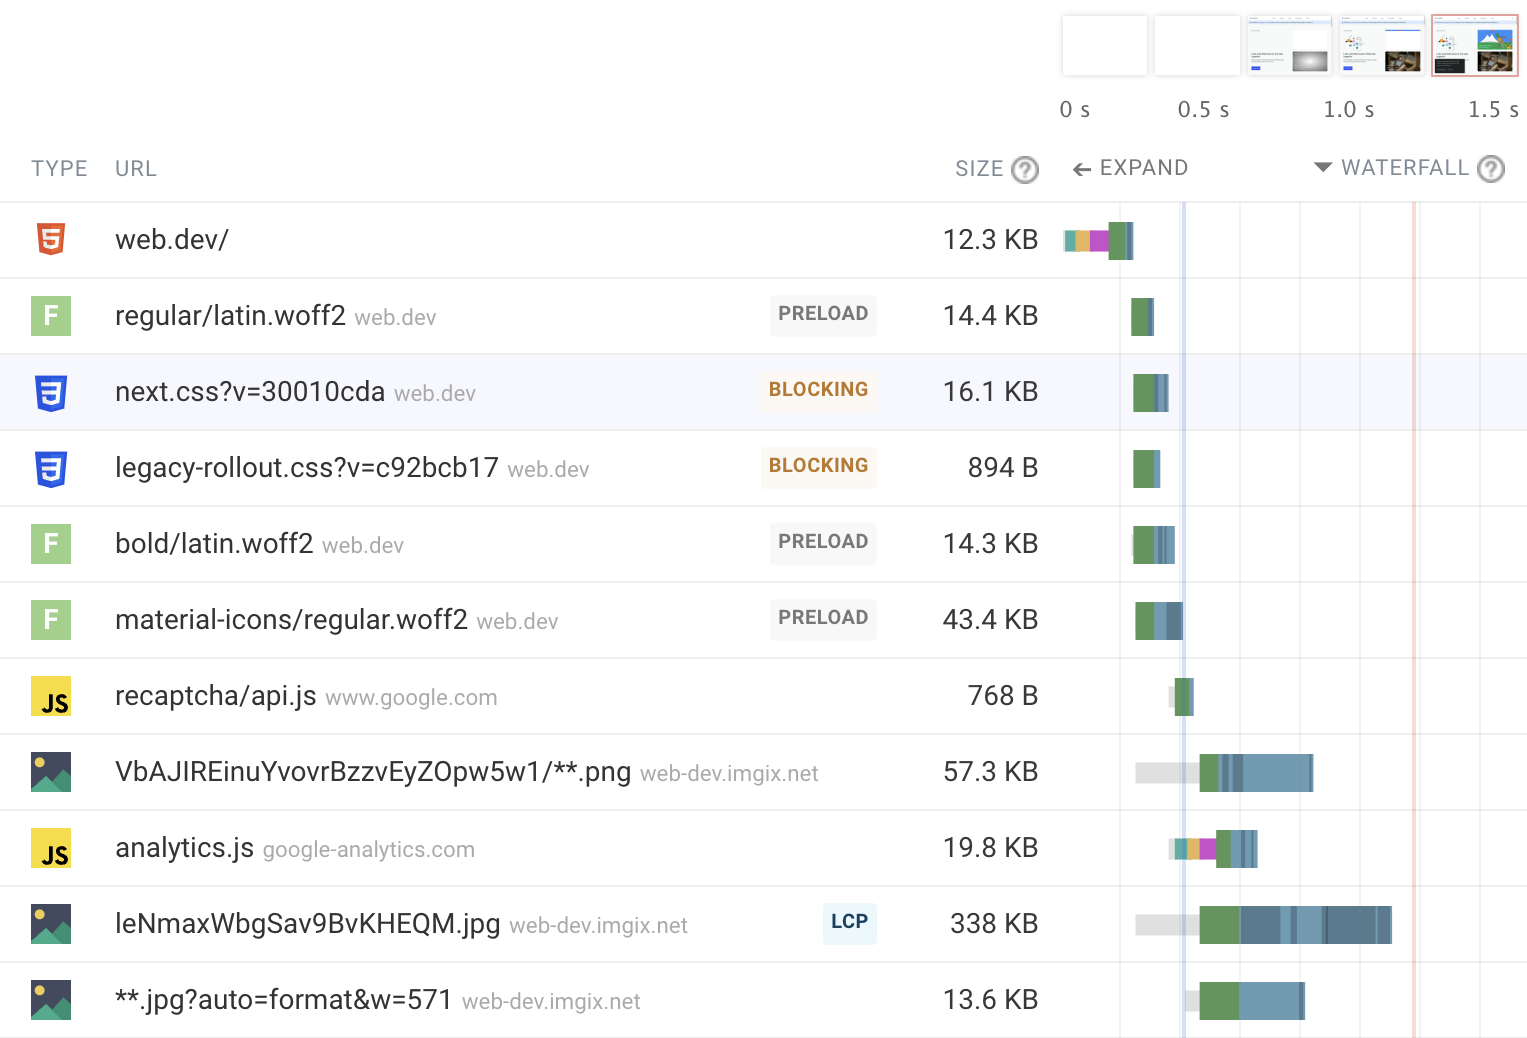
Network request waterfall
Get a detailed report on what's happening on your website.
Easily correlate network activity with CPU tasks and rendering progress.
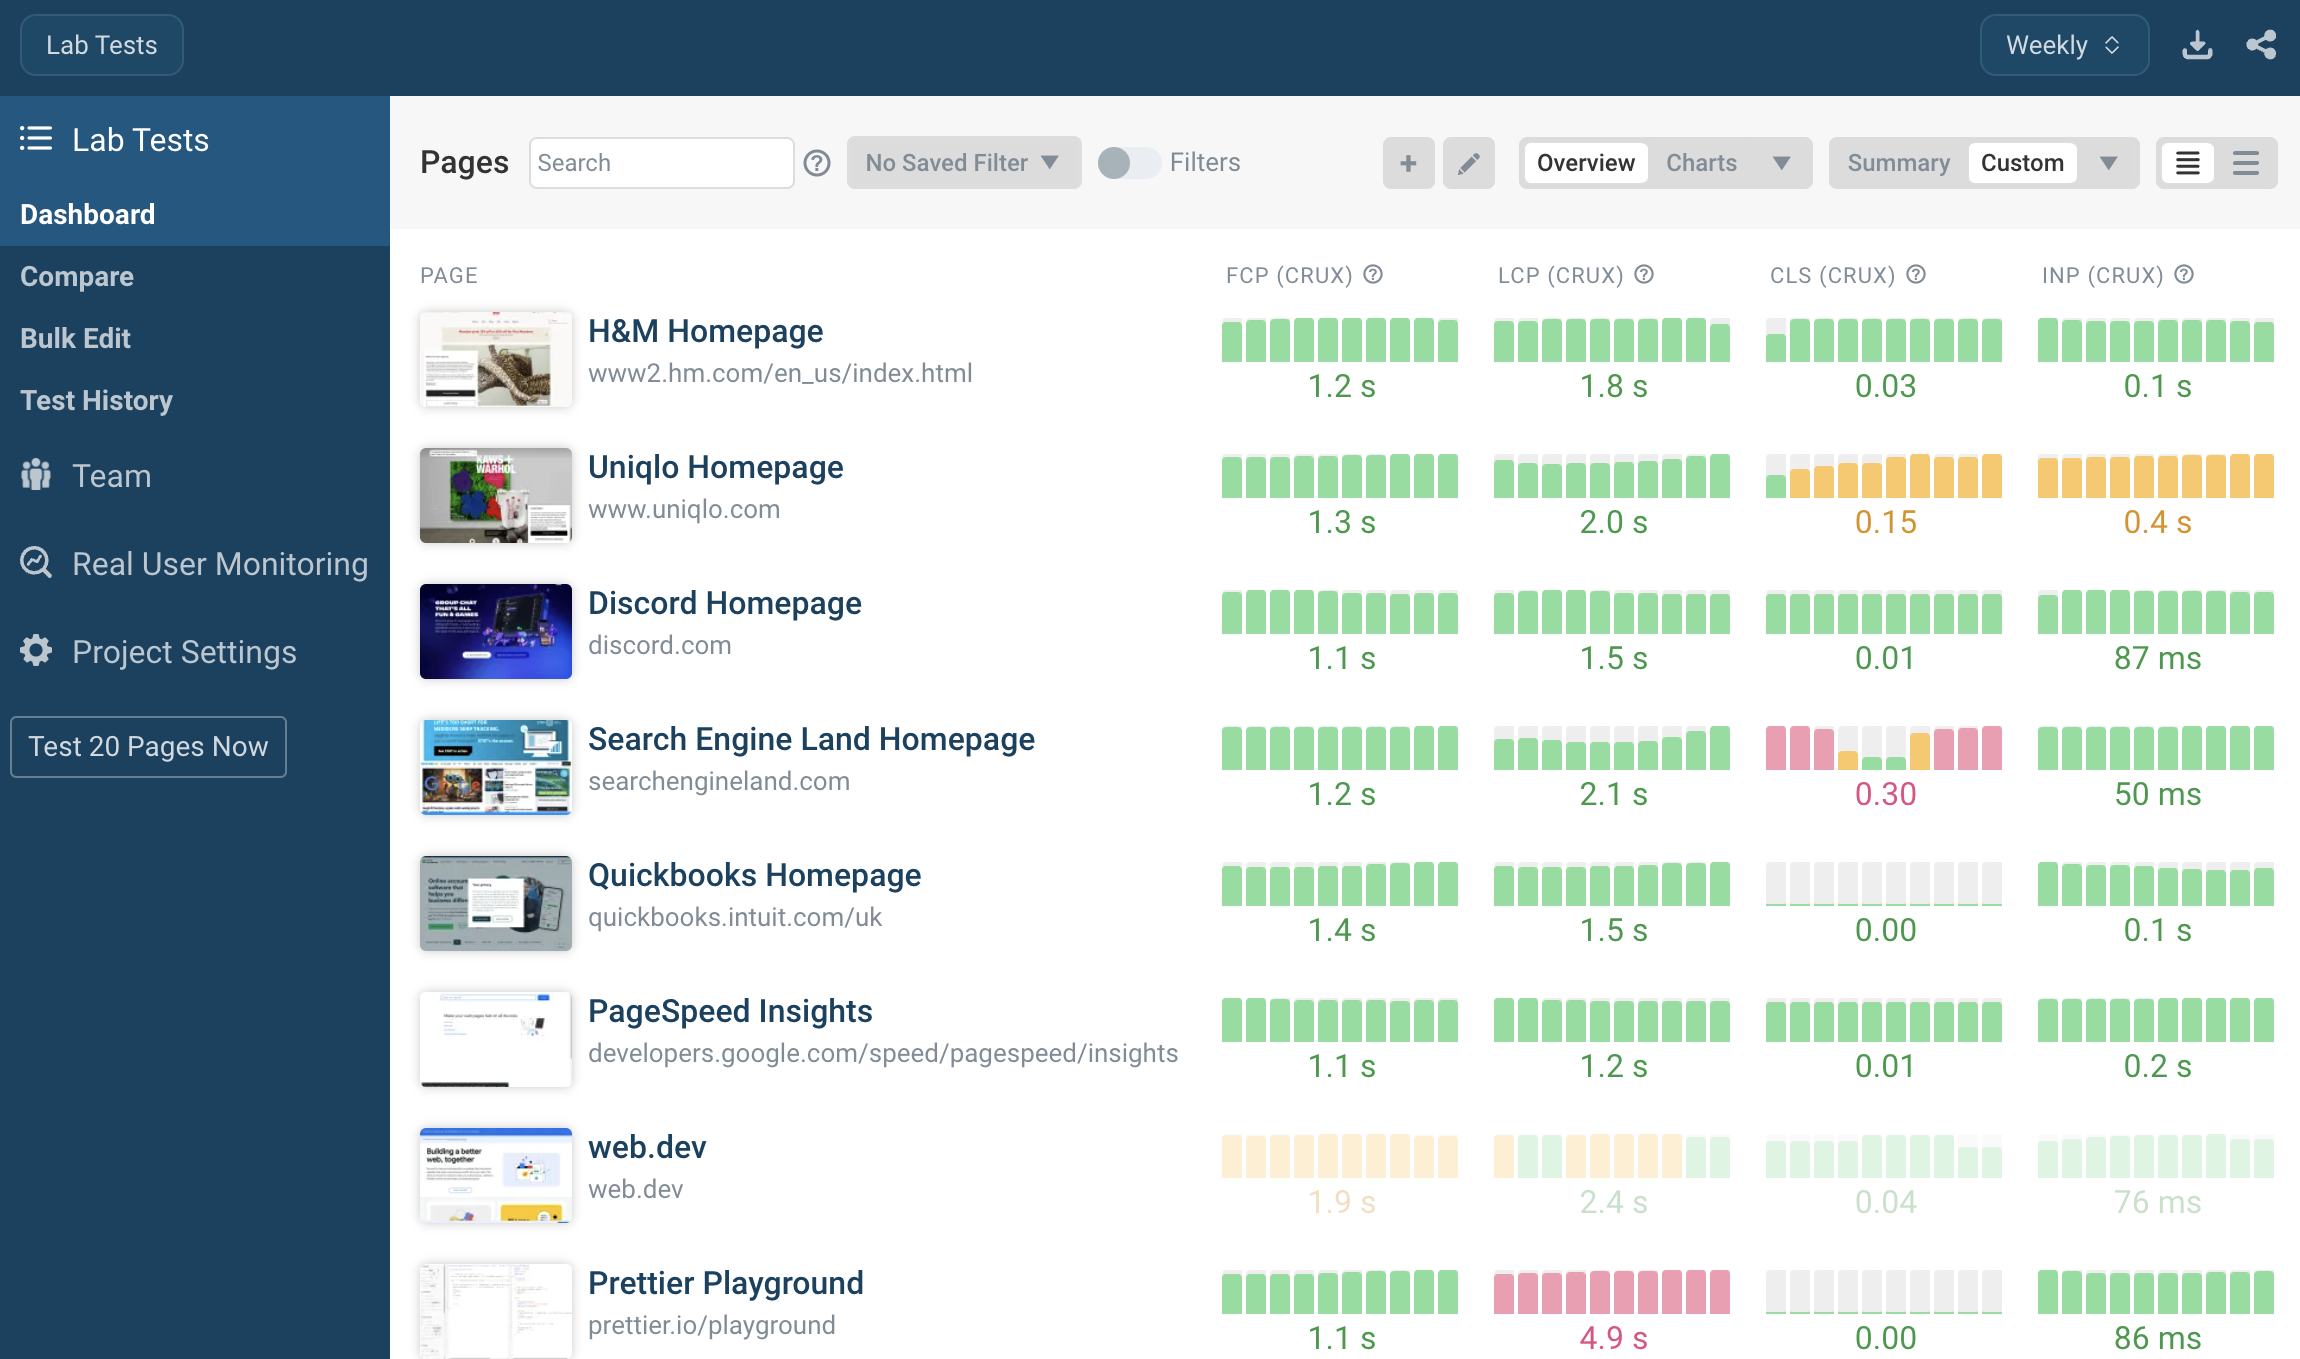
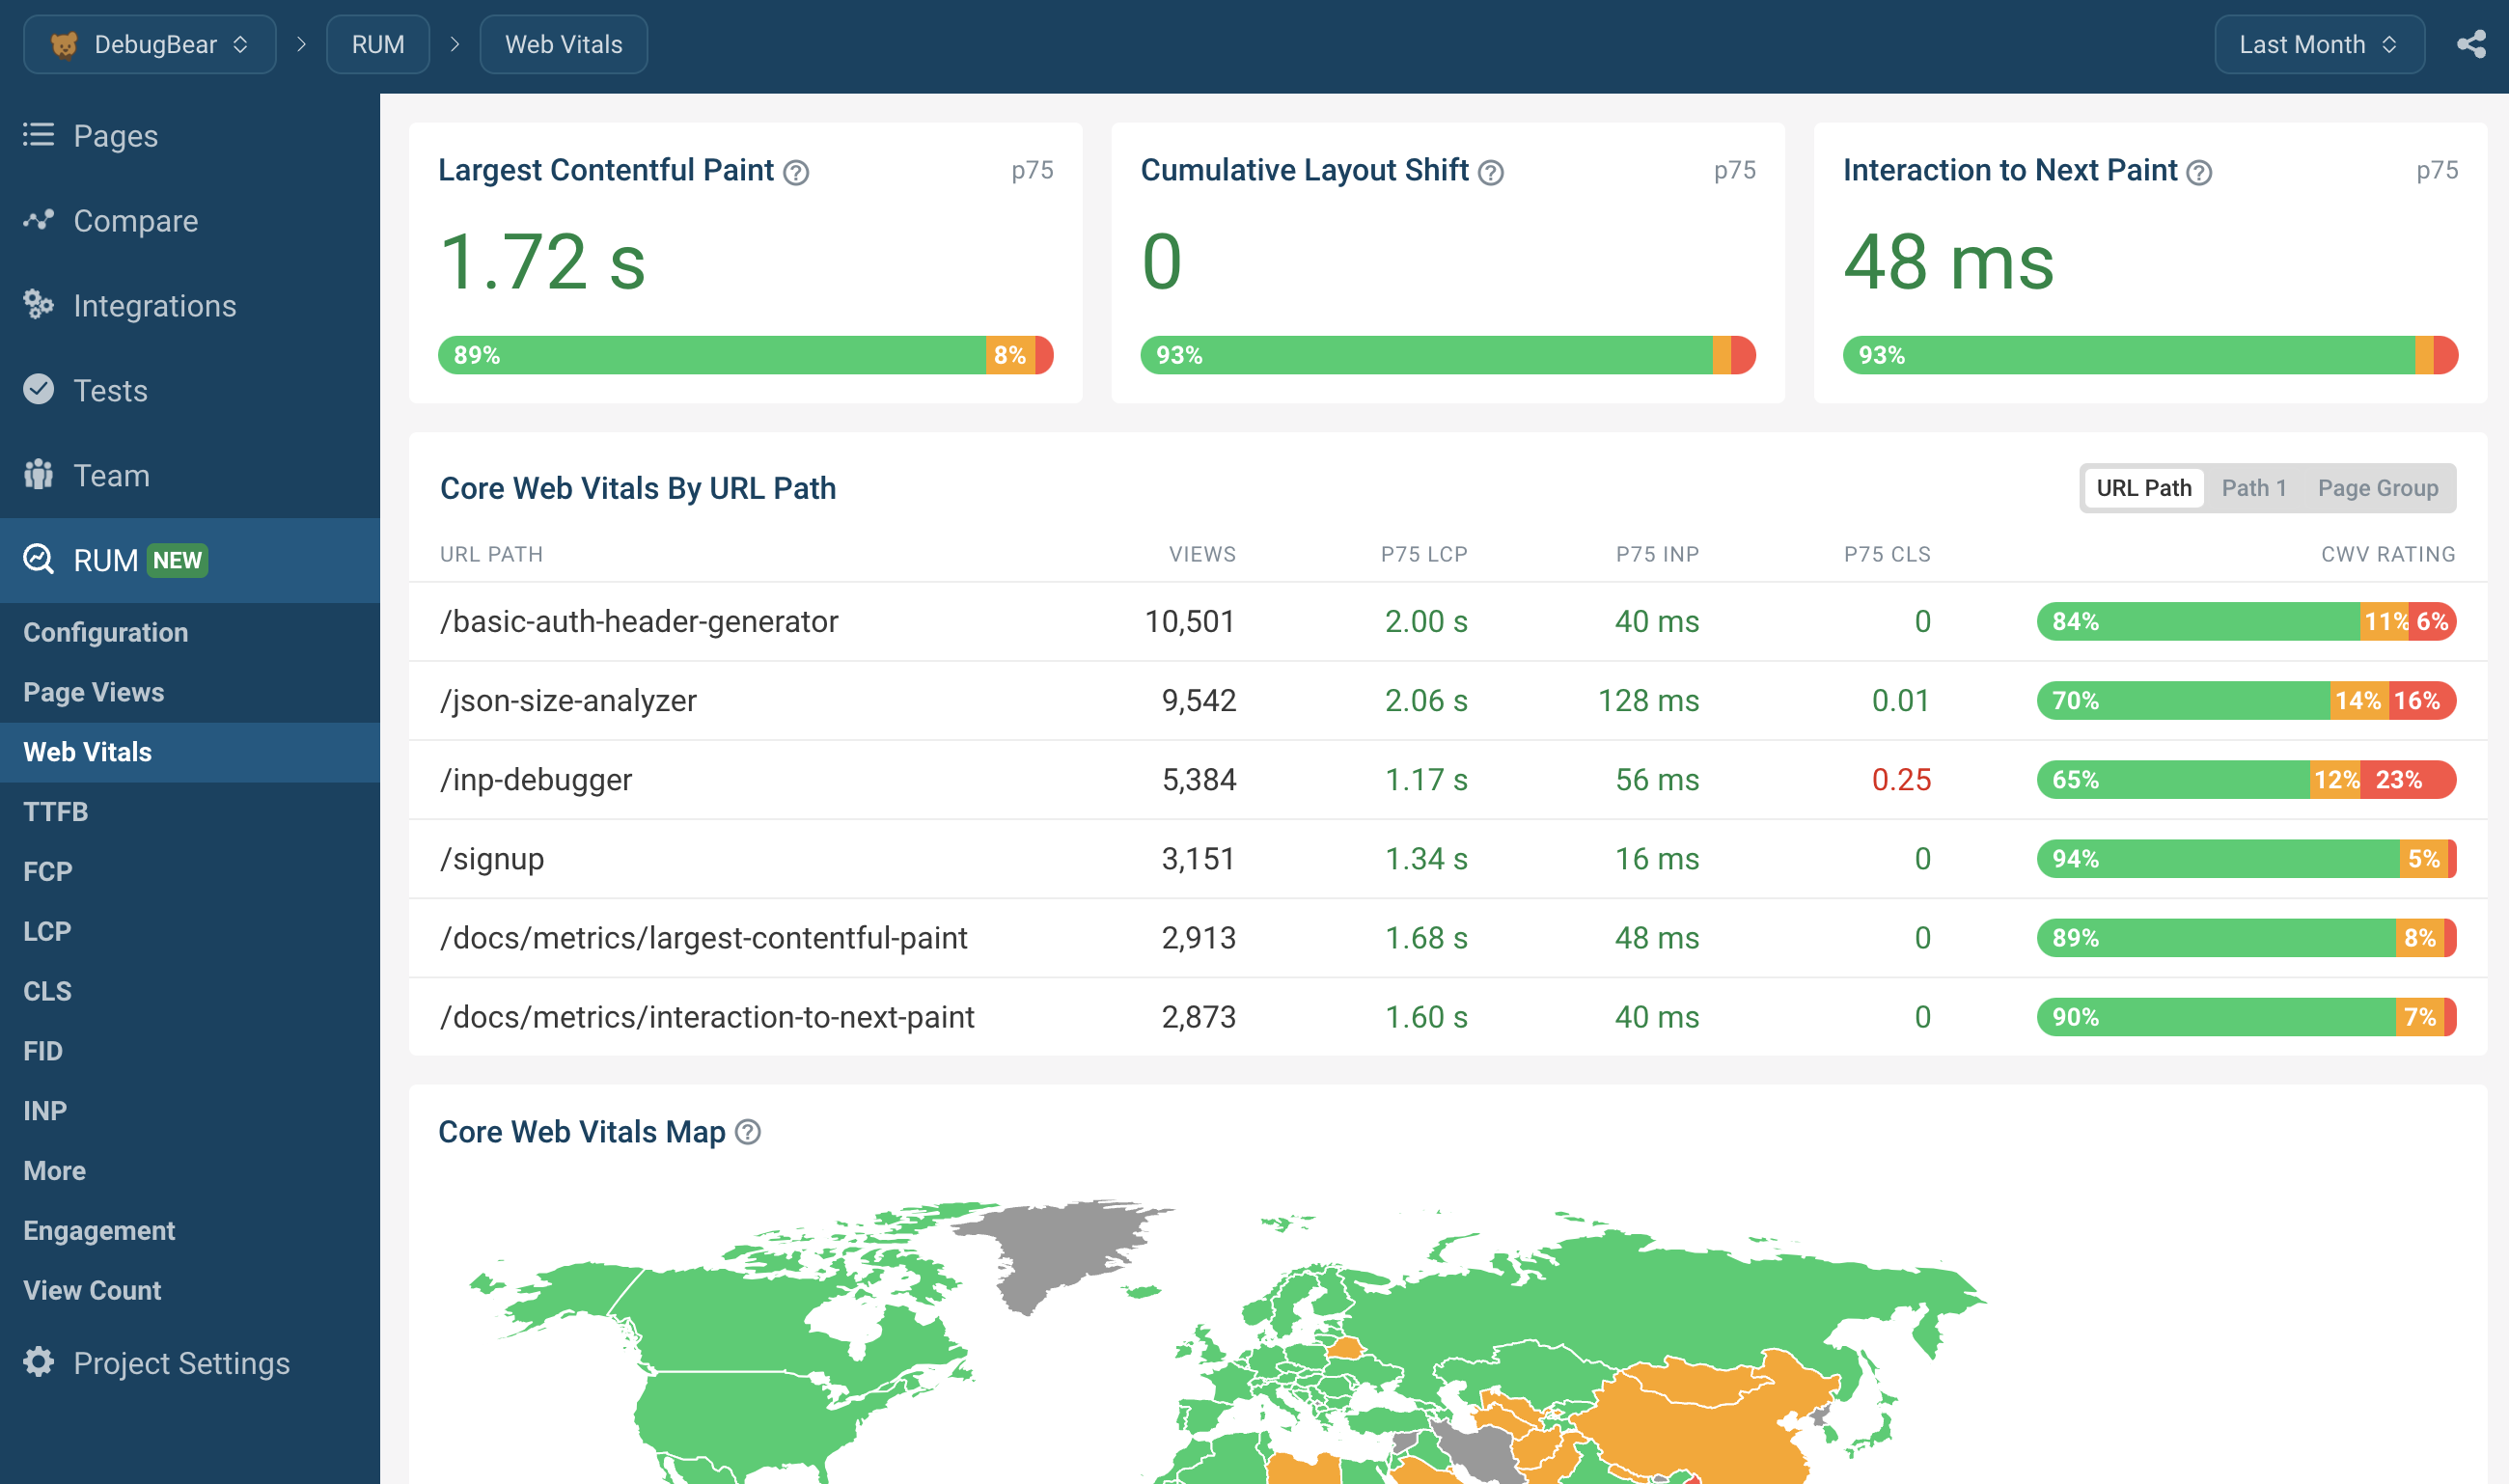
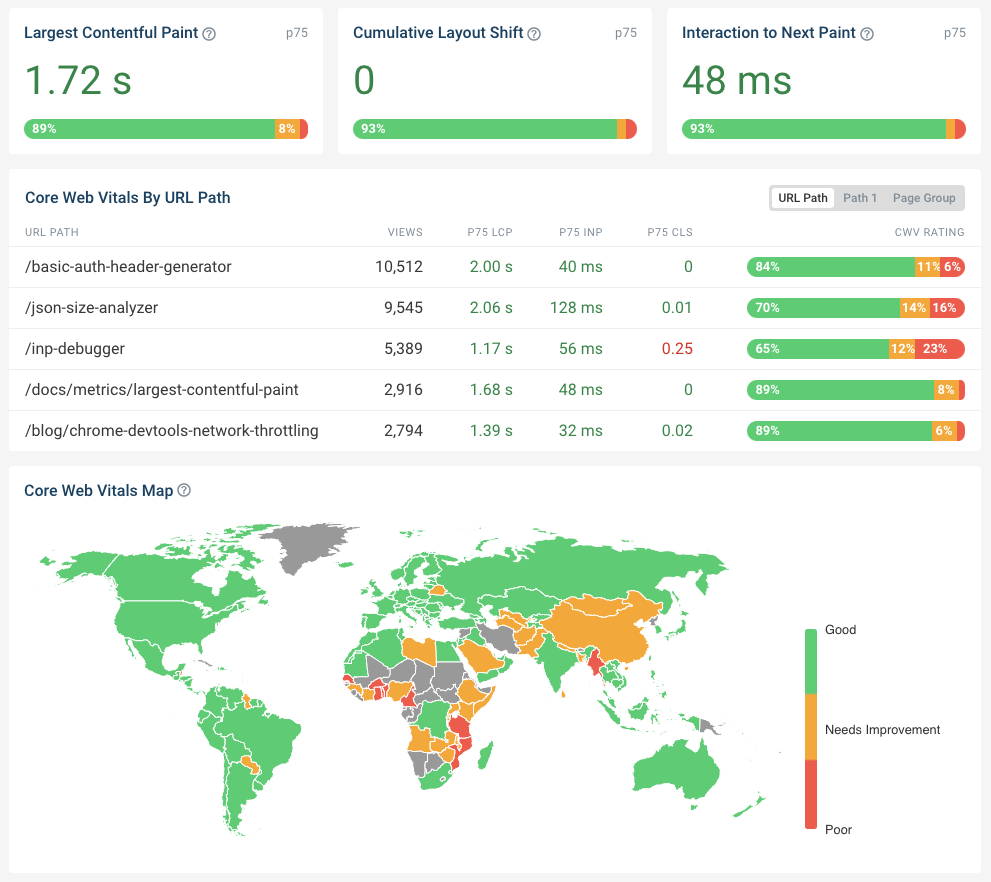
Optimize Core Web Vitals
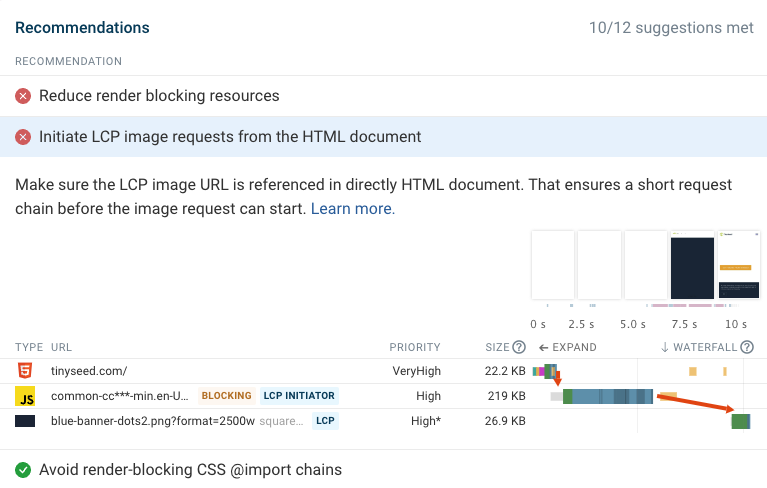
Performance recommendation
Test your website to see how you can make it faster.
DebugBear automatically identifies problems on your site
and highlights the data you need to fix them.
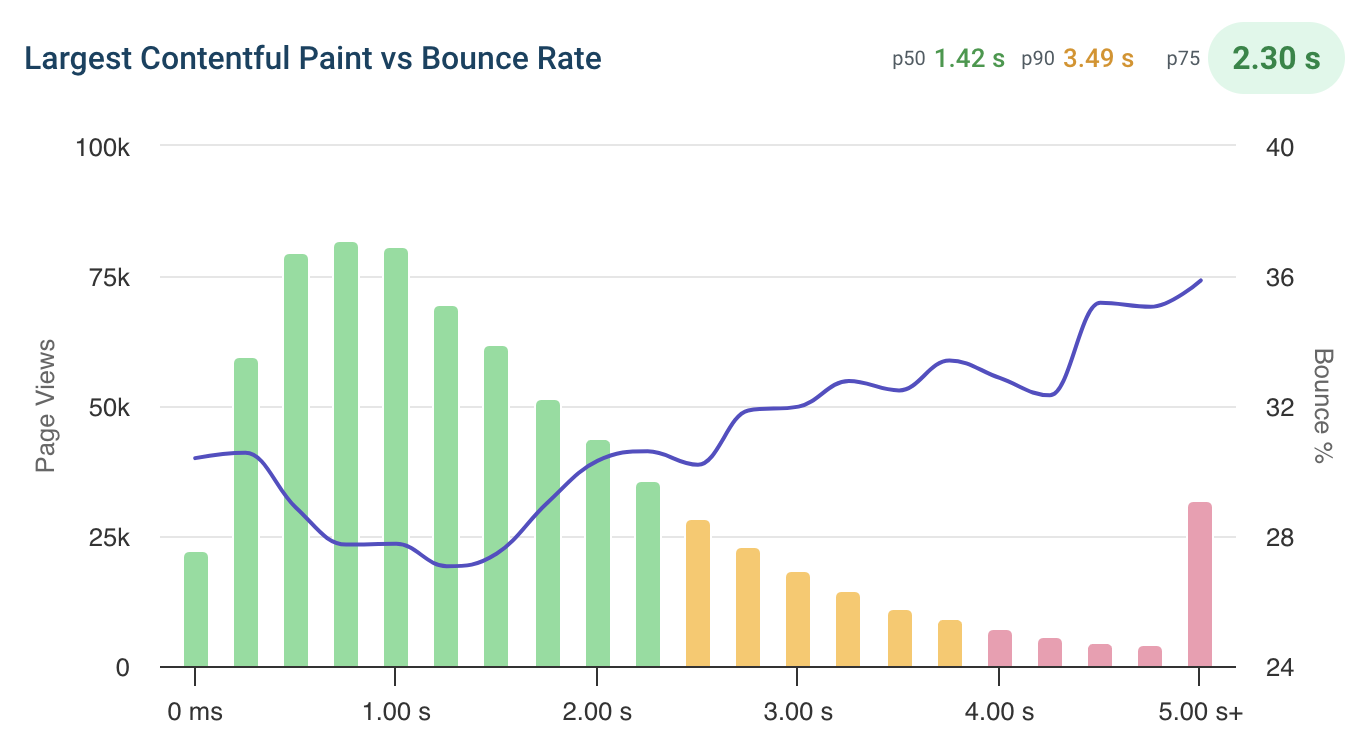
Debug data for every metric
Select one of over 70 metrics and view the data you need to optimize it.
Added a new render-blocking script?
Uploaded a 5 MB image?
Got a slow server response?
Use our zero-config automatic alerts, or set custom thresholds.
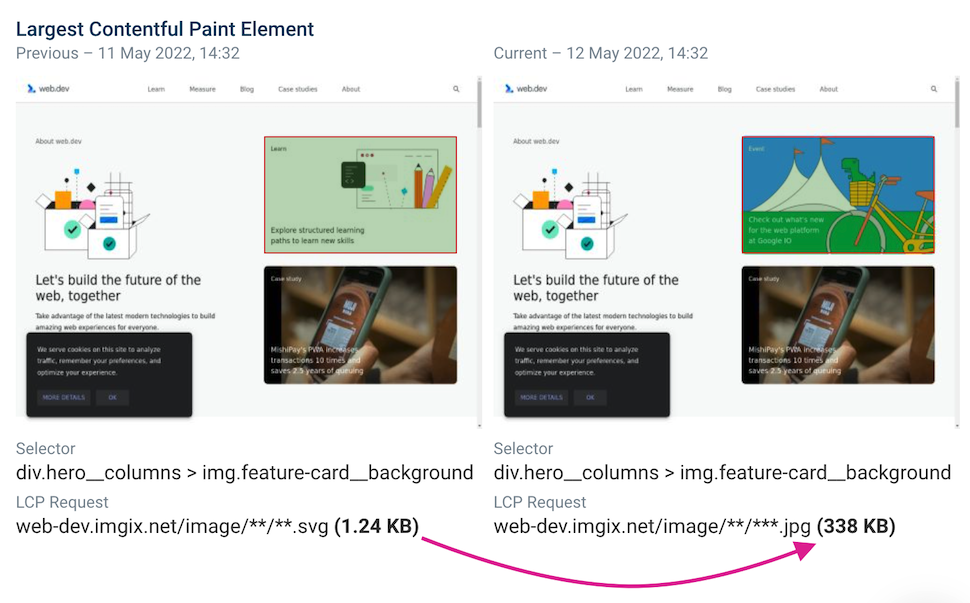
Compare test results
Wondering why your site got slower? Use our in-depth before and after comparison to see exactly what changed.
”DebugBear delivers the
best stats for before and after changes
in exquisite detail. It also shows clear and easy to find data for
Google's Web Vitals.
”The reporting data is very helpful in pinpointing what causes
site speed issues – immediately actionable.
It's well above and beyond the info you get from Lighthouse
and the performance tests through Chrome.“
Loren McDonald
IT Director
”The most actionable-info packed page speed visualization
available. DebugBear provides unique features that are crucial
to debugging complex issues, like request-chain visualization."
Robin Marx
Web Protocol and Performance Expert
”DebugBear's alerts are our early warning system. They catch new scripts that could slow us down before they become a problem.”