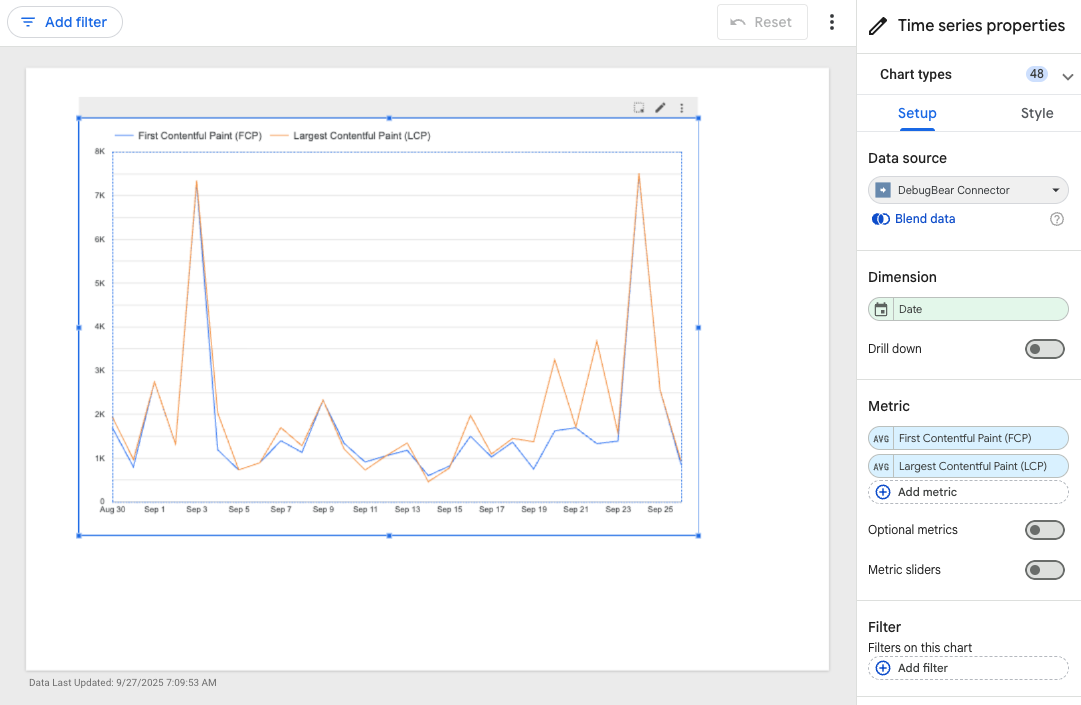
Fix Core Web Vitals errors in Google Search Console
DebugBear continuously checks the performance of your website and tells you how to speed it up.
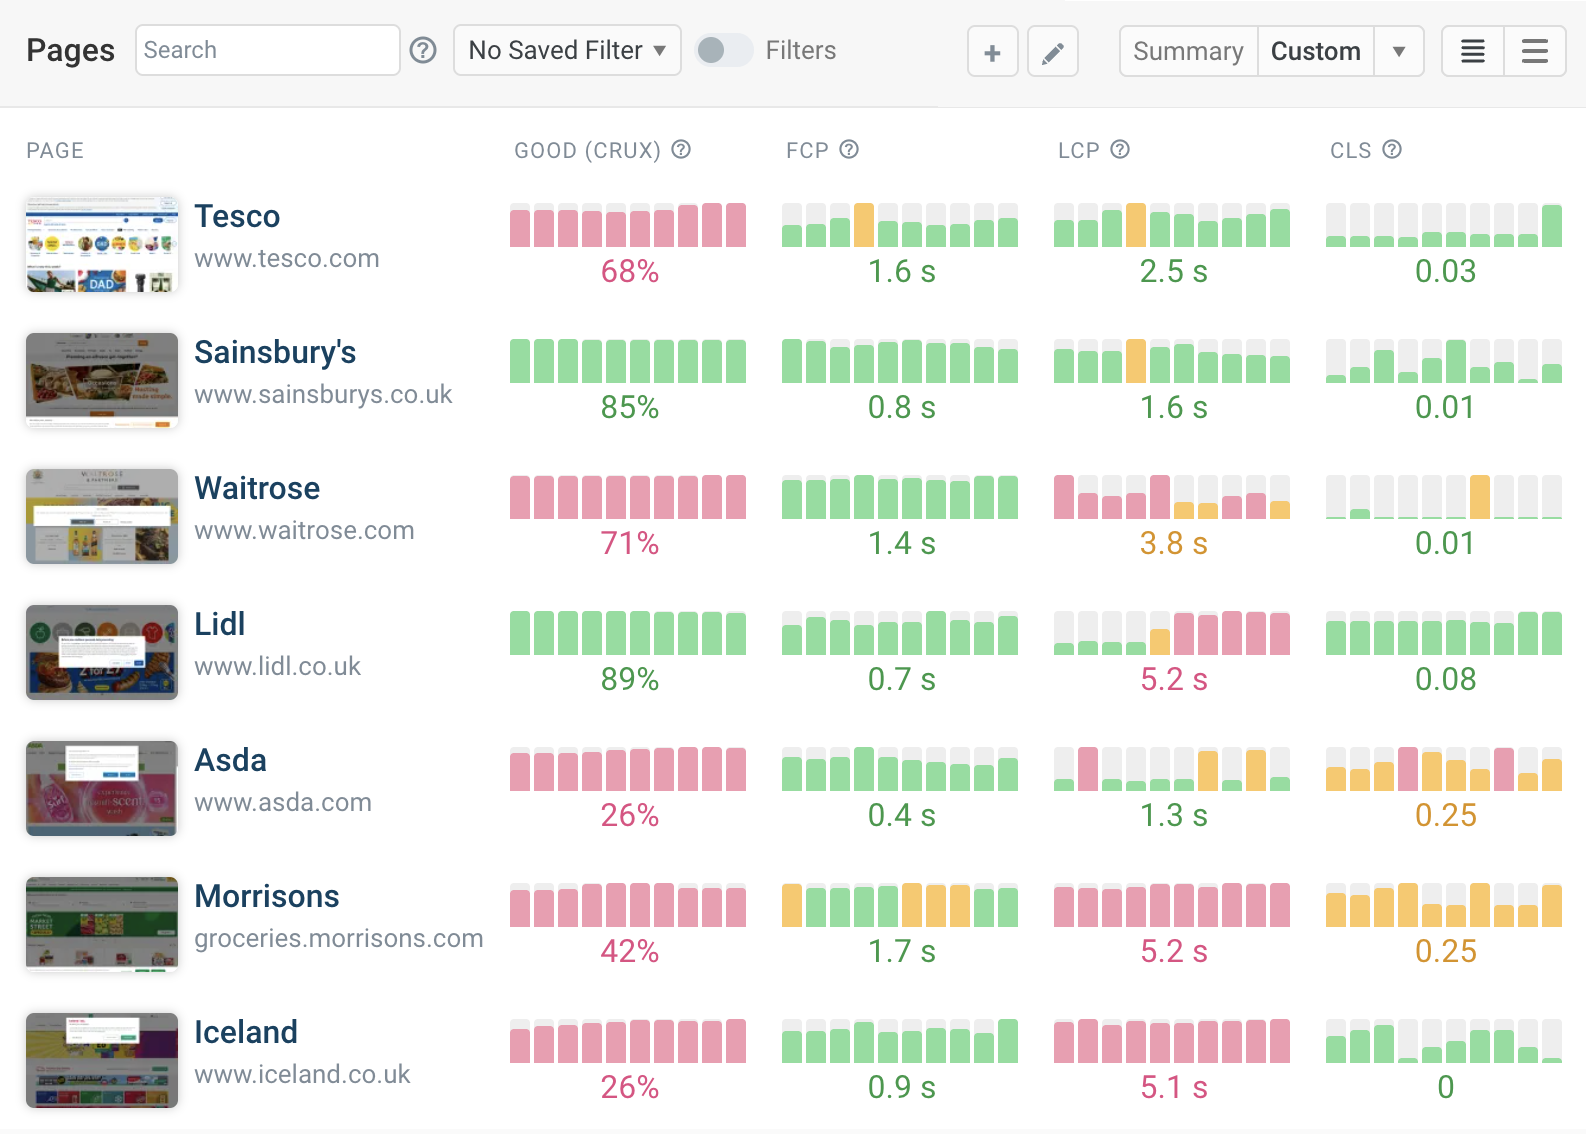
Check if you meet Google's "Good" experience threshold
In addition to running our own tests we also use Google's API to check how
many real users have a good experience on your website. At least 75% of visitors
need to have a good experience to get the maximum ranking boost.
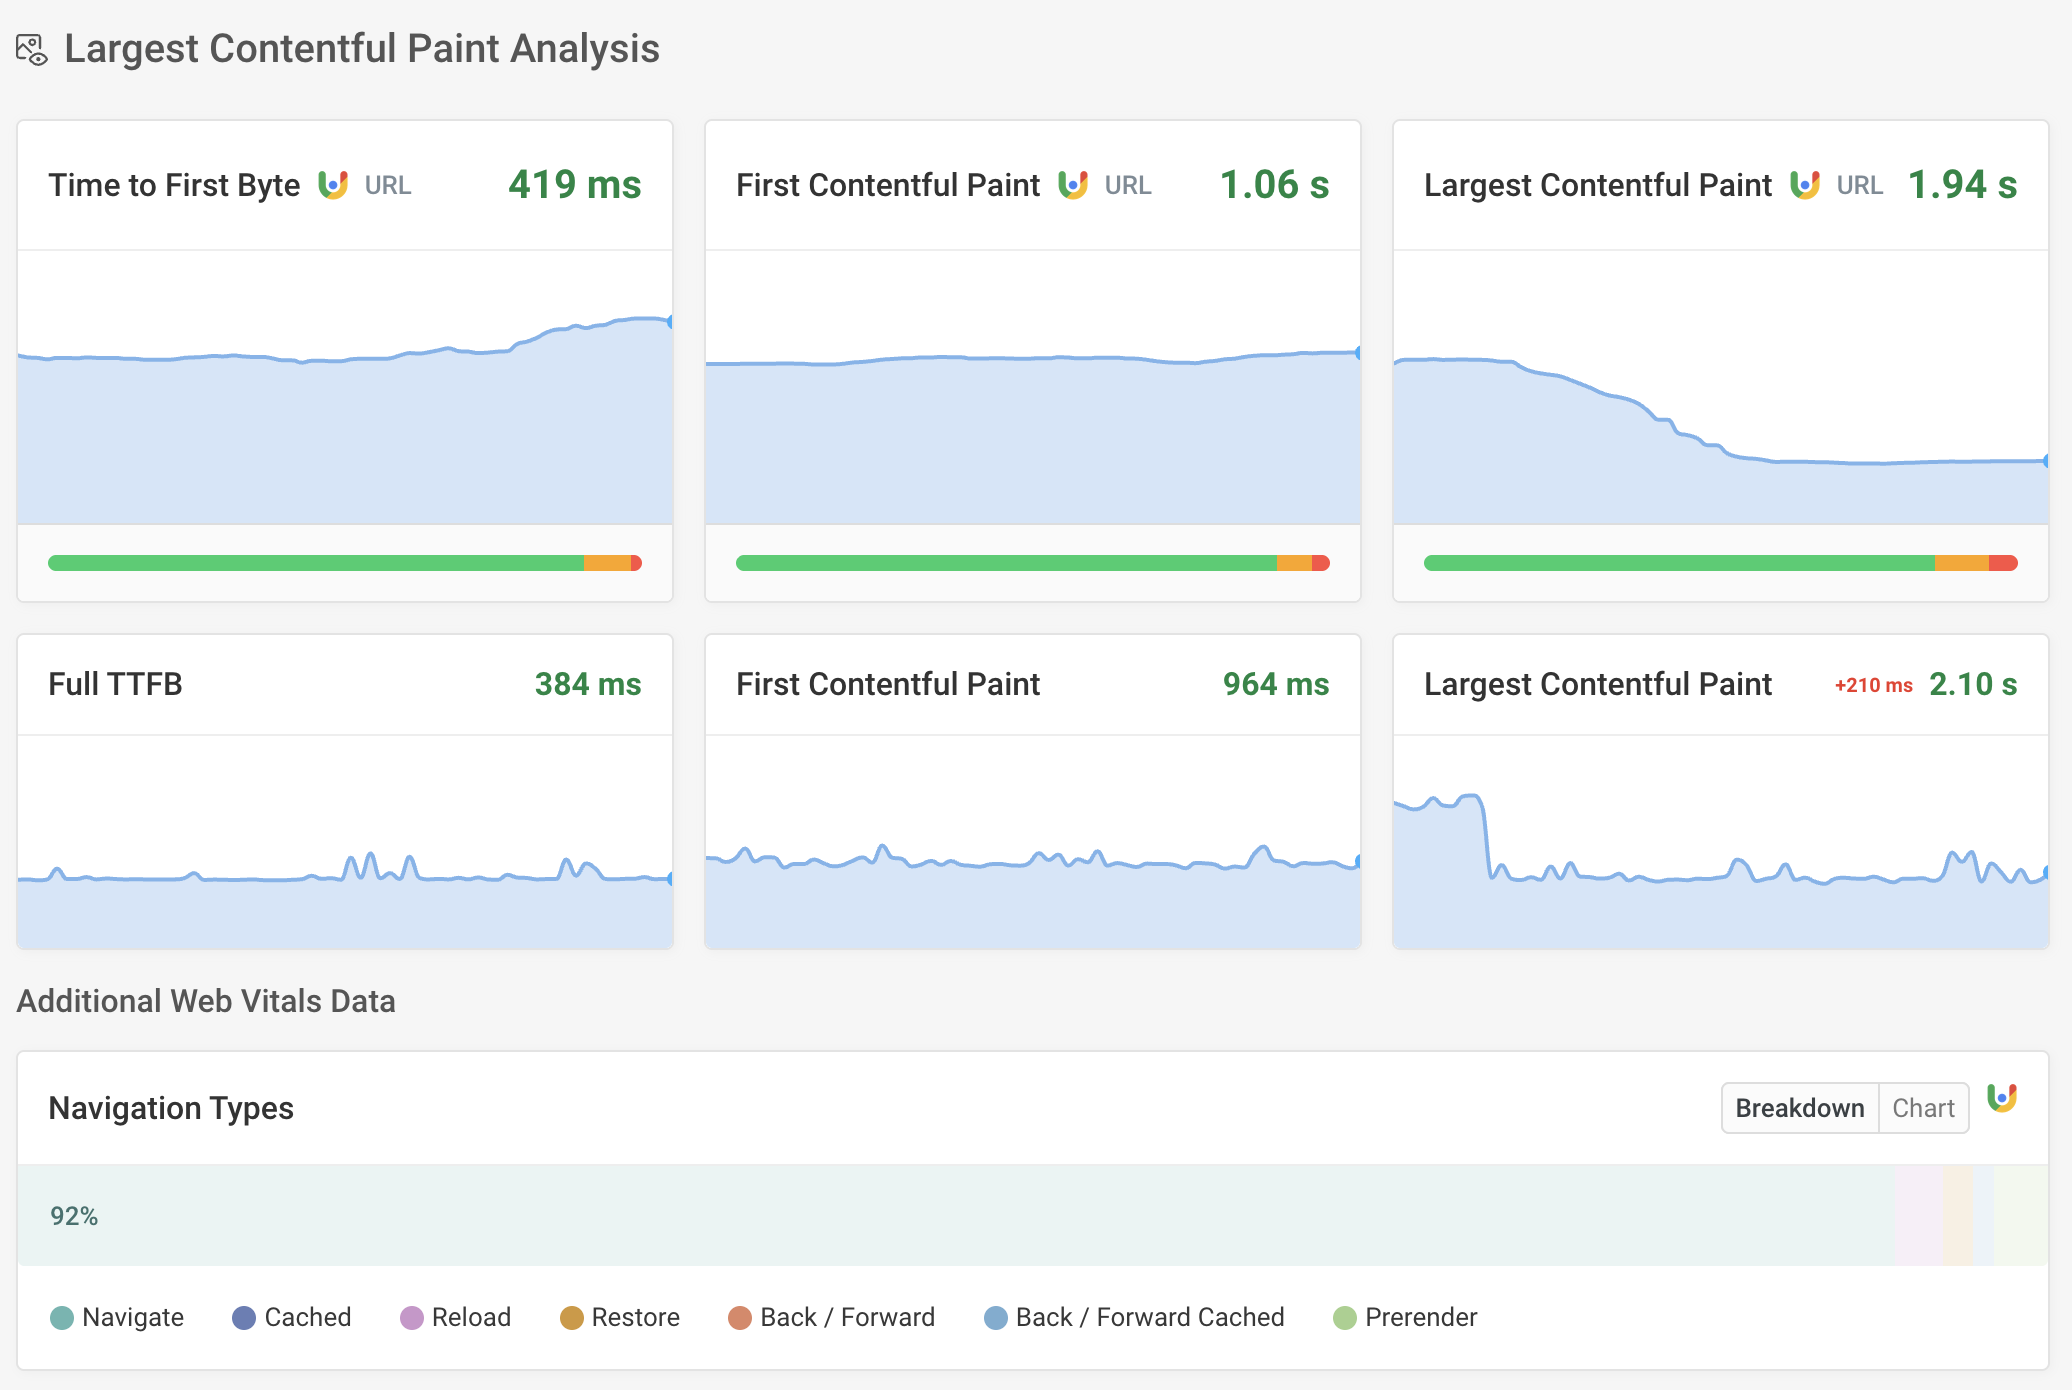
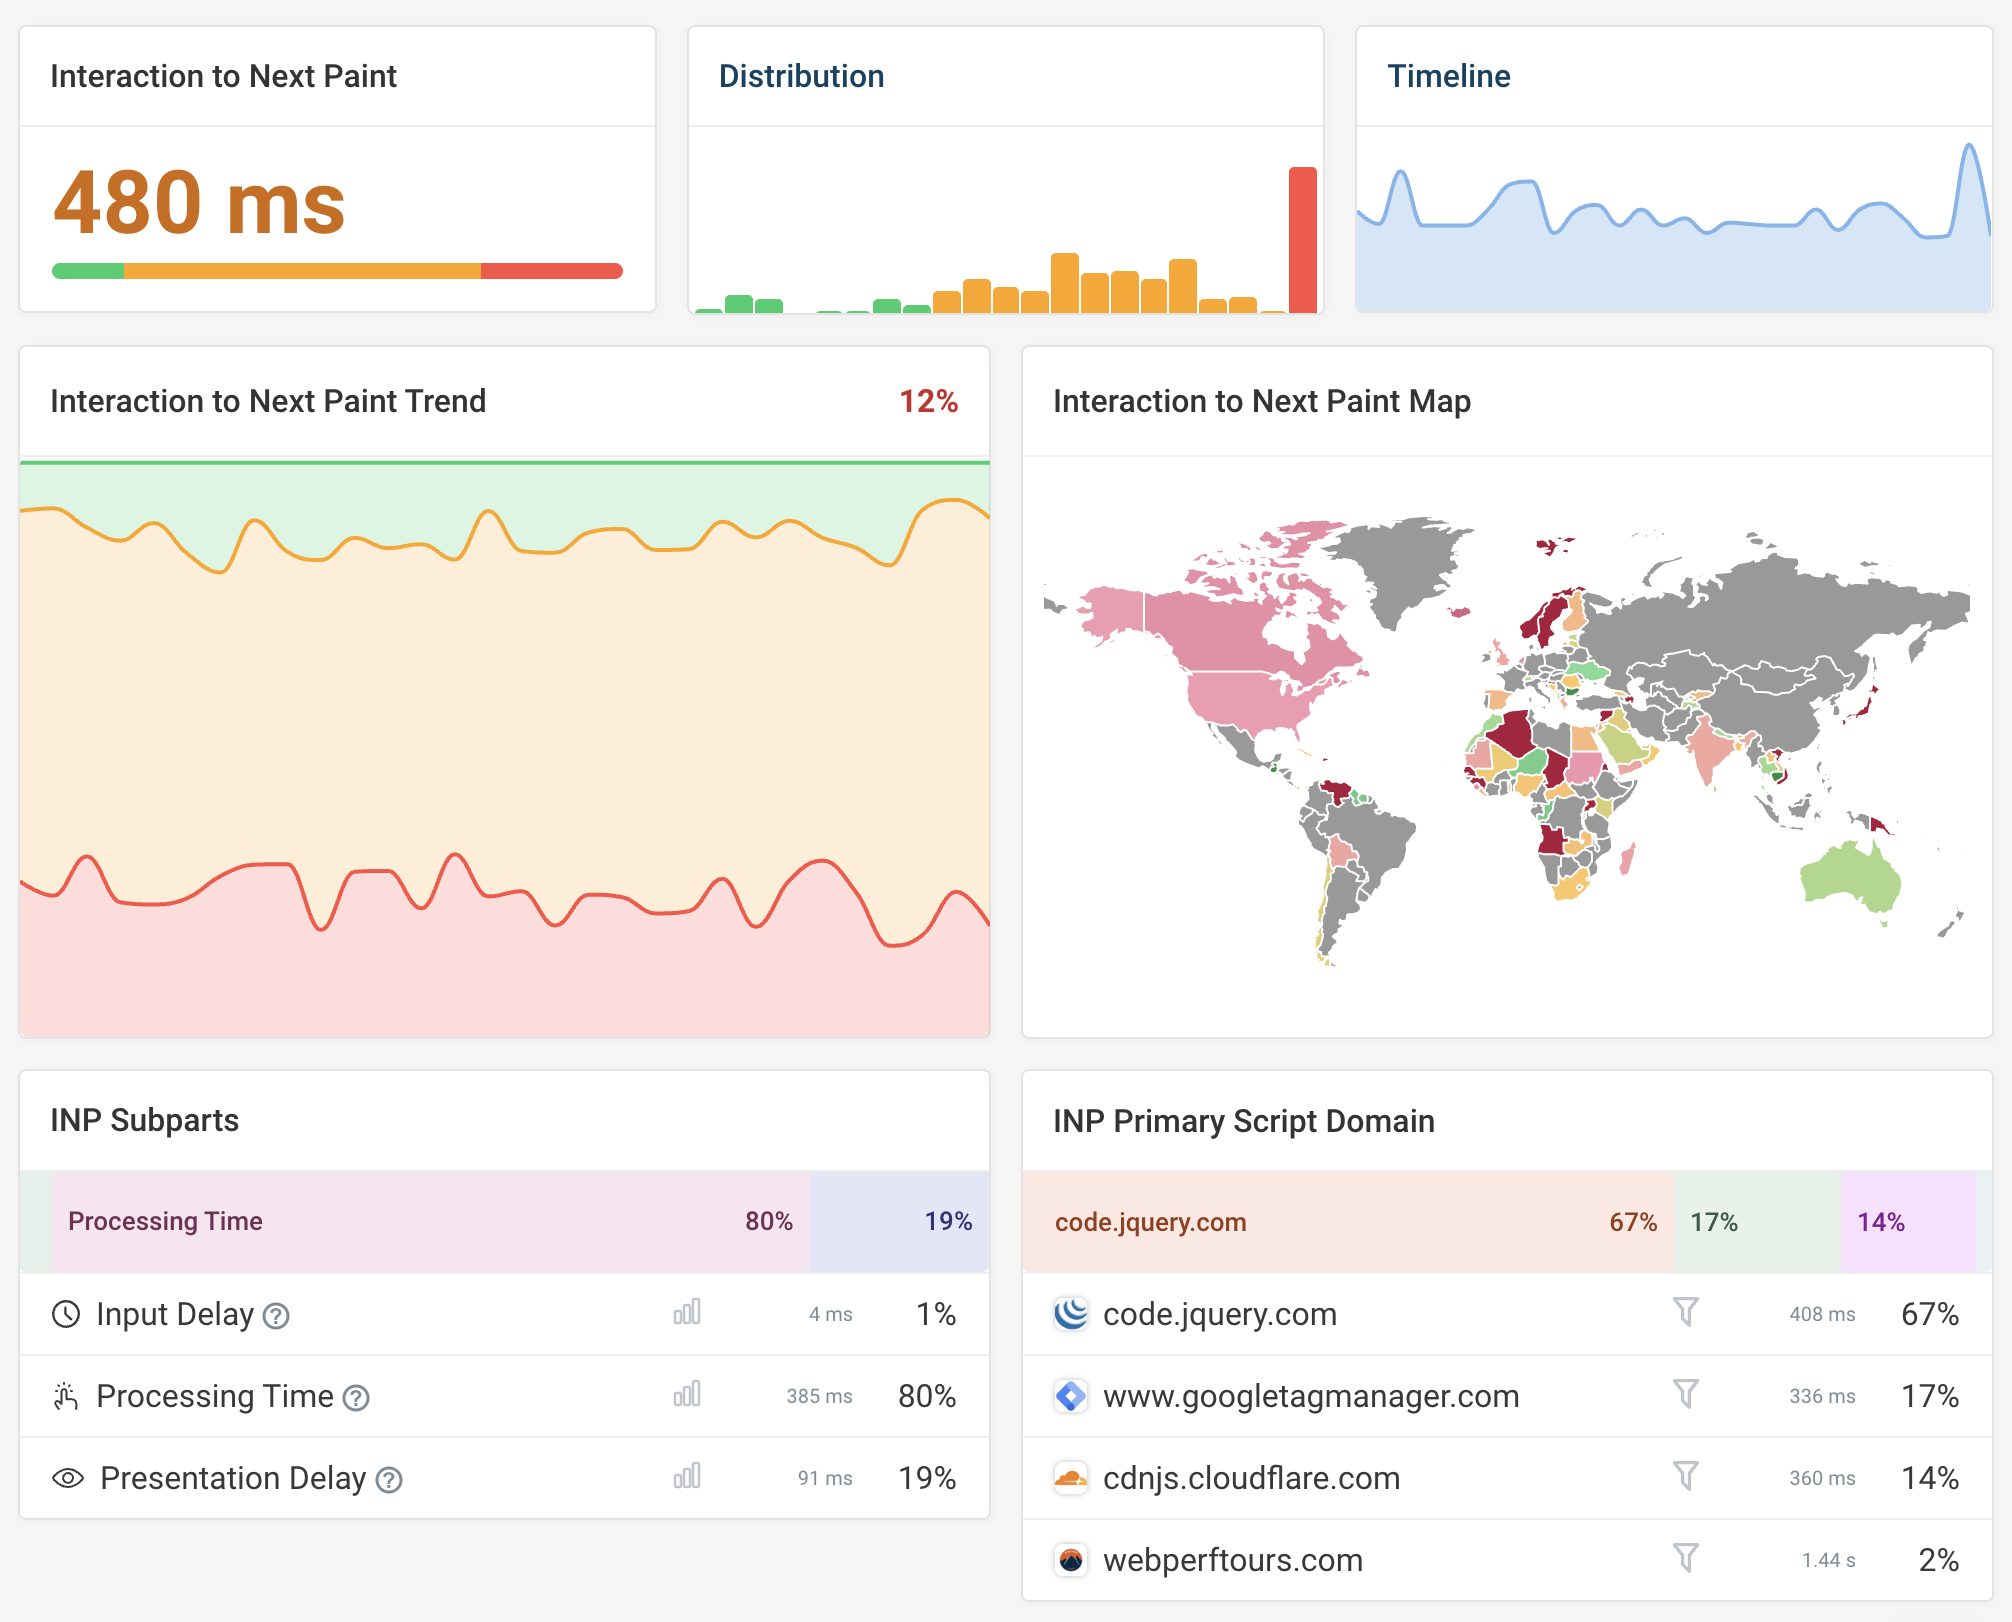
Real user metrics from the Chrome User Experience Report
Google uses CrUX data from real
Chrome users to determine how high your website ranks in search results.
We track these metrics over time.
In-depth reports to fix your page speed
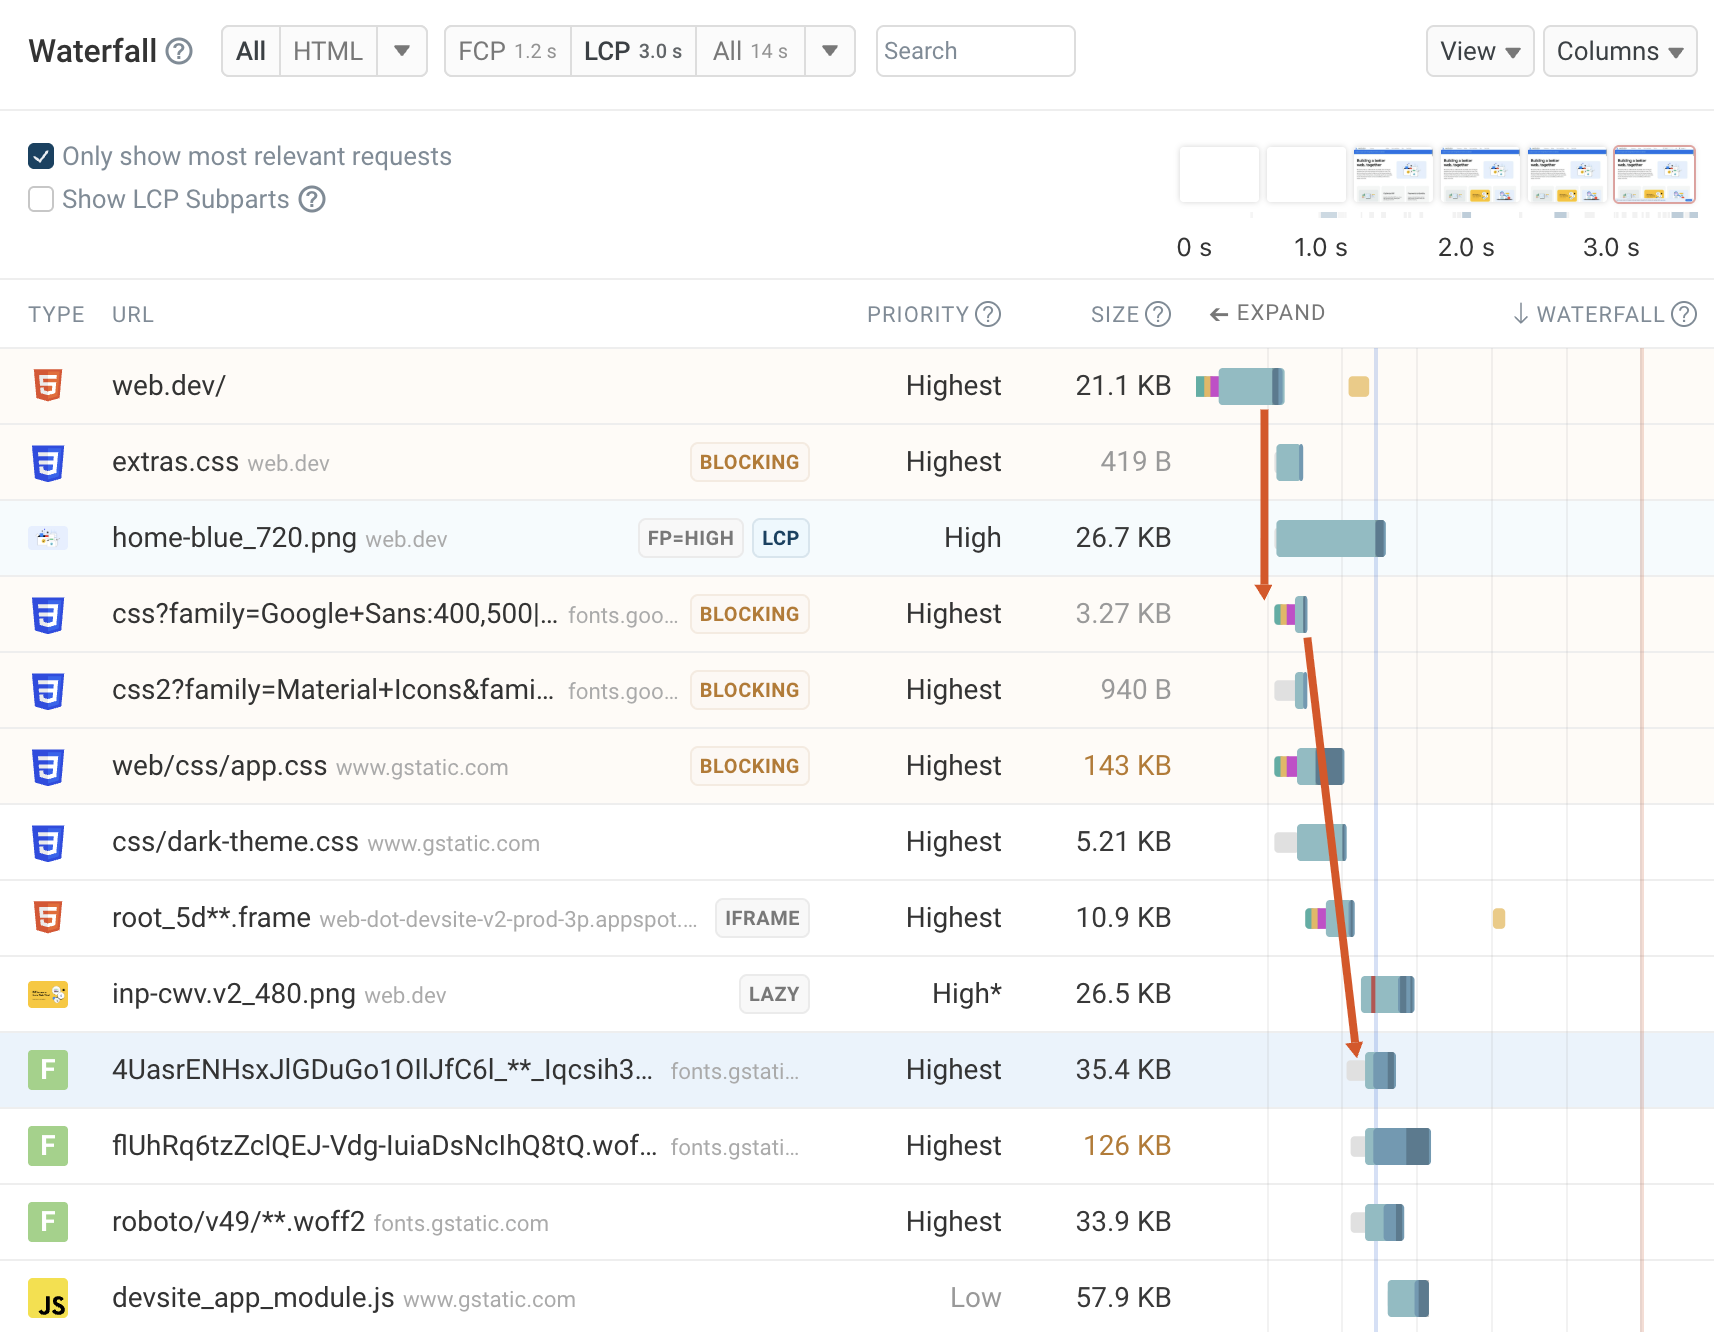
Request waterfall
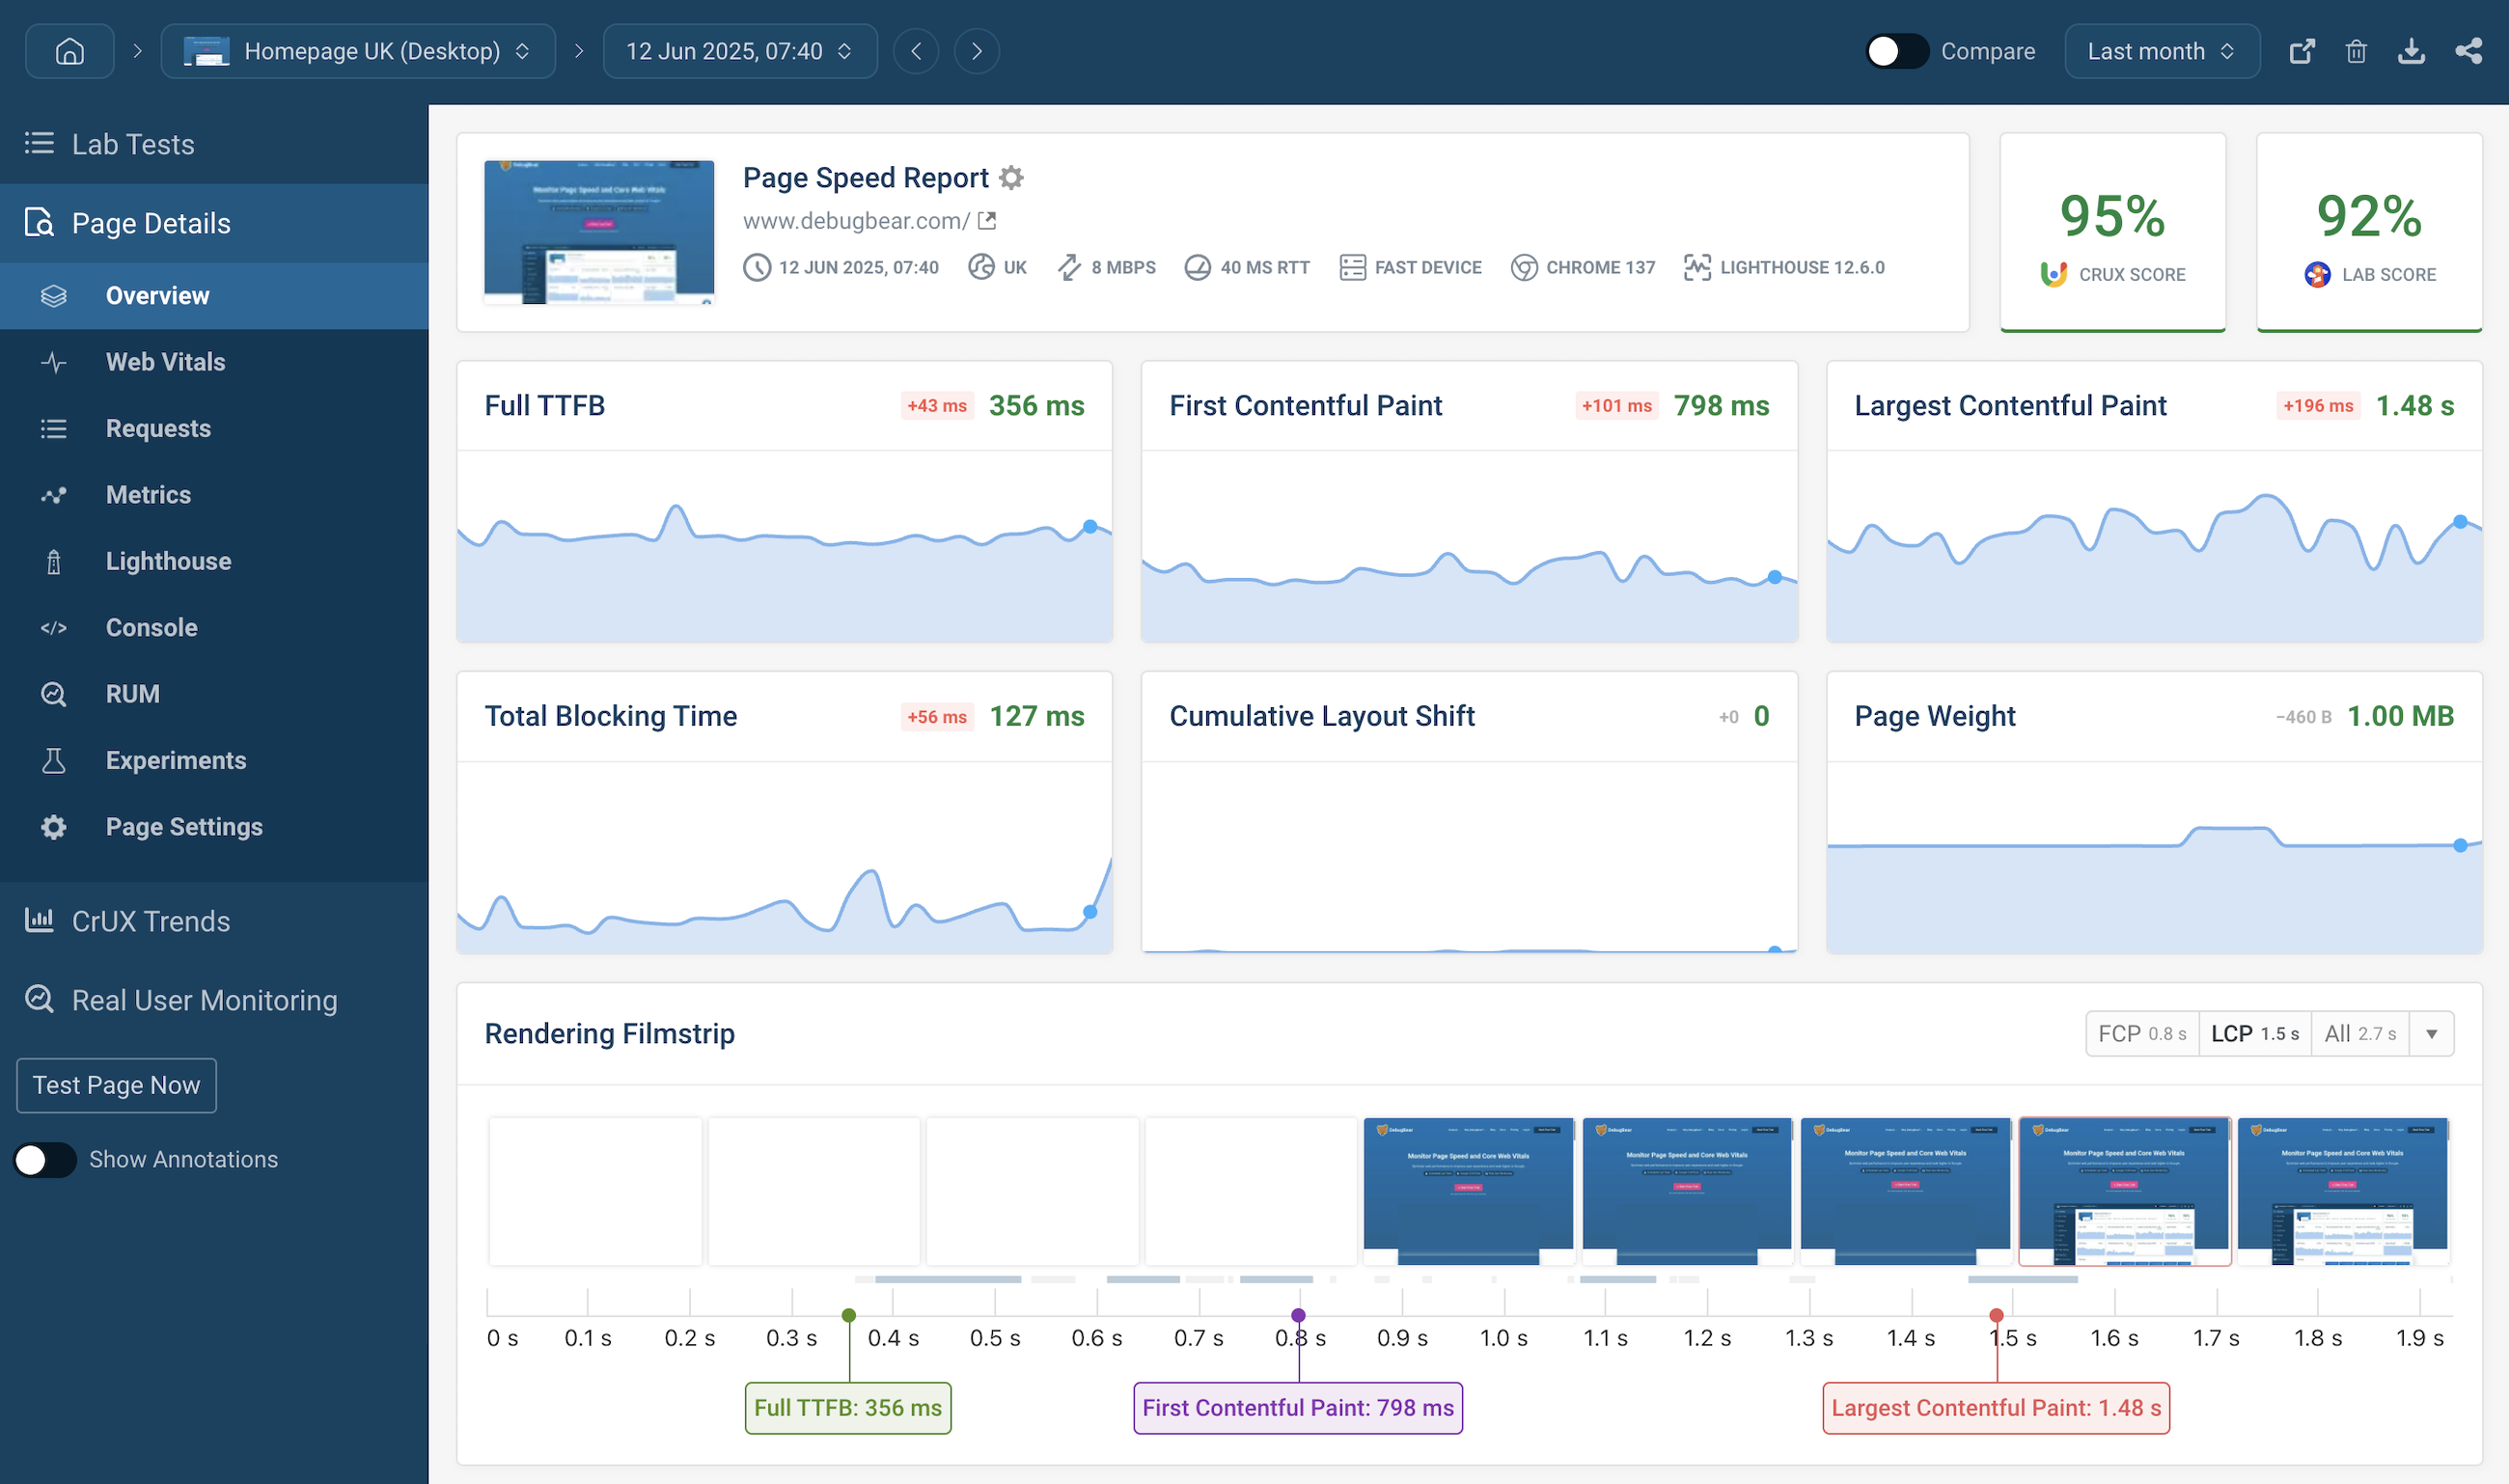
See network requests, CPU activity, and rendering progress in one place
and understand the loading behavior of your website.
Video recording
Watch how your website renders on a mobile device and step through the recording frame by frame.
Core Web Vitals recommendations
See what you can do to speed up your website and run experiments to estimate the performance impact.
”DebugBear delivers the
best stats for before and after changes
in exquisite detail. It also shows clear and easy to find data for
Google's Web Vitals.
”The reporting data is very helpful in pinpointing what causes
site speed issues – immediately actionable.
It's well above and beyond the info you get from Lighthouse
and the performance tests through Chrome.“
Loren McDonald
IT Director
”The most actionable-info packed page speed visualization
available. DebugBear provides unique features that are crucial
to debugging complex issues, like request-chain visualization."
Robin Marx
Web Protocol and Performance Expert
”DebugBear's alerts are our early warning system. They catch new scripts that could slow us down before they become a problem.”