
CrUX and RUM data are two types of page speed measurements that are both collected from real website visitors.
However, there are some important differences between them and you’ll often see that they show slightly different values for the same website.
We’ll take a deeper look at the differences between the two metrics, how each data type is collected, and what their respective advantages are.
What is the Chrome User Experience Report (CrUX)?
Google collects real user website performance metrics from Chrome users. This data is then published to create the Chrome User Experience Report.
CrUX data is collected on desktop devices and on mobile devices running Android. Visitors using an iPhone or running browsers other than Chrome are not included in the measurements.
For Google to collect the data, Chrome users also need to be logged into their Google account and have usage statistics reporting enabled.
For privacy reasons, only a small number of metrics are reported, with a focus on the Core Web Vitals metrics.
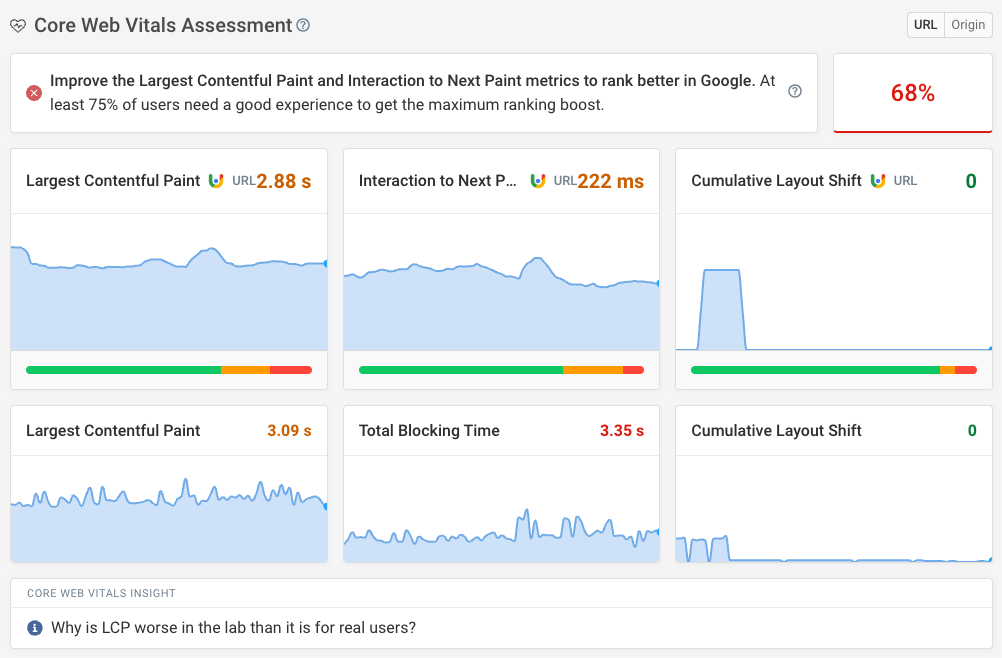
To view CrUX data for your website, you can run a website speed test.
What is Real User Monitoring (RUM)?
While CrUX data is collected by Google, real user monitoring data is collected and stored by the website operator or an external service provider used by them.
In theory, every user experience can be recorded, even across different browsers and device types. However, some users will have browser extensions installed that block this analytics data from being collected.
As RUM data isn’t shared publicly, it can be a lot more detailed than CrUX data. That means more metrics, more nuanced options to break down data, and the ability to investigate the performance of specific website visits.
To collect RUM data on your website, you need to set up a real user monitoring tool.
What are the differences between CrUX and RUM data?
CrUX and real user monitoring data differ in a number of ways:
- What website visits are included
- The level of diagnostic detail
- How quickly data updates
- What pages data is available for
- Setup requirements
- Available metrics
- Ability to benchmark competitors
- Impact on SEO
- Different statistical reporting methods
Let's take a more detailed look at each of these differences.
What website visits are included?
CrUX data is only collected in Chrome, while real user monitoring works in all browsers. In addition to that, CrUX does not provide any performance data for Chrome on iOS.
RUM data will generally cover more visits, as only a specific subset of Chrome users who’ve opted into Google’s data collection will be included in the CrUX data.
However, many website visitors also use browser extensions that block analytics data reporting. These visits will therefore not show up in RUM data, while they might show up in the CrUX dataset.
If you see different metric values in RUM and CrUX, this may be partly due to the data covering a slightly different set of users.
Real user monitoring tools report visits from all browsers, but the full set of Core Web Vitals metrics can only be reported in Chrome. Firefox only supports the Largest Contentful Paint metric, while Safari doesn’t support any of the three web vitals. However, you can still look at metrics like Time to First Byte and First Contentful Paint in Safari.
Diagnostic detail for debugging page speed issues
While CrUX data is purely numeric, telling you how fast your site is, RUM data includes additional diagnostic information that can inform how you optimize your website.
Lab data is the most detailed form of website performance data, but this level of data isn’t possible for real user metrics as browsers don’t make the necessary reporting functionality available.
However, RUM data can still provide a lot of detail that goes beyond CrUX metrics, for example:
- What element triggers the Largest Contentful Paint?
- What interactions and scripts are slowing down the Interaction to Next Paint metric?
- Request waterfalls showing when different resources load
- Did the page URL change before a layout shift occurred?
- Are poor experiences more common on specific device types?
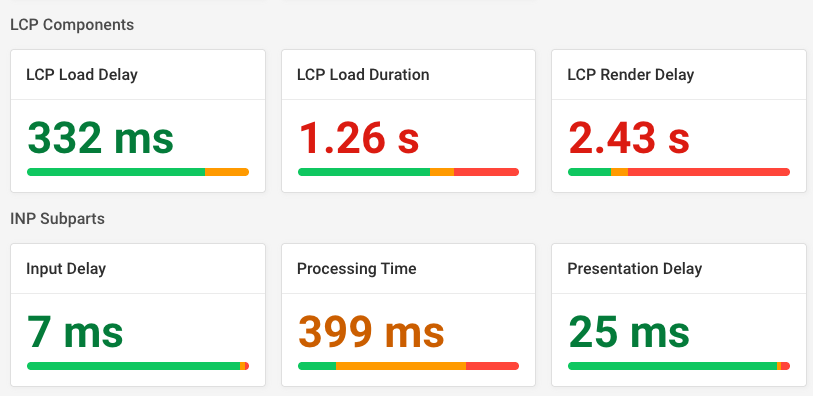
For example, here’s a screenshot from DebugBear’s RUM tool. It shows a breakdown of different LCP scores for different page elements.
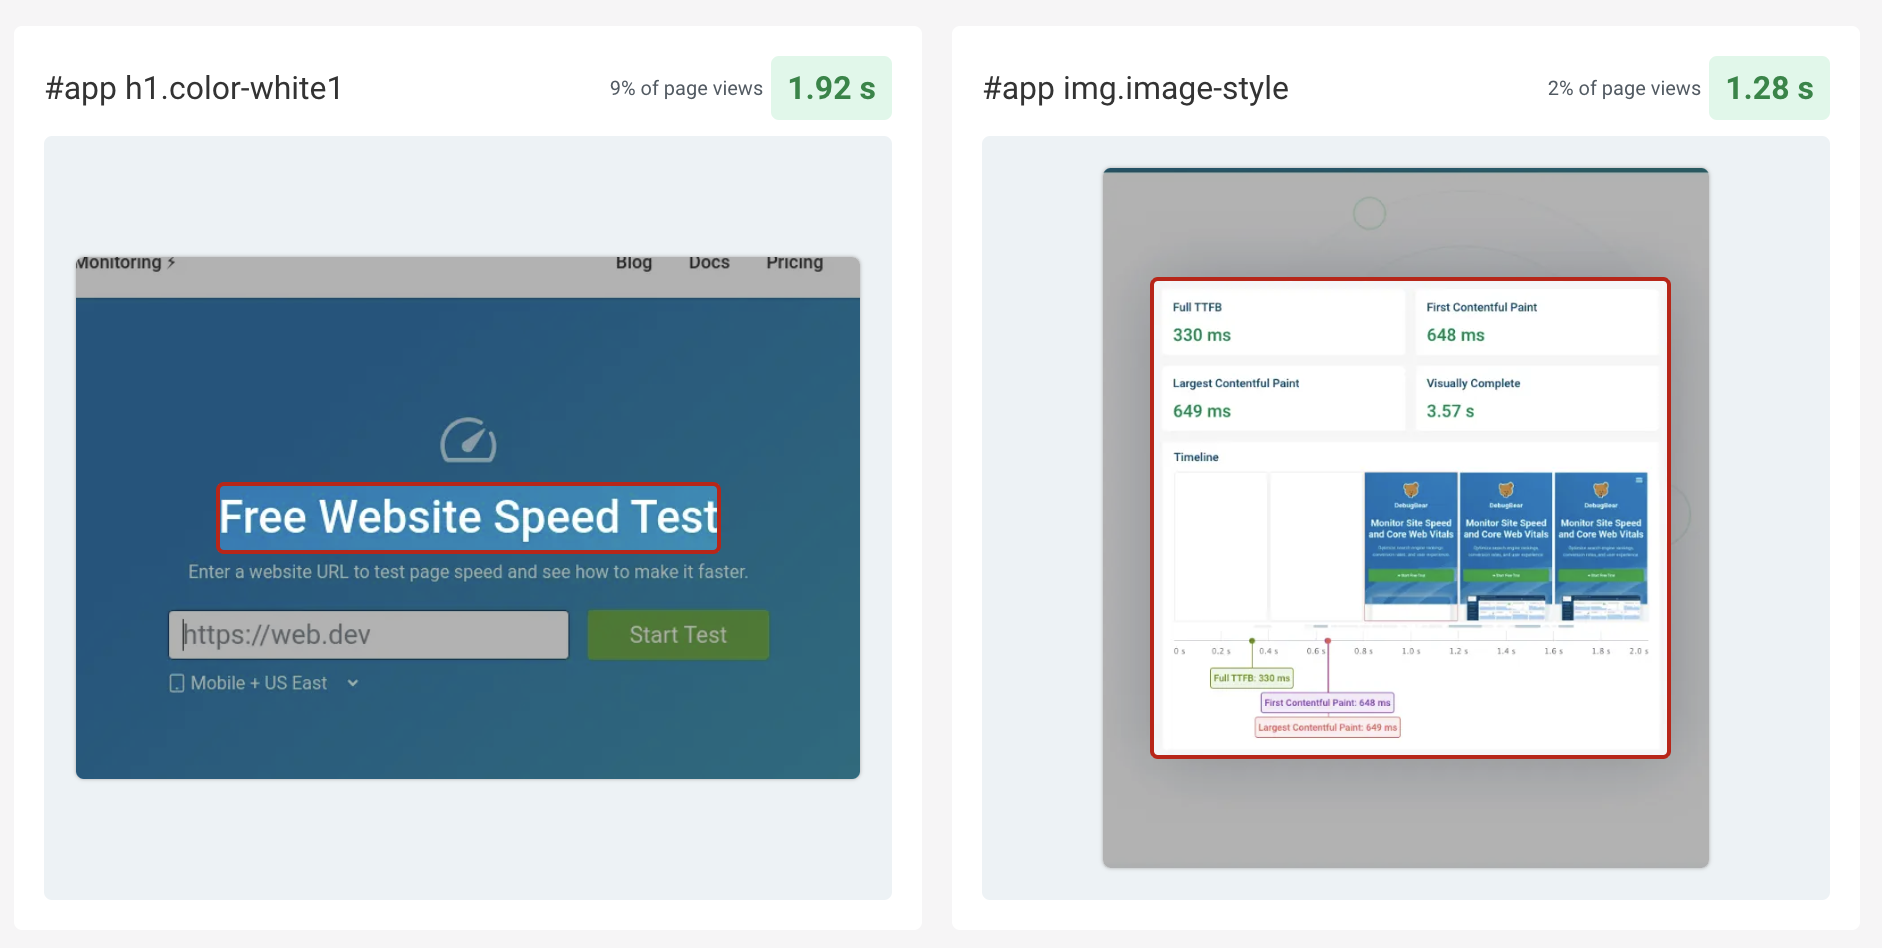
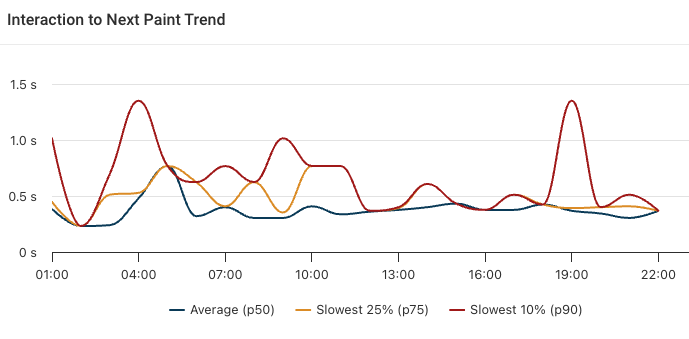
A similar breakdown is available for the Interaction to Next Paint metric.
Knowing what elements visitors interact with and that cause slow website responsiveness is a great starting point for optimizing your INP score.
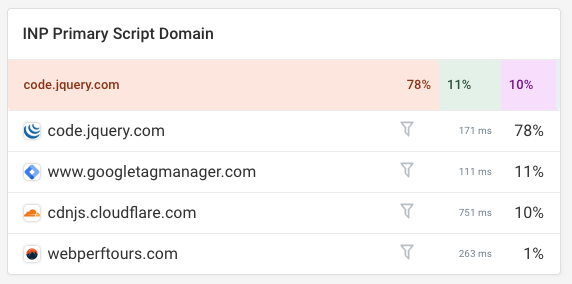
But RUM tools can also collect additional information like data from the Long Animation Frames API. This data can show specific scripts that are delaying user interactions.
Real-time data vs 28-day rolling period
Google reports CrUX data in two ways:
- A 28-day rolling average
- Monthly reports of domain-wide data on BigQuery
The 28-day average means that if there's a change to your Core Web Vitals you’ll need to wait at least a week or so to start seeing the impact.
In contrast, real user monitoring tools can provide real-time data. As soon as you deploy a new version of your website you can see how it’s impacting real user metrics.
However, unless you get a huge amount of traffic, you’ll still need to wait an hour or so before you can see what a new typical experience looks like on your website.
Required setup to get started
All you need to do to view CrUX metrics is to enter your website URL into a website speed test.
RUM data collection is a bit more involved. You need to install an analytics script on your website which can then start collecting data for each visit.
Benchmarking competitors
If you want to provide an industry-leading experience and outrank your competitors, you need to know how fast a typical website is in your industry.
RUM data won’t help you here, as you can't install analytics tools on your competitor websites.
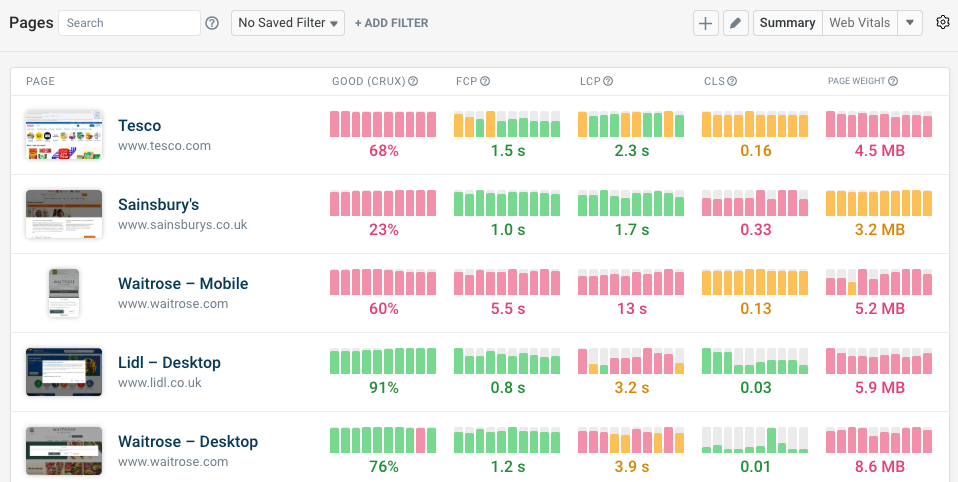
However, CrUX data is publicly available, which means you can easily rank websites in your sector from fast to slow.
In addition to CrUX data, you can also use synthetic monitoring to test your competitor websites daily. While this isn’t real user data, it will still give you early insights on changes your competitors are making.
What pages is data available for?
To be included in Google’s CrUX dataset, a website needs to reach a certain level of traffic. To get data for a specific URL, that URL also needs to meet a traffic threshold.
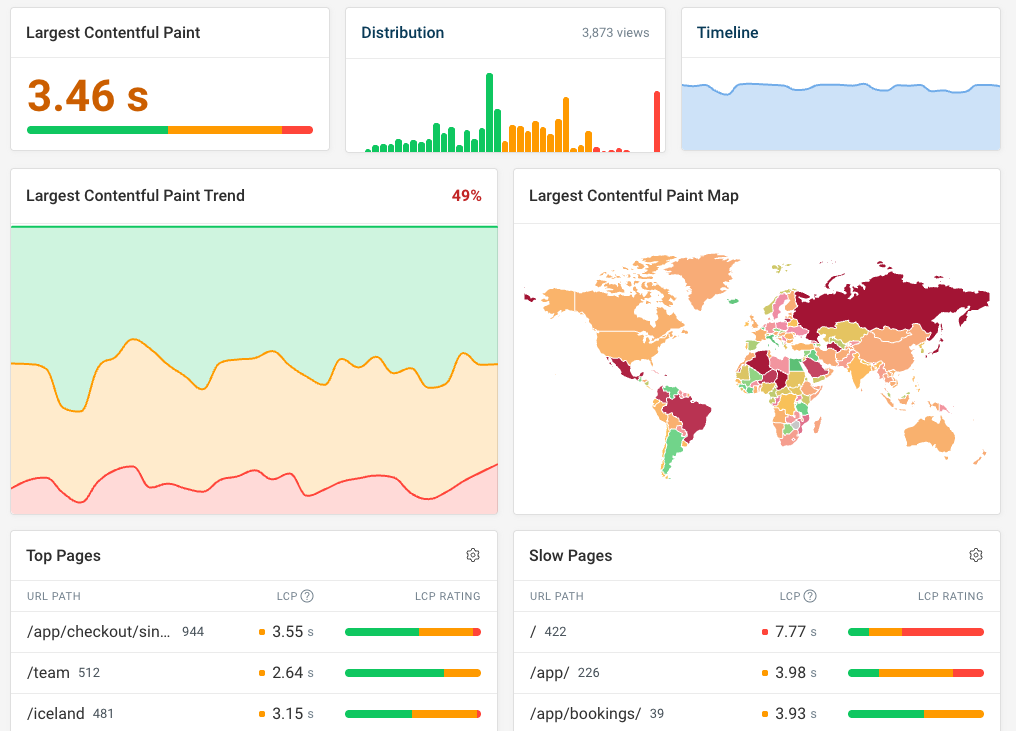
This means that page-level CrUX data won’t be available for many pages on your website.
In contrast, you can view RUM data for a page even if it only received one or two visits.
Available metrics in CrUX and RUM data
Google CrUX data currently only includes a few key metrics:
- Time to First Byte (TTFB)
- First Contentful Paint (FCP)
- Largest Contentful Paint (LCP)
- Cumulative Layout Shift (CLS)
- Interaction to Next Paint (INP)
In addition to those metrics, CrUX also provides additional information on network round trip time and navigation types. This additional data can help you understand what steps you need to take to optimize your website.

The exact metrics that are included in real user monitoring data depend on the RUM provider, but generally more metrics will be reported to give you the maximum insight into your website performance.
For example, you might see additional component breakdowns for the TTFB, LCP, and INP metrics. With this information, you can focus on optimizing the biggest component, where you can have the most impact.
Impact on SEO
Google uses the CrUX data as a search result ranking signal.
However, your RUM data will tell you what you can do to improve your performance and let you know about changes without a 28-day reporting delay.
Statistical reporting options
When looking at real user data, we rarely look at one individual visit. Instead thousands of page views are aggregated into a few numbers.
To do that, an average value needs to be calculated using a statistical method.
CrUX metrics are always reported at the 75th percentile. If Google says your load time is 2 seconds, that means 75% of visitors waited less than that and 25% waited longer.
Google also buckets experiences into Good, Needs Improvement, and Poor ratings. That way, even if your 75th percentile metric is good, you can still see whether some visitors aren’t having a good experience.
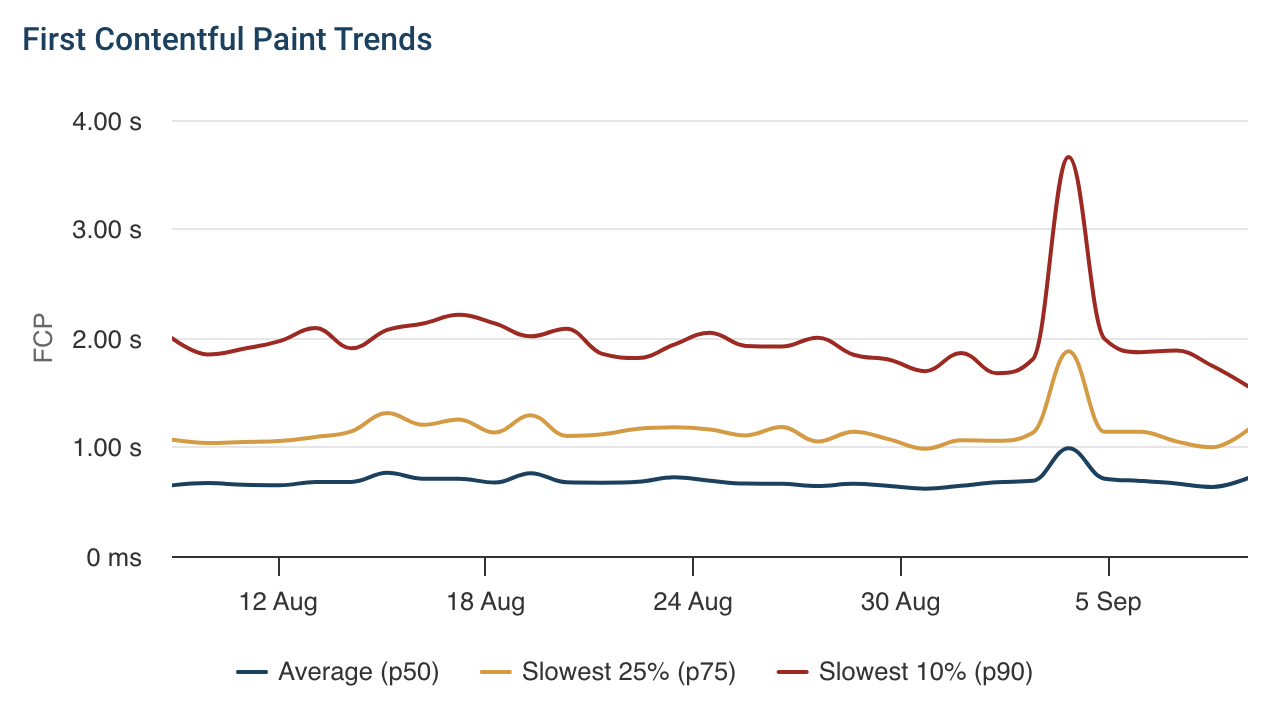
Real user monitoring tools provide similar data to what Google provides, but you can see not just 75th percentile but also values for other percentiles.
For example, 10% of your visitors have experiences at the 90th percentile. You can look specifically at these experiences and decide what to optimize.
Why don’t the metrics reported in CrUX and RUM data match?
While lab tests often show big differences to real user data, different types of real user data should be relatively close together.
However, sometimes you might still see differences between CrUX data and real user monitoring results. In that case, start by making the set of page views included in the data as similar as possible. For example, that might mean only looking at visits from the Chrome browser. However, you’ll never be able to track exactly the same set of visits.
CrUX and RUM data can also have differences due to the way the data is collected. RUM tools rely on browser performance APIs to measure page speed. That means they are restricted for security and privacy reasons. For example, if the primary content on your website is in an iframe then RUM services can’t measure when this content renders.
In contrast, CrUX data is collected directly in Chrome and is therefore not subject to these limitations.
Do I need real user monitoring, or is CrUX data enough?
If you just want to check if your website is ok, then CrUX data will be sufficient.
But if you’re struggling with performance issues on your website and failing Google’s Core Web Vitals assessment then you’ll need additional data to find out how to improve and check that your changes are working as expected.
Monitor CrUX and RUM metrics
DebugBear is a tool that provides both types of website monitoring, as well as running continuous lab-based tests that provide additional details and recommendations.
Start a 14-day free trial if you want to improve your Core Web Vitals.


Monitor Page Speed & Core Web Vitals
DebugBear monitoring includes:
- In-depth Page Speed Reports
- Automated Recommendations
- Real User Analytics Data