”We deal with customers in Regional Western Australia where network speed is slow. RUM allows us to measure real experiences from our customers own eyes rather than guessing what the true value may be.“
Michael McGrady
Digital Marketing & Performance Specialist at Horizon Power
”DebugBear has transformed how we approach performance. Instead of guessing based on Google's aggregated data, we're making decisions based on what our actual users are experiencing in the moment.“
Ryan Sullivan
Chief of Staff at SiteCare
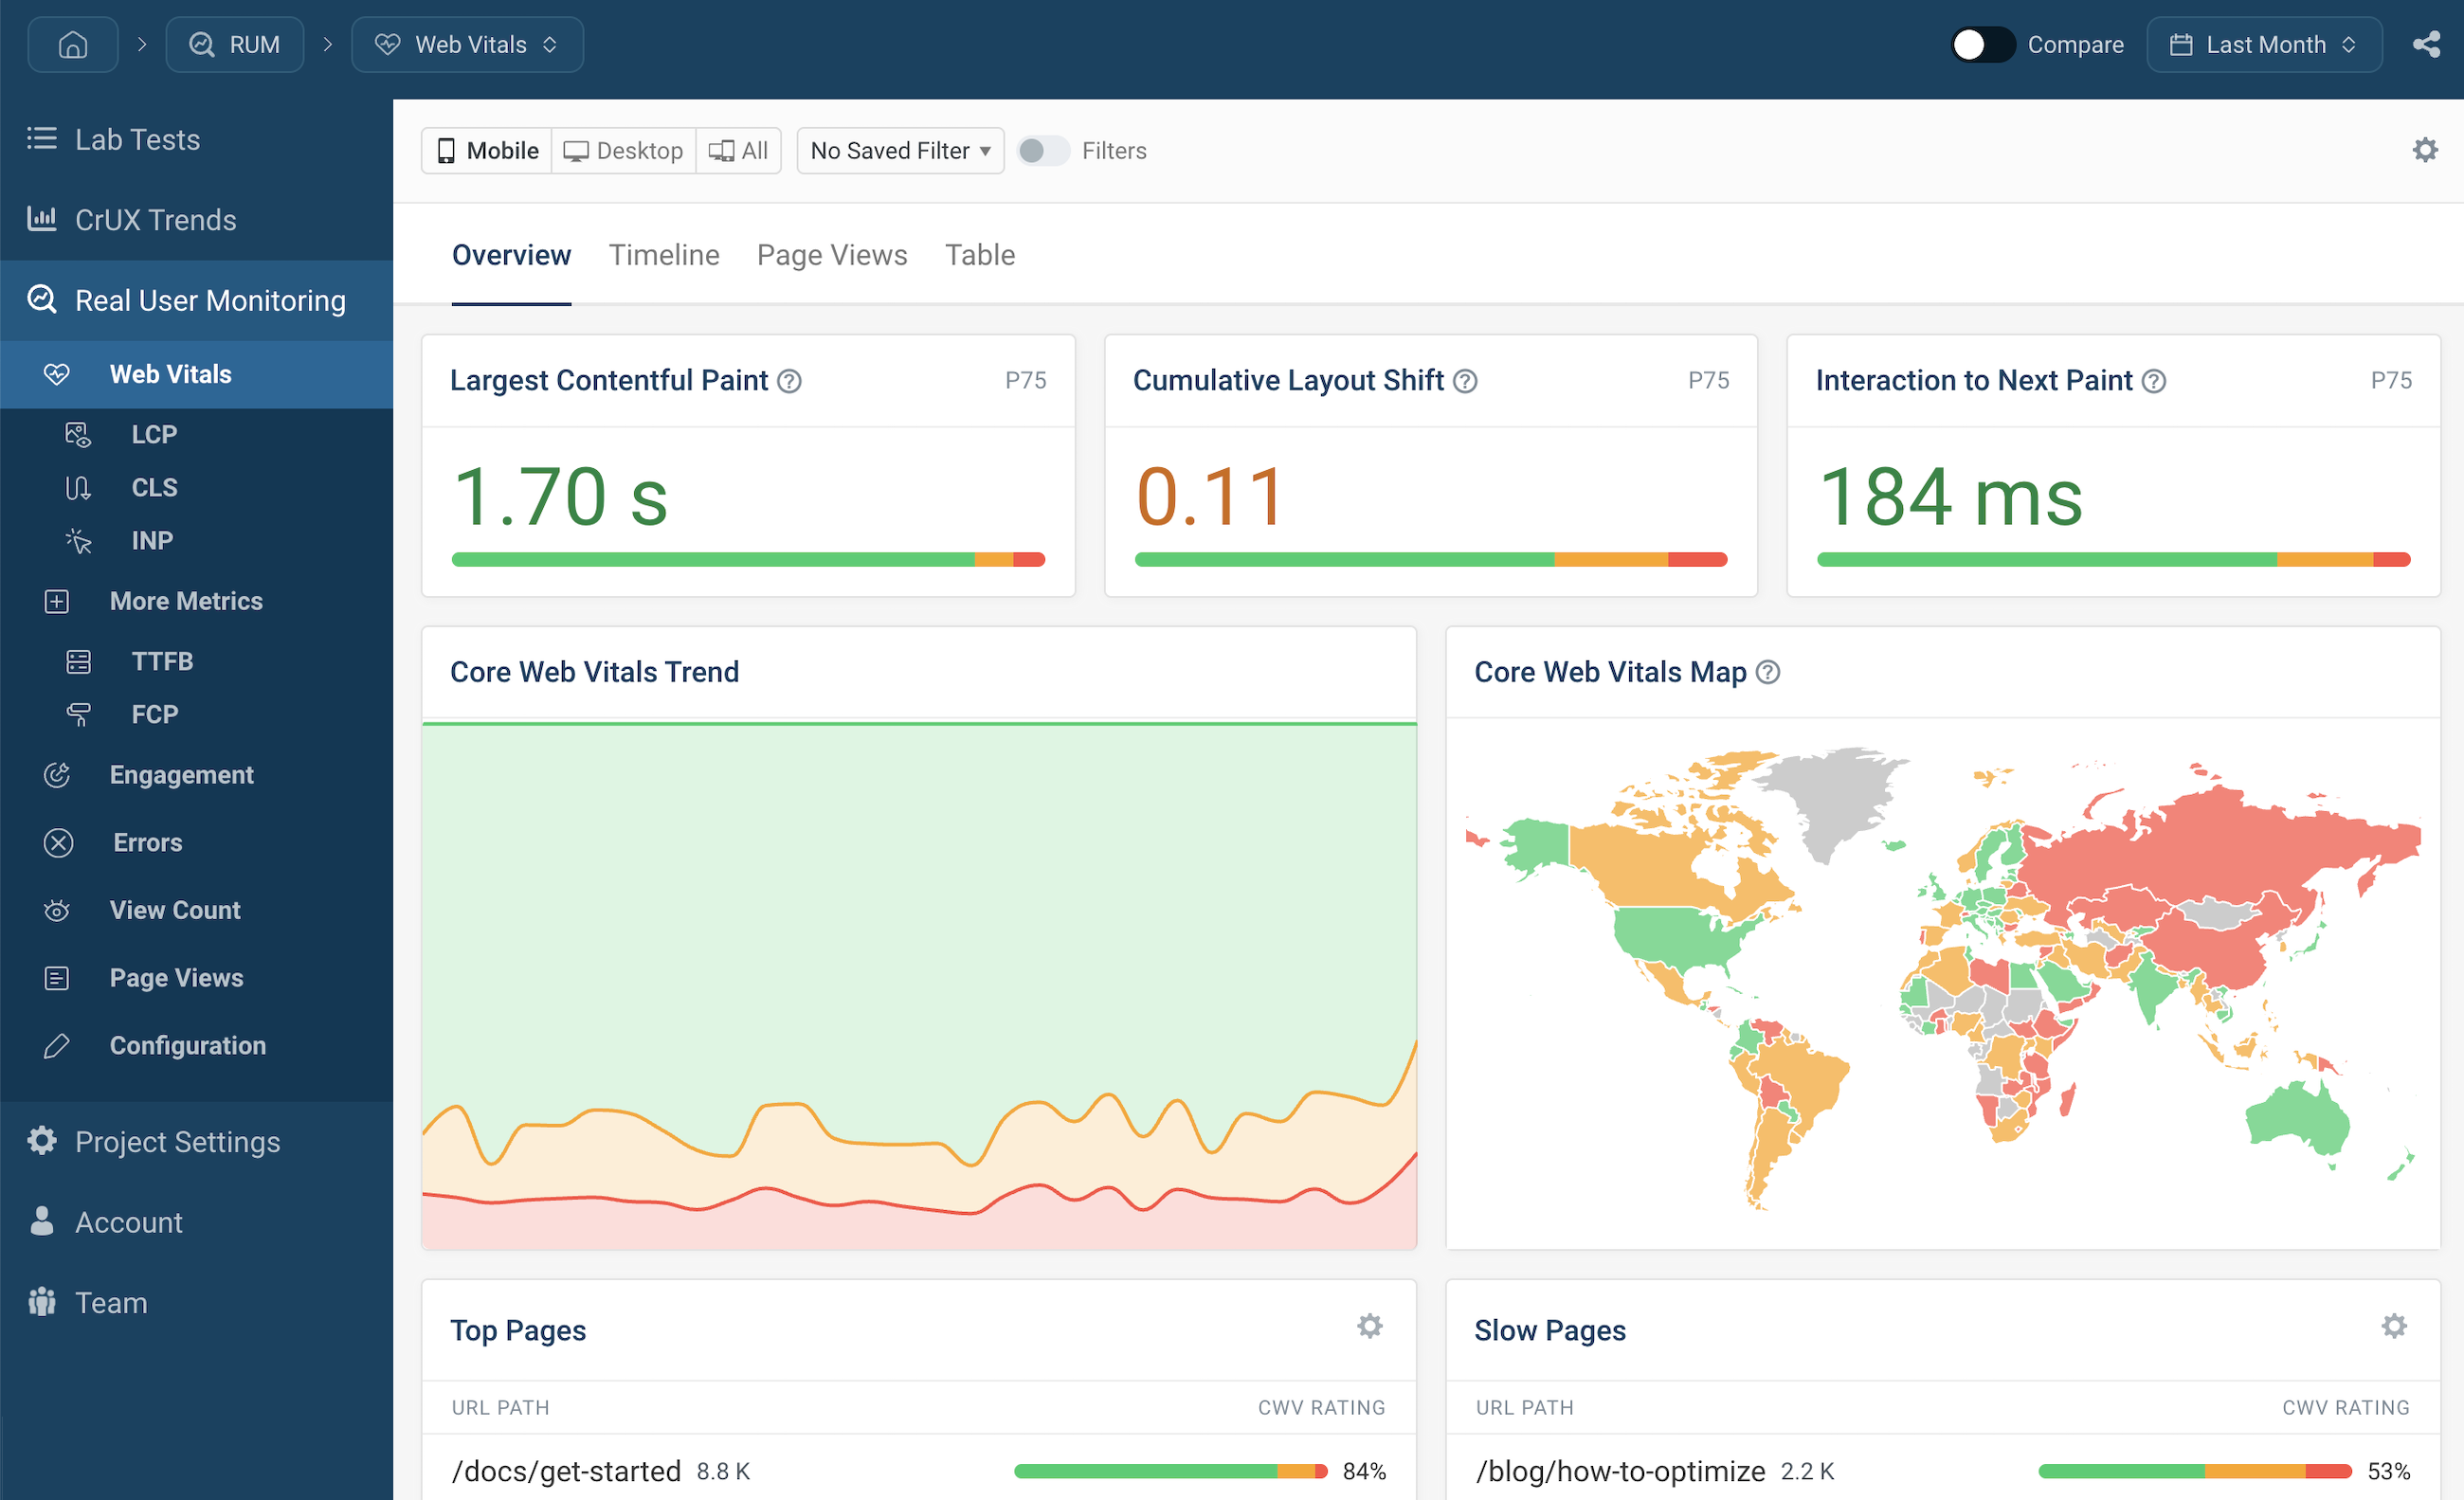
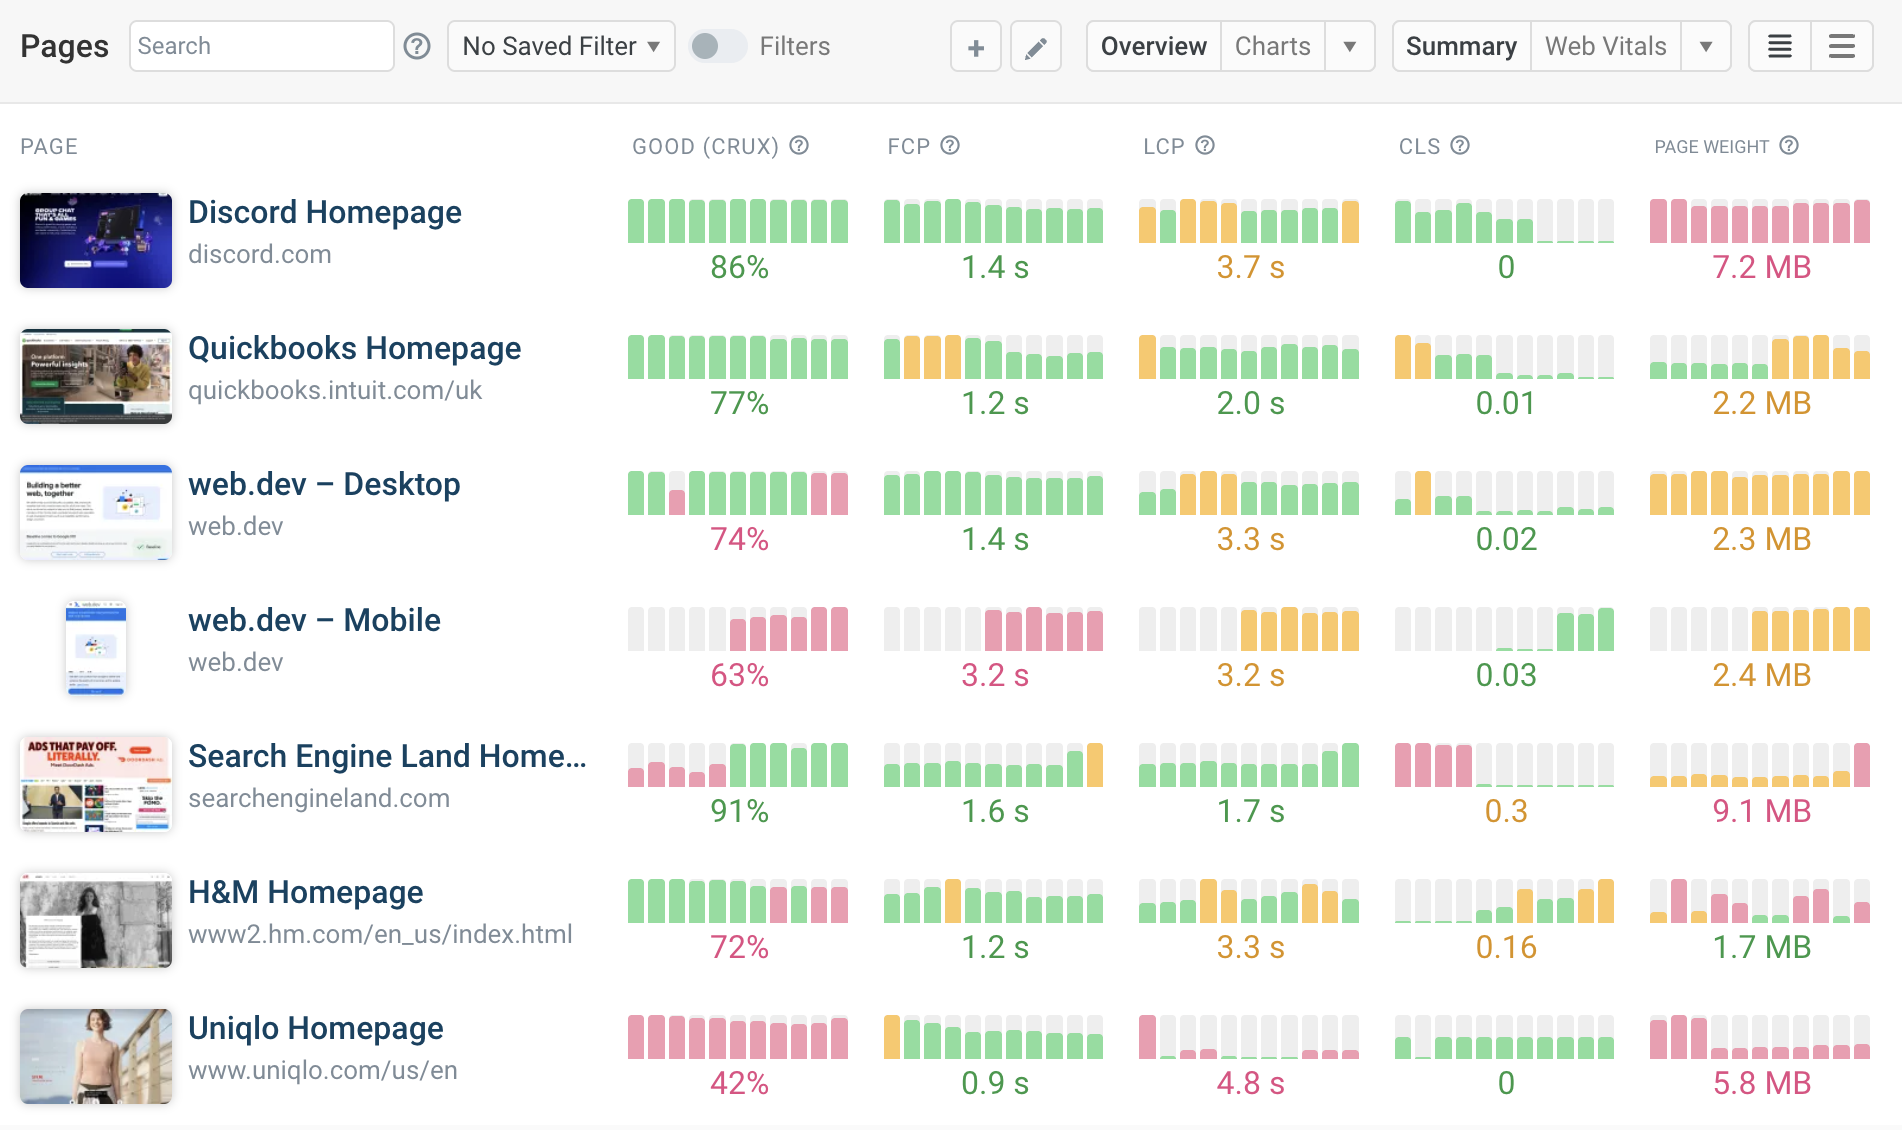
Monitor user experience with real visitor data
How do real visitors experience my website?
Track Core Web Vitals and other performance metrics to understand
user experience on your website. See trends over time and identify
when experience degrades.
Which pages need optimization?
Identify slow pages that are causing frustration for your visitors
and understand what page elements are responsible.
Are visitors converting?
Correlate web performance with bounce rate and conversion rate.
Understand how performance impacts your bottom line.
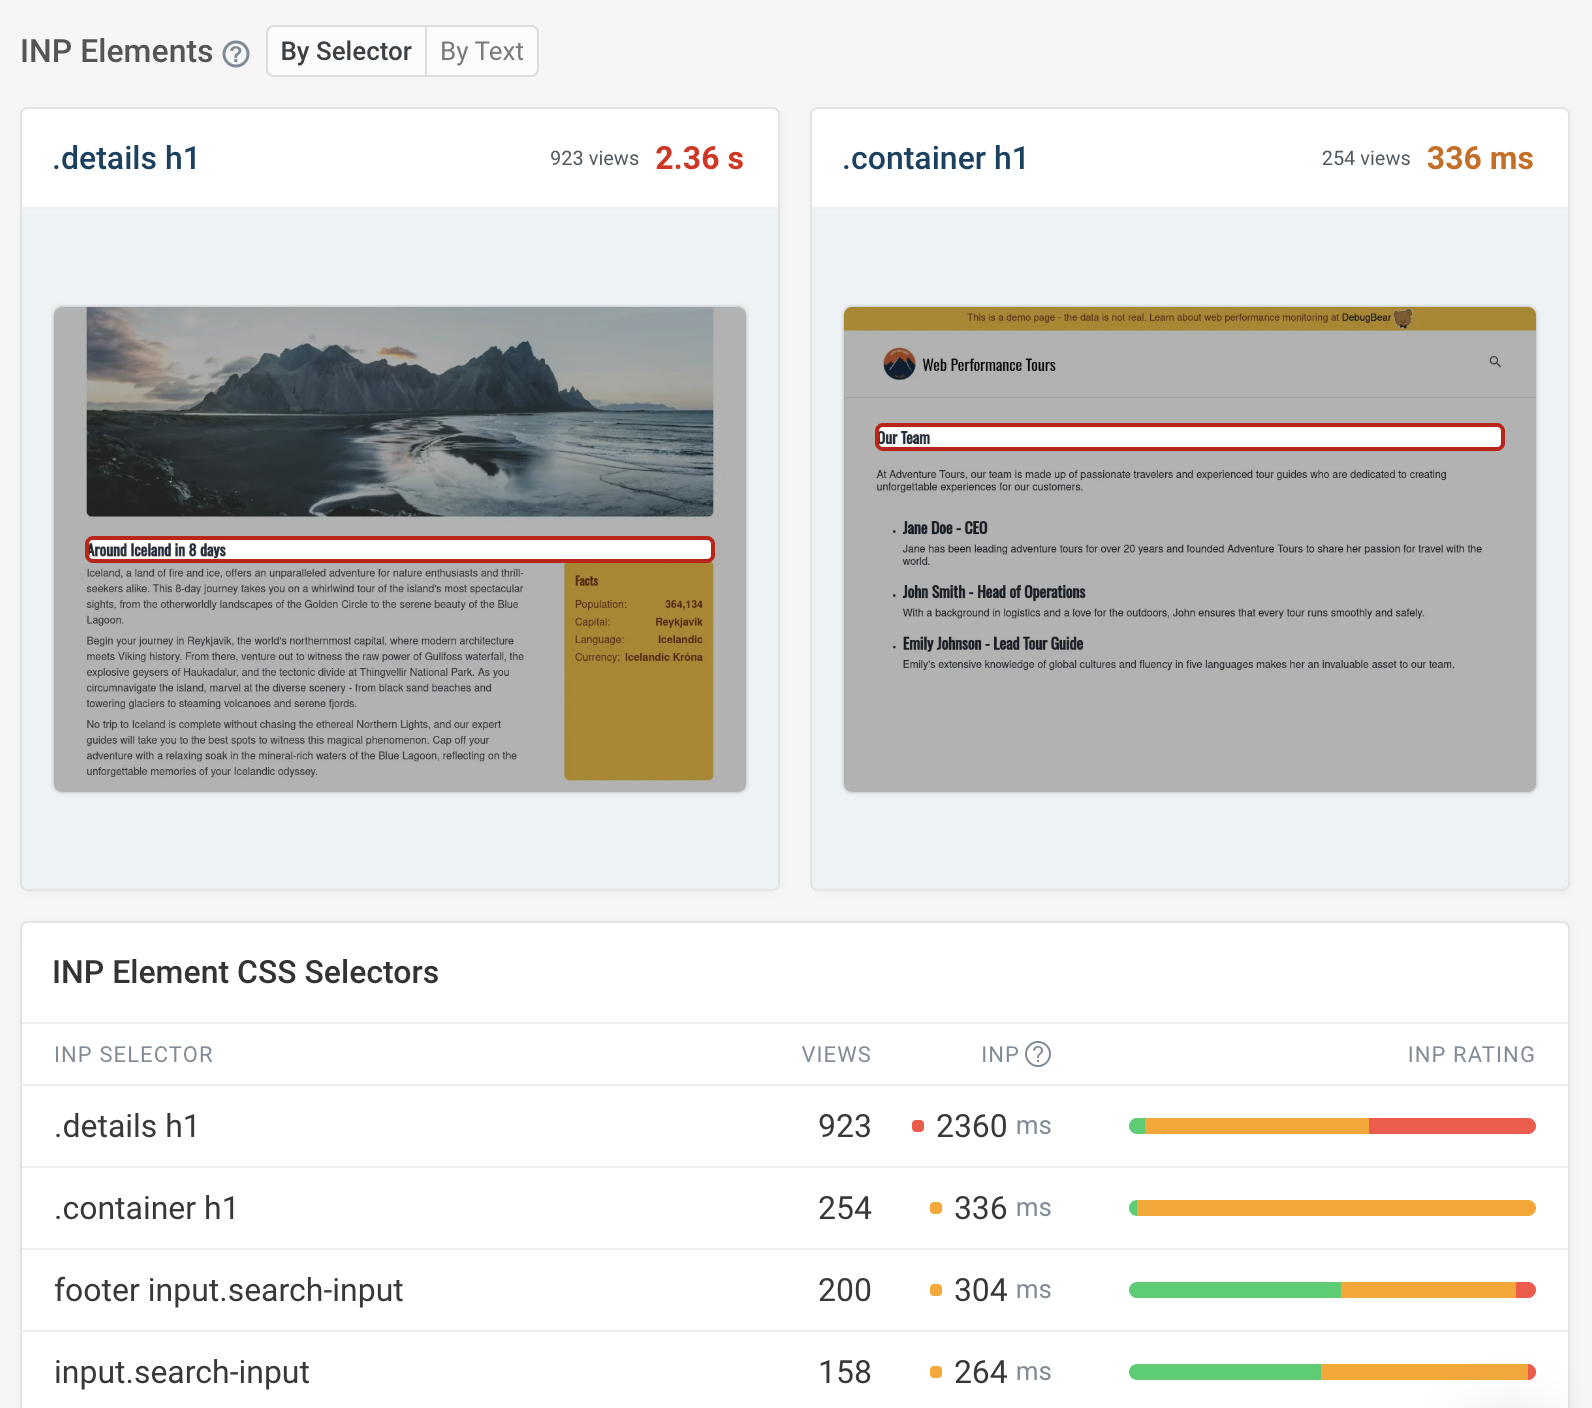
Optimize interaction responsiveness
Track Interaction to Next Paint (INP)
INP measures how quickly your website responds to user interactions.
DebugBear helps you identify what's causing slow interactions.
Find the most impactful elements to fix
DebugBear ranks interactive elements by how often they cause poor INP,
so you can prioritize the fixes that help the most visitors.
Pinpoint the scripts responsible
See what JavaScript files are running during slow interactions
and whether delays come from first-party or third-party code.
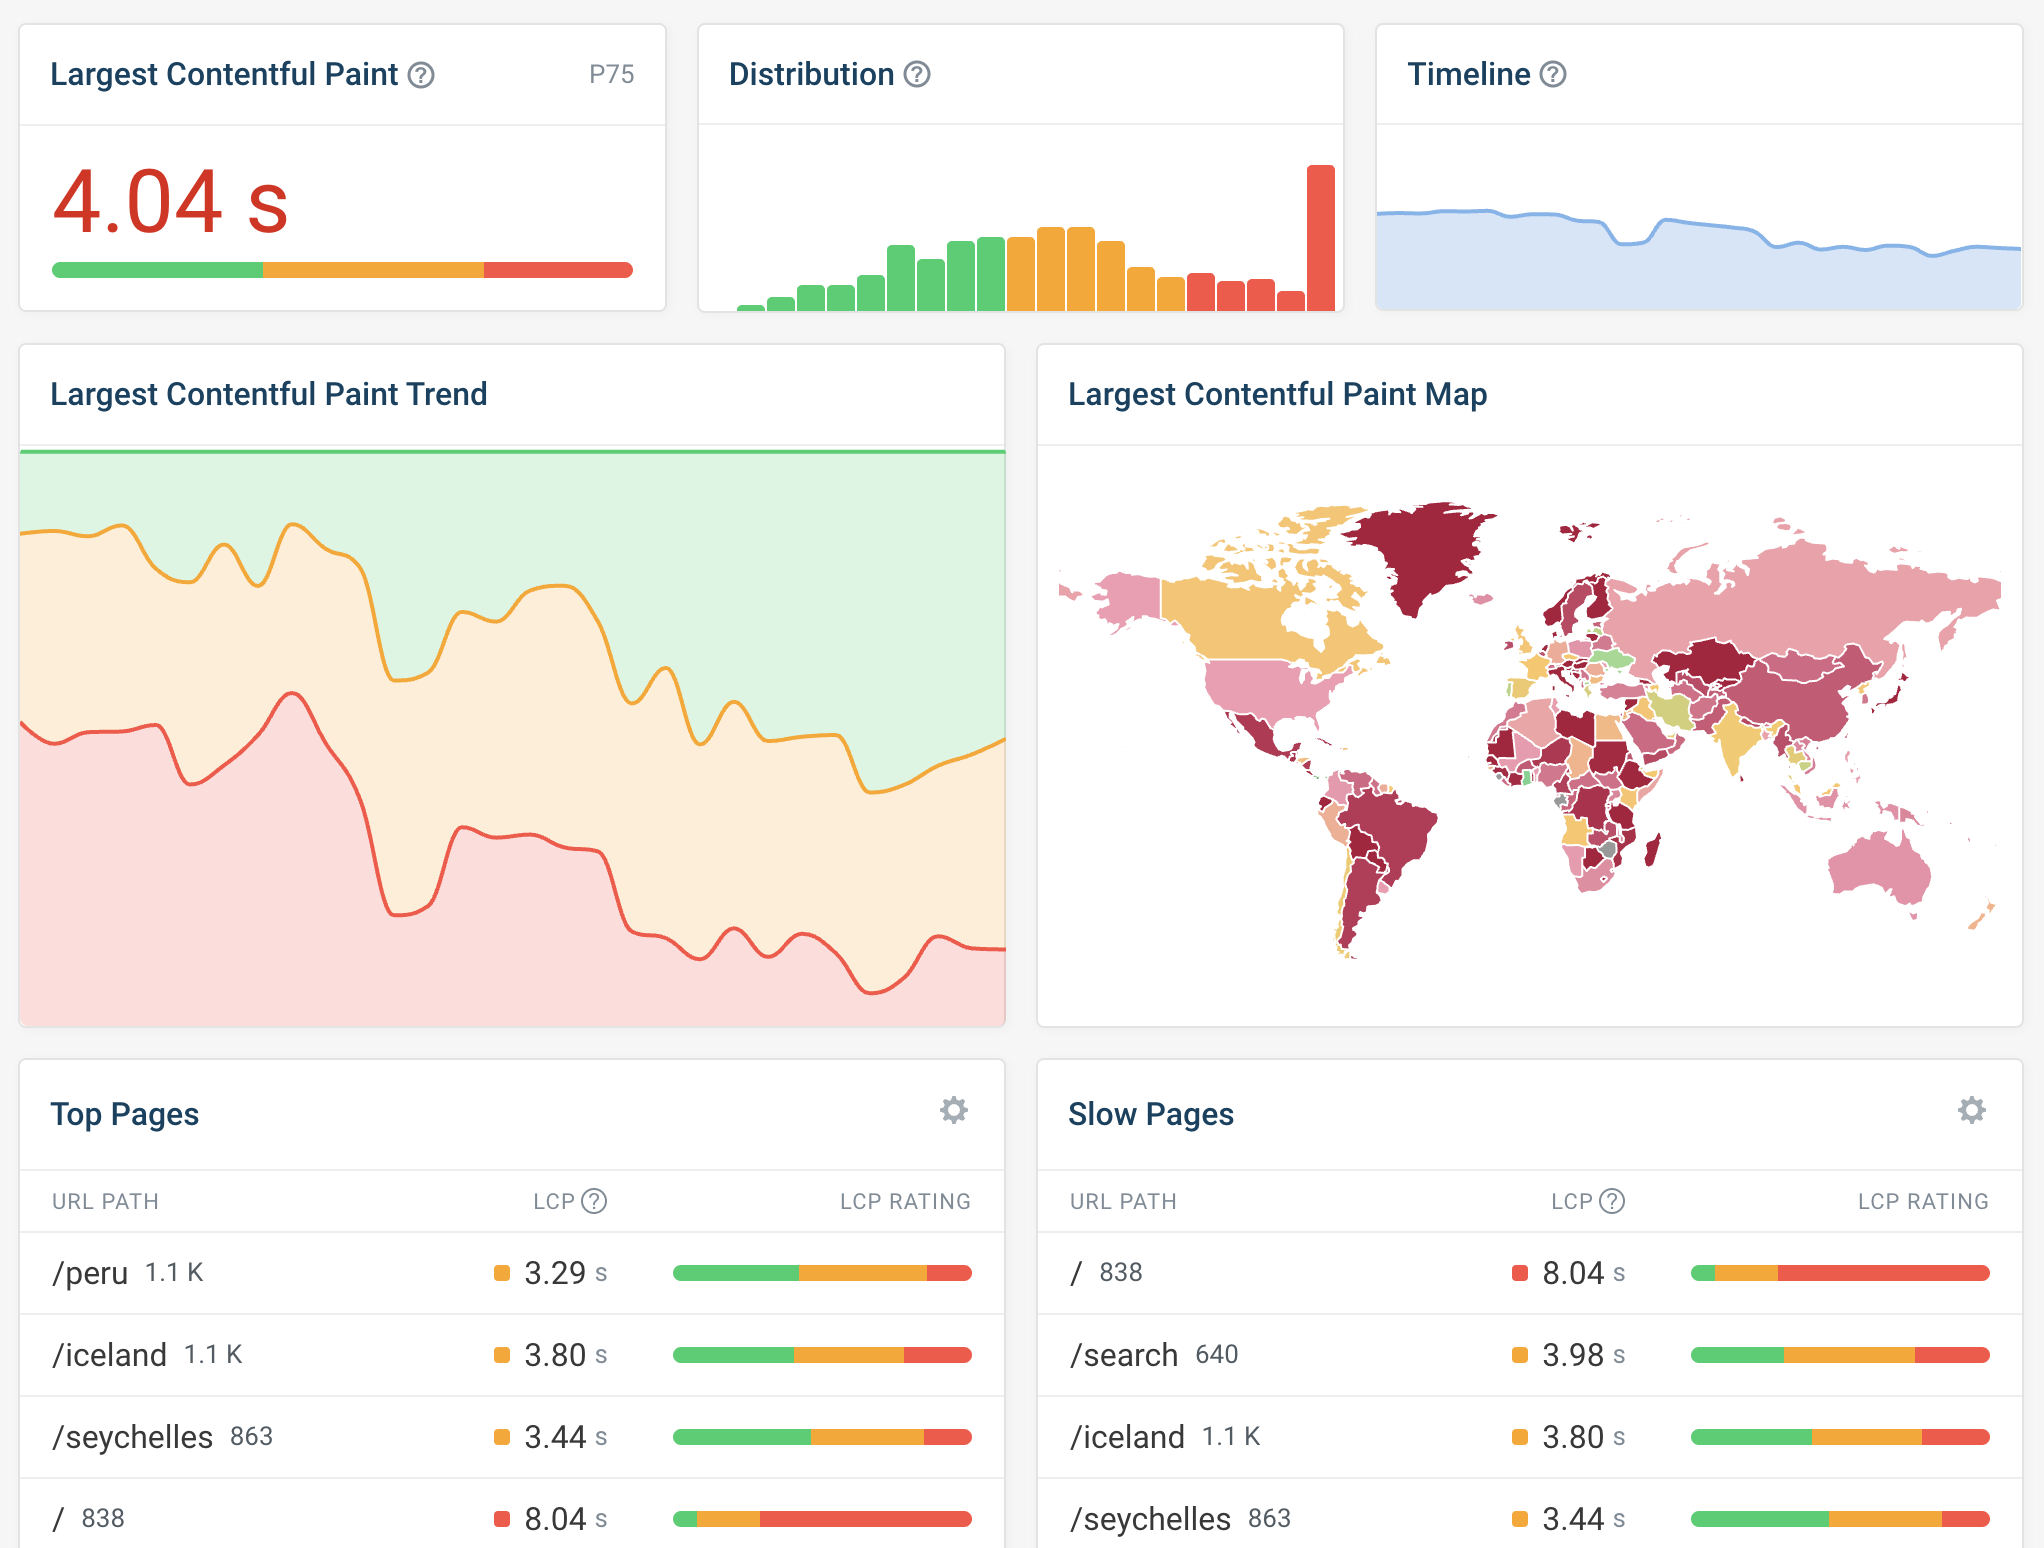
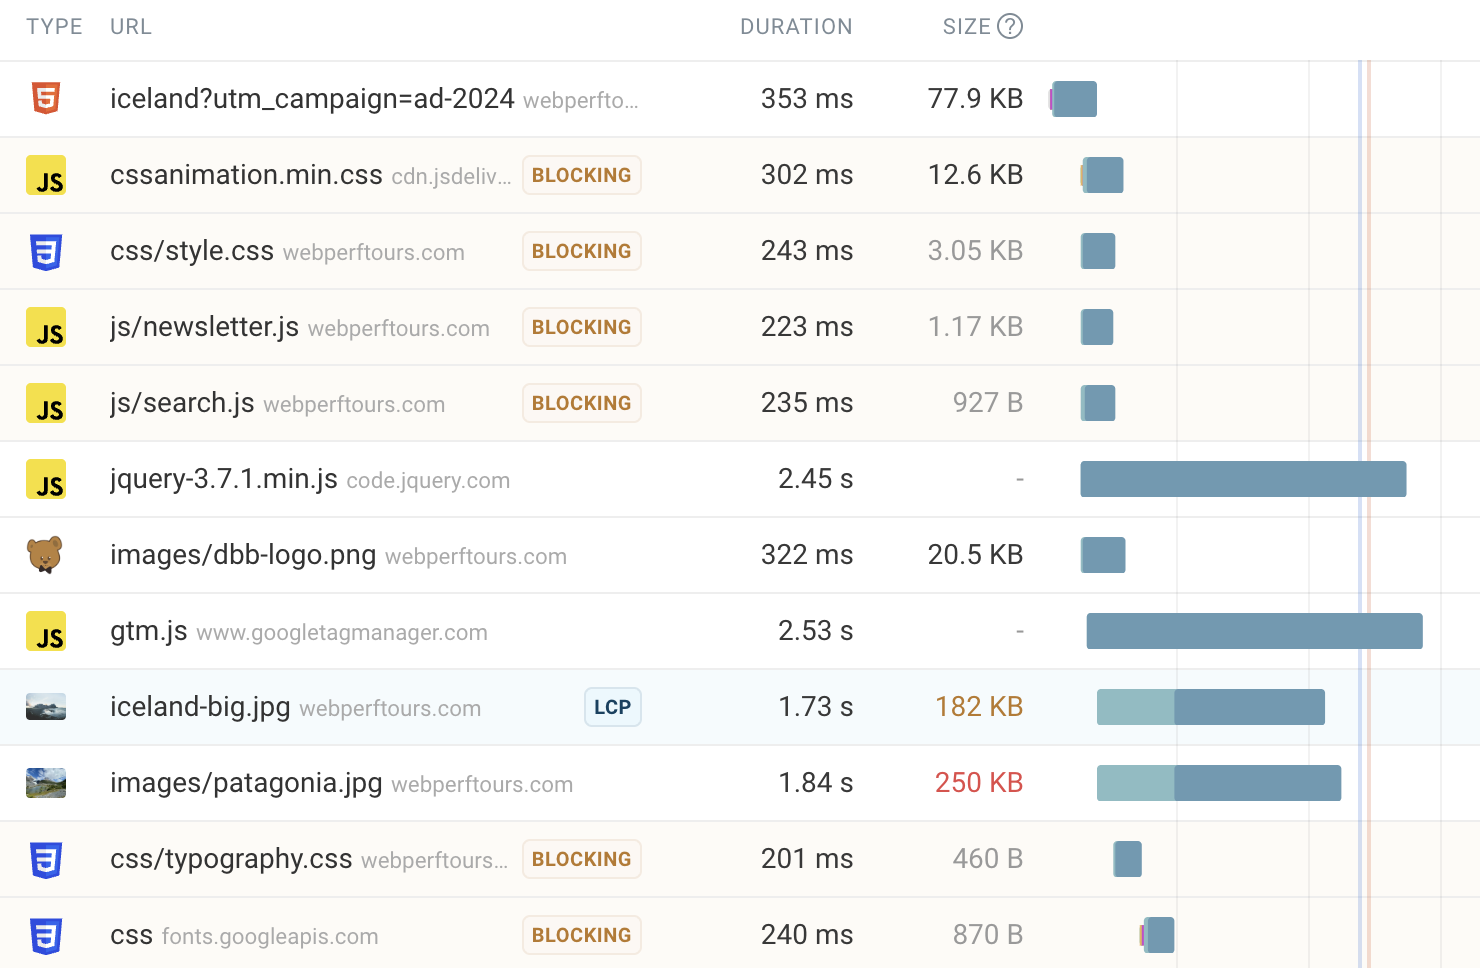
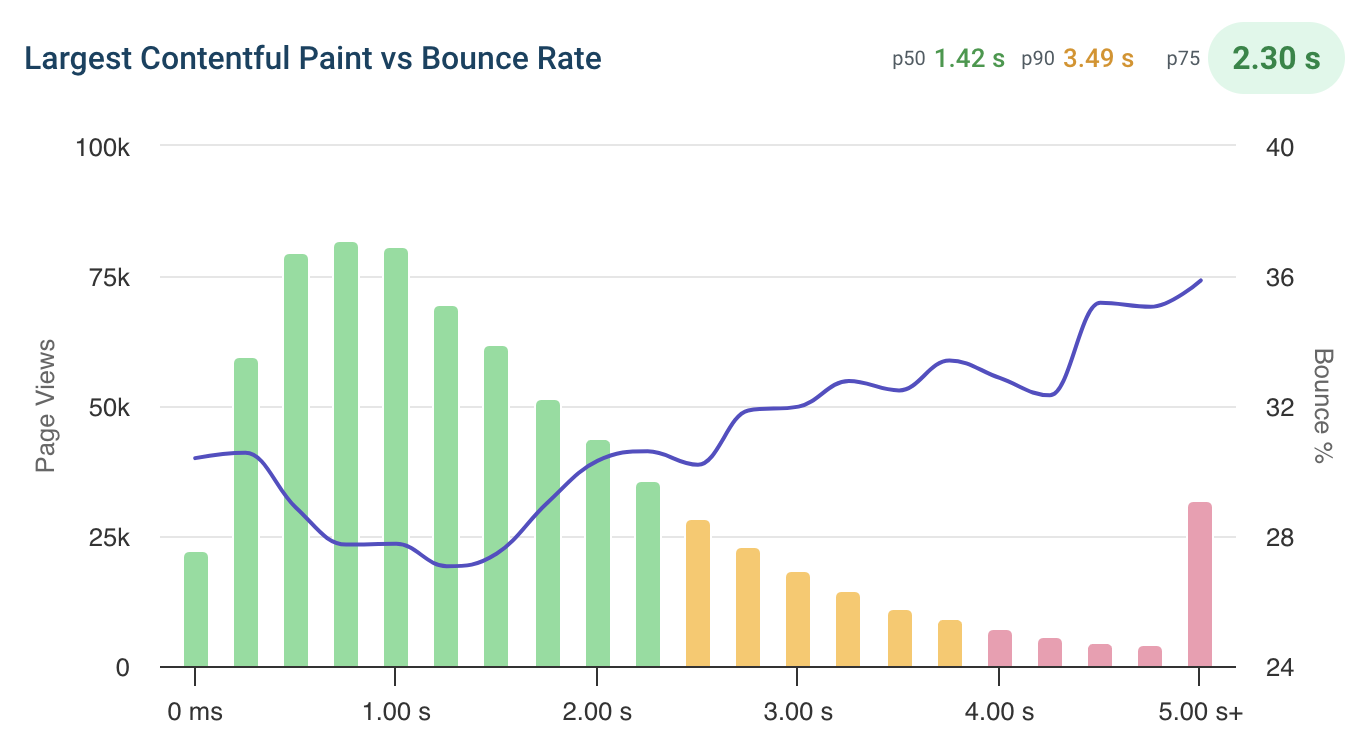
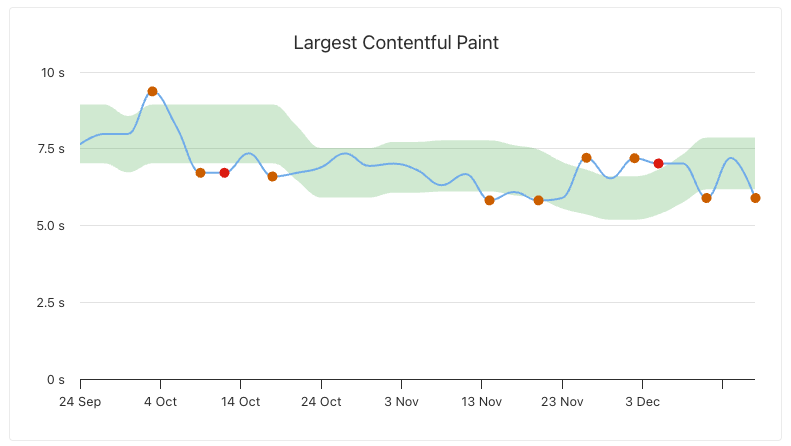
Improve page loading speed
Track Largest Contentful Paint (LCP)
LCP measures how quickly the main content of your page appears.
Monitor this critical metric across all your pages.
Debug with request waterfalls
See what network requests are needed to render your content
and identify resources that delay it.
LCP subpart analysis
Break down LCP into server response time, resource loading, and rendering
to focus on the bottleneck that matters most.
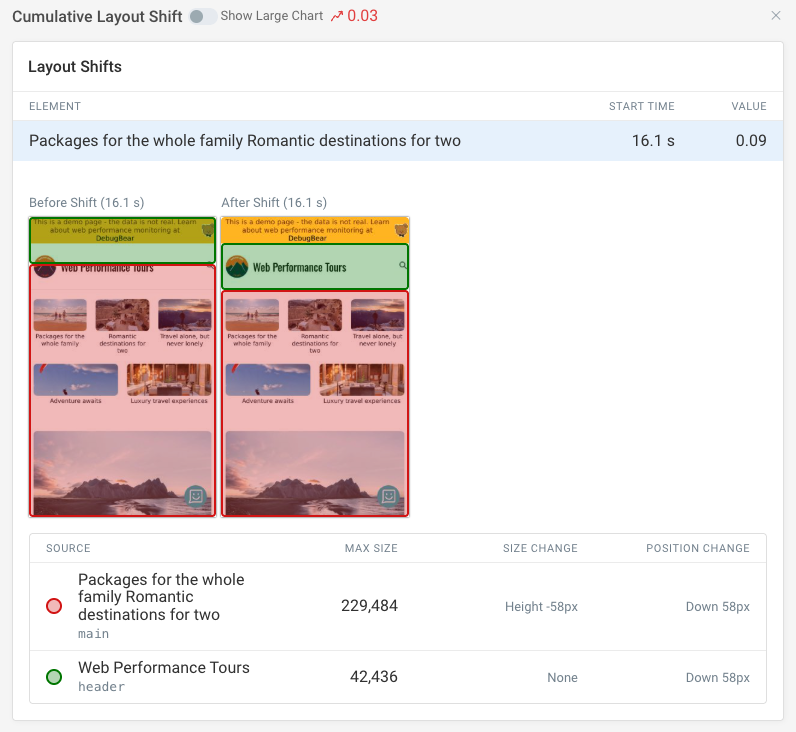
Ensure visual stability
Track Cumulative Layout Shift (CLS)
Layout shift happens when content moves around after it has rendered.
This can cause users to click on the wrong thing or lose their place on the page.
Identify what causes layout shift
See what elements are moving and understand why.
Fix issues caused by images without dimensions, dynamic content, or web fonts.
Correlate UX with business outcomes
Quantify the impact of speed on your business
See how page load time correlates with bounce rate and engagement
to build the business case for performance work.
Custom tags and metrics
Tag page views by user type, A/B test variant, or any other dimension.
Track custom metrics alongside Core Web Vitals.
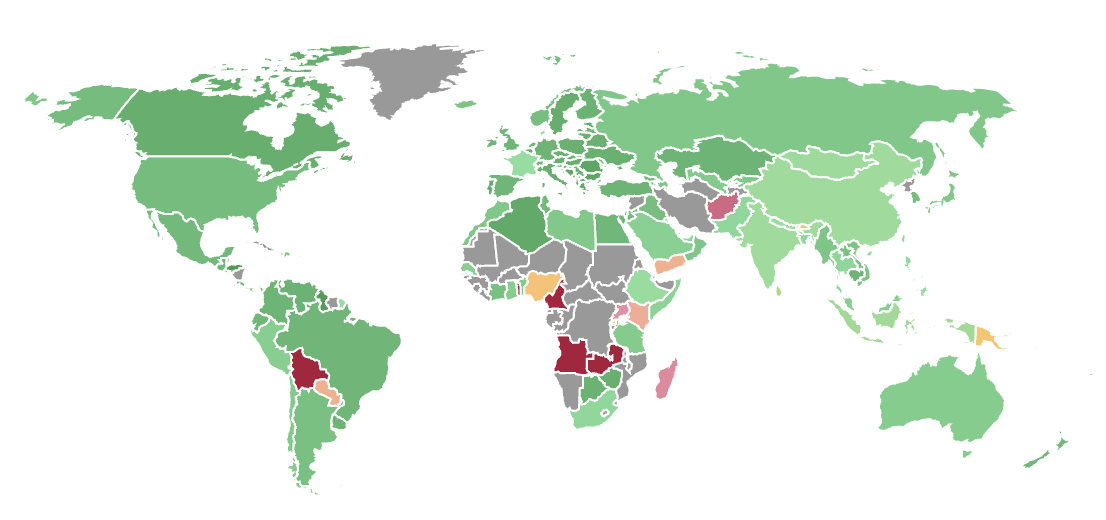
Understand global user experience
Find your slowest regions
Server distance and local network conditions affect page speed.
See which countries have the worst experience and why.
Segment by device and connection
Compare mobile vs desktop and fast vs slow connections
to understand where the biggest gaps are.
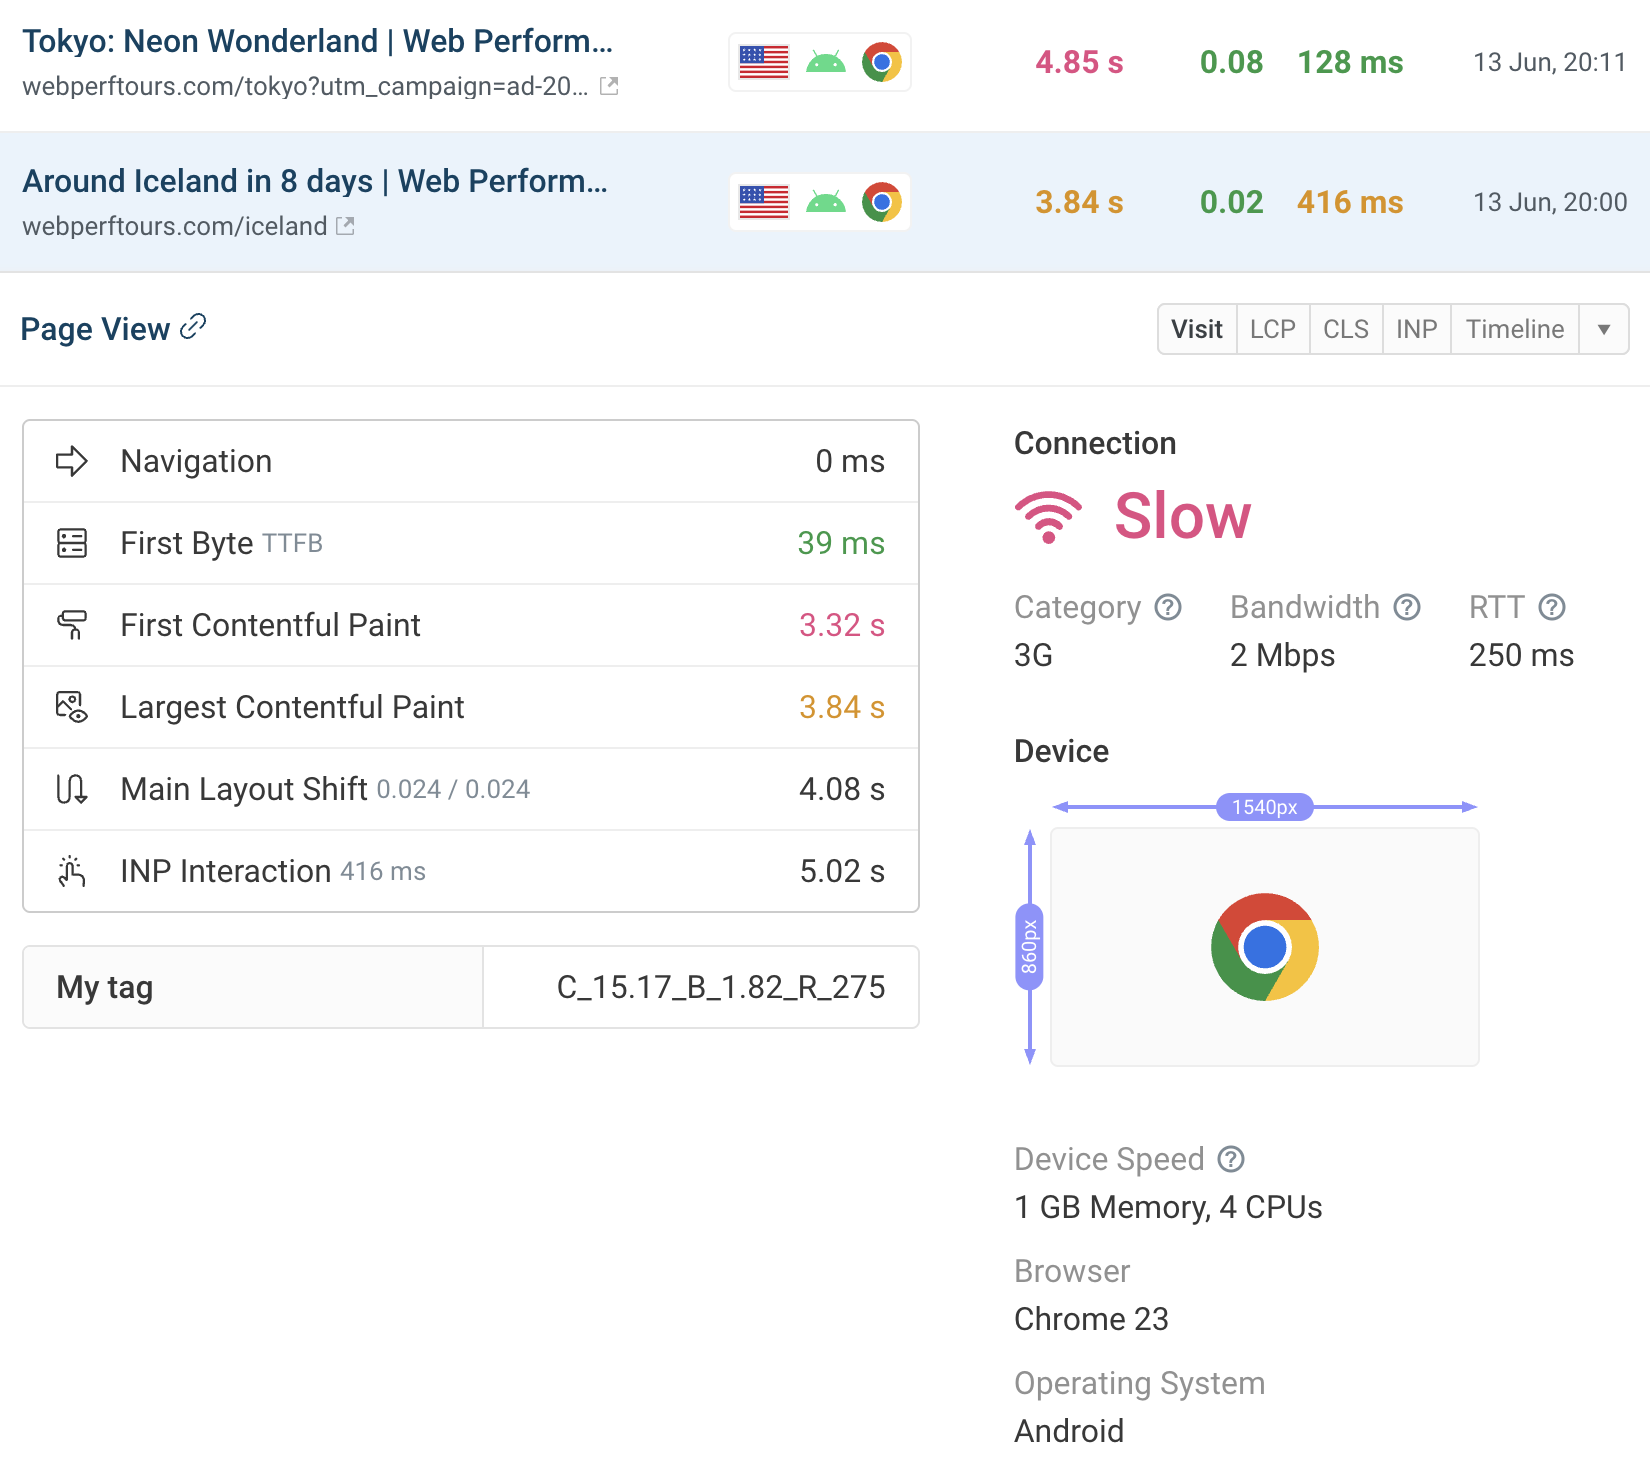
Investigate individual user sessions
Understand what happened during a slow visit
Each page view includes a request waterfall, script breakdown,
and interaction timeline so you can see the full picture.
Reproduce issues locally
Use device type, screen size, and estimated network speed
from real sessions to replicate issues in your dev environment.
Spot patterns across sessions
Filter and sort page views to find common patterns
behind slow experiences, like specific URLs or device types.
Get alerted to UX regressions
Custom alert thresholds
Define thresholds for Core Web Vitals and other metrics.
Get notified when user experience degrades.
Multiple notification channels
Receive alerts via email, Slack, or Microsoft Teams.
Integrate with your existing workflow.
Combine real user data with lab tests
Synthetic monitoring
Run scheduled lab tests to detect regressions before they impact users.
Get detailed reports and optimization recommendations.
Google CrUX data
Track the data Google uses for search rankings.
Compare your performance against competitors.