
The Fetch Priority API is a web technology that lets developers indicate the importance of a particular resource on a webpage. This functionality can be used to optimize the loading speed of a website.
However, when used incorrectly, fetchpriority can also have undesired effects that slow down your website.
This article explains how overusing fetch priority among resources can cause problems and how to instead use fetch priority correctly.
What is the Fetch Priority API?
When loading a web page, the browser controls which resources are prioritized. Priority impacts which resources are loaded first and the user experience. It’s vital that the most important resources load first so the page loads as quickly as possible.
The Fetch Priority API allows developers to indicate the priority of a resource to the browser when loading a web page.
Browsers have automatic logic for determining a resource’s priority. For example, render-blocking stylesheets are automatically considered high priority, while images are low priority.
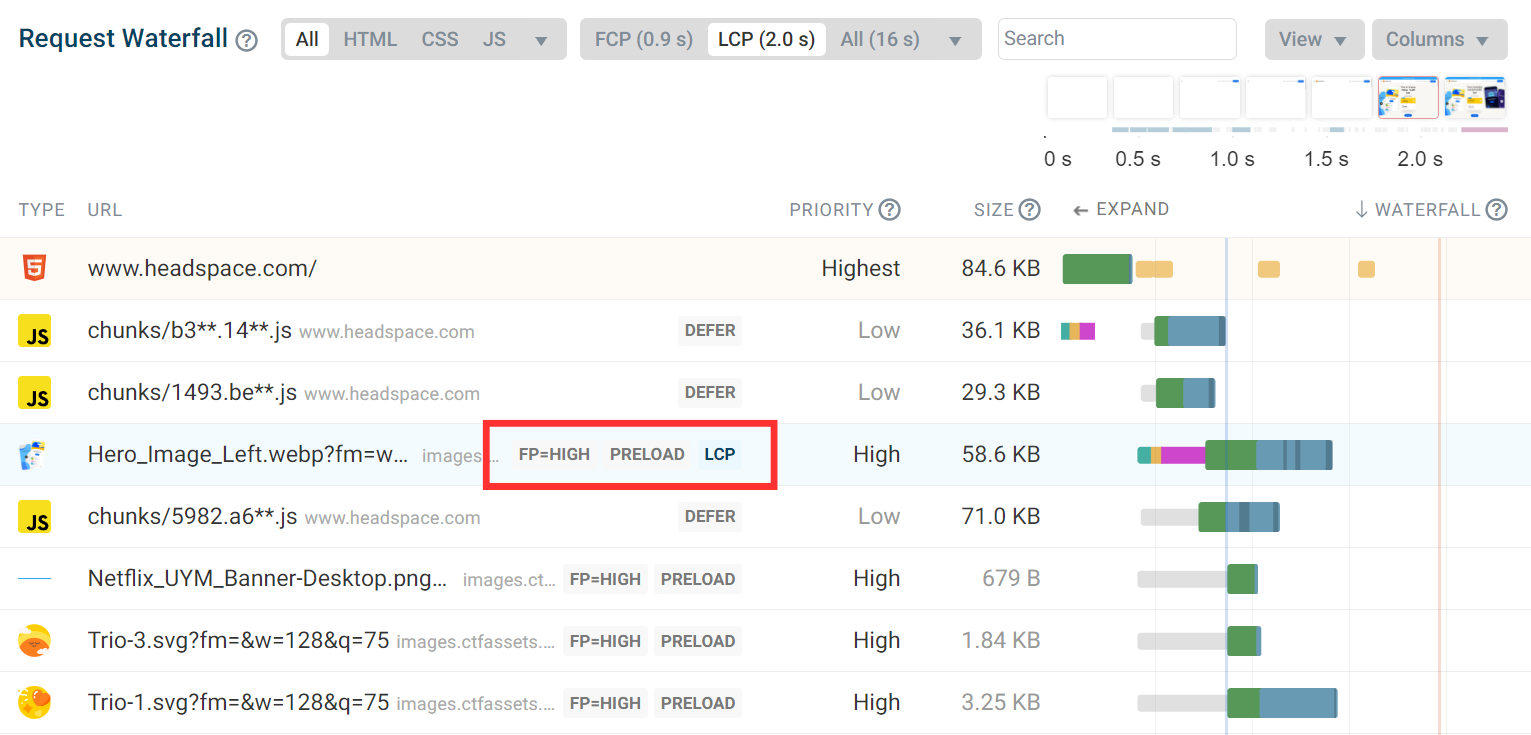
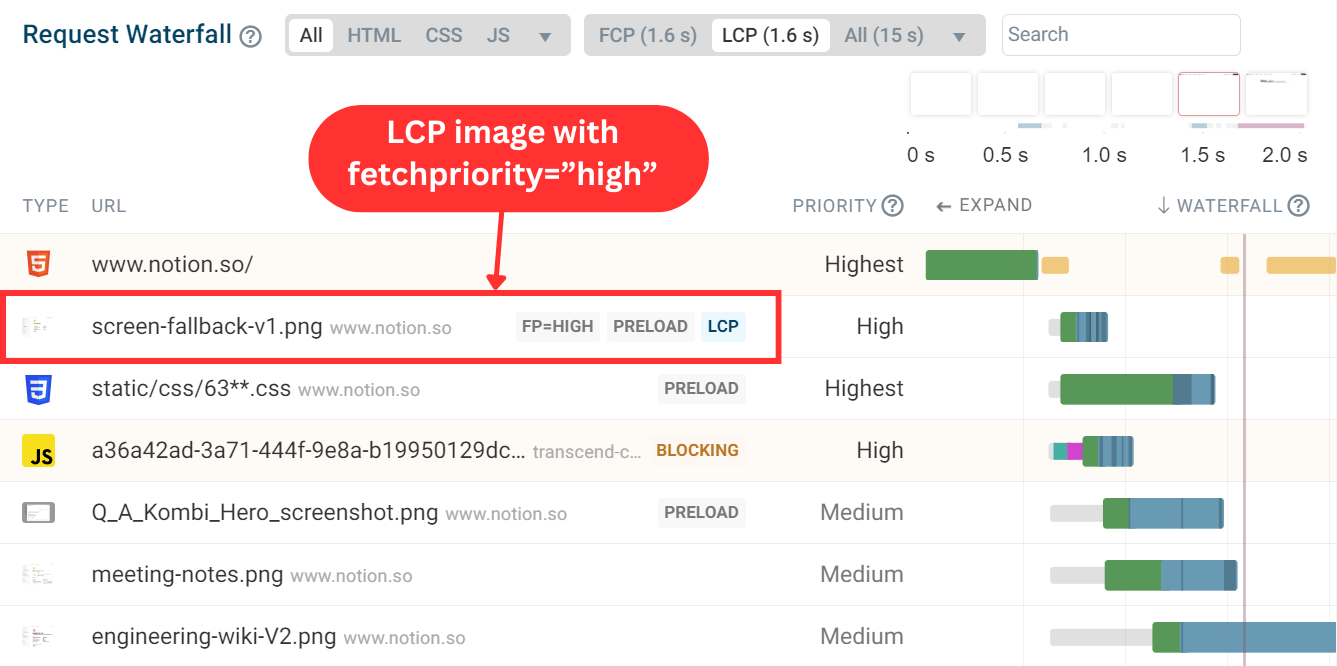
Looking at this request waterfall, we can see fetchpriority=”high” implemented on the LCP image request. By using fetchpriority="high", the browser instantly prioritizes the resource as high priority and the LCP image appears on the page quicker.
To learn more about how priority works in the browser and priority hints, read our full fetch priority hints article.
What happens when overusing fetchpriority="high"?
fetchpriority="high" should be used intentionally for it to be effective. This means using the attribute exclusively for important resources like images above the fold.
Excessive use of fetchpriority=”high” can lead to bandwidth competition among resources. This can delay the resources that really are the most important.
Why avoiding bandwidth competition is important
Overusing fetchpriority="high" will result in each resource taking longer to load. This happens because the network struggles to handle multiple high-priority requests simultaneously. Bandwidth is limited, so it is important to allocate resources correctly.
When fewer resources have high priority, the browser can manage bandwidth more efficiently, resulting in faster overall load times.
Example of overusing fetchpriority="high"
Let’s take a look at a real-world example where fetchpriority="high" is being overused. By analyzing the page layout and request waterfall we can determine how to better optimize the page.
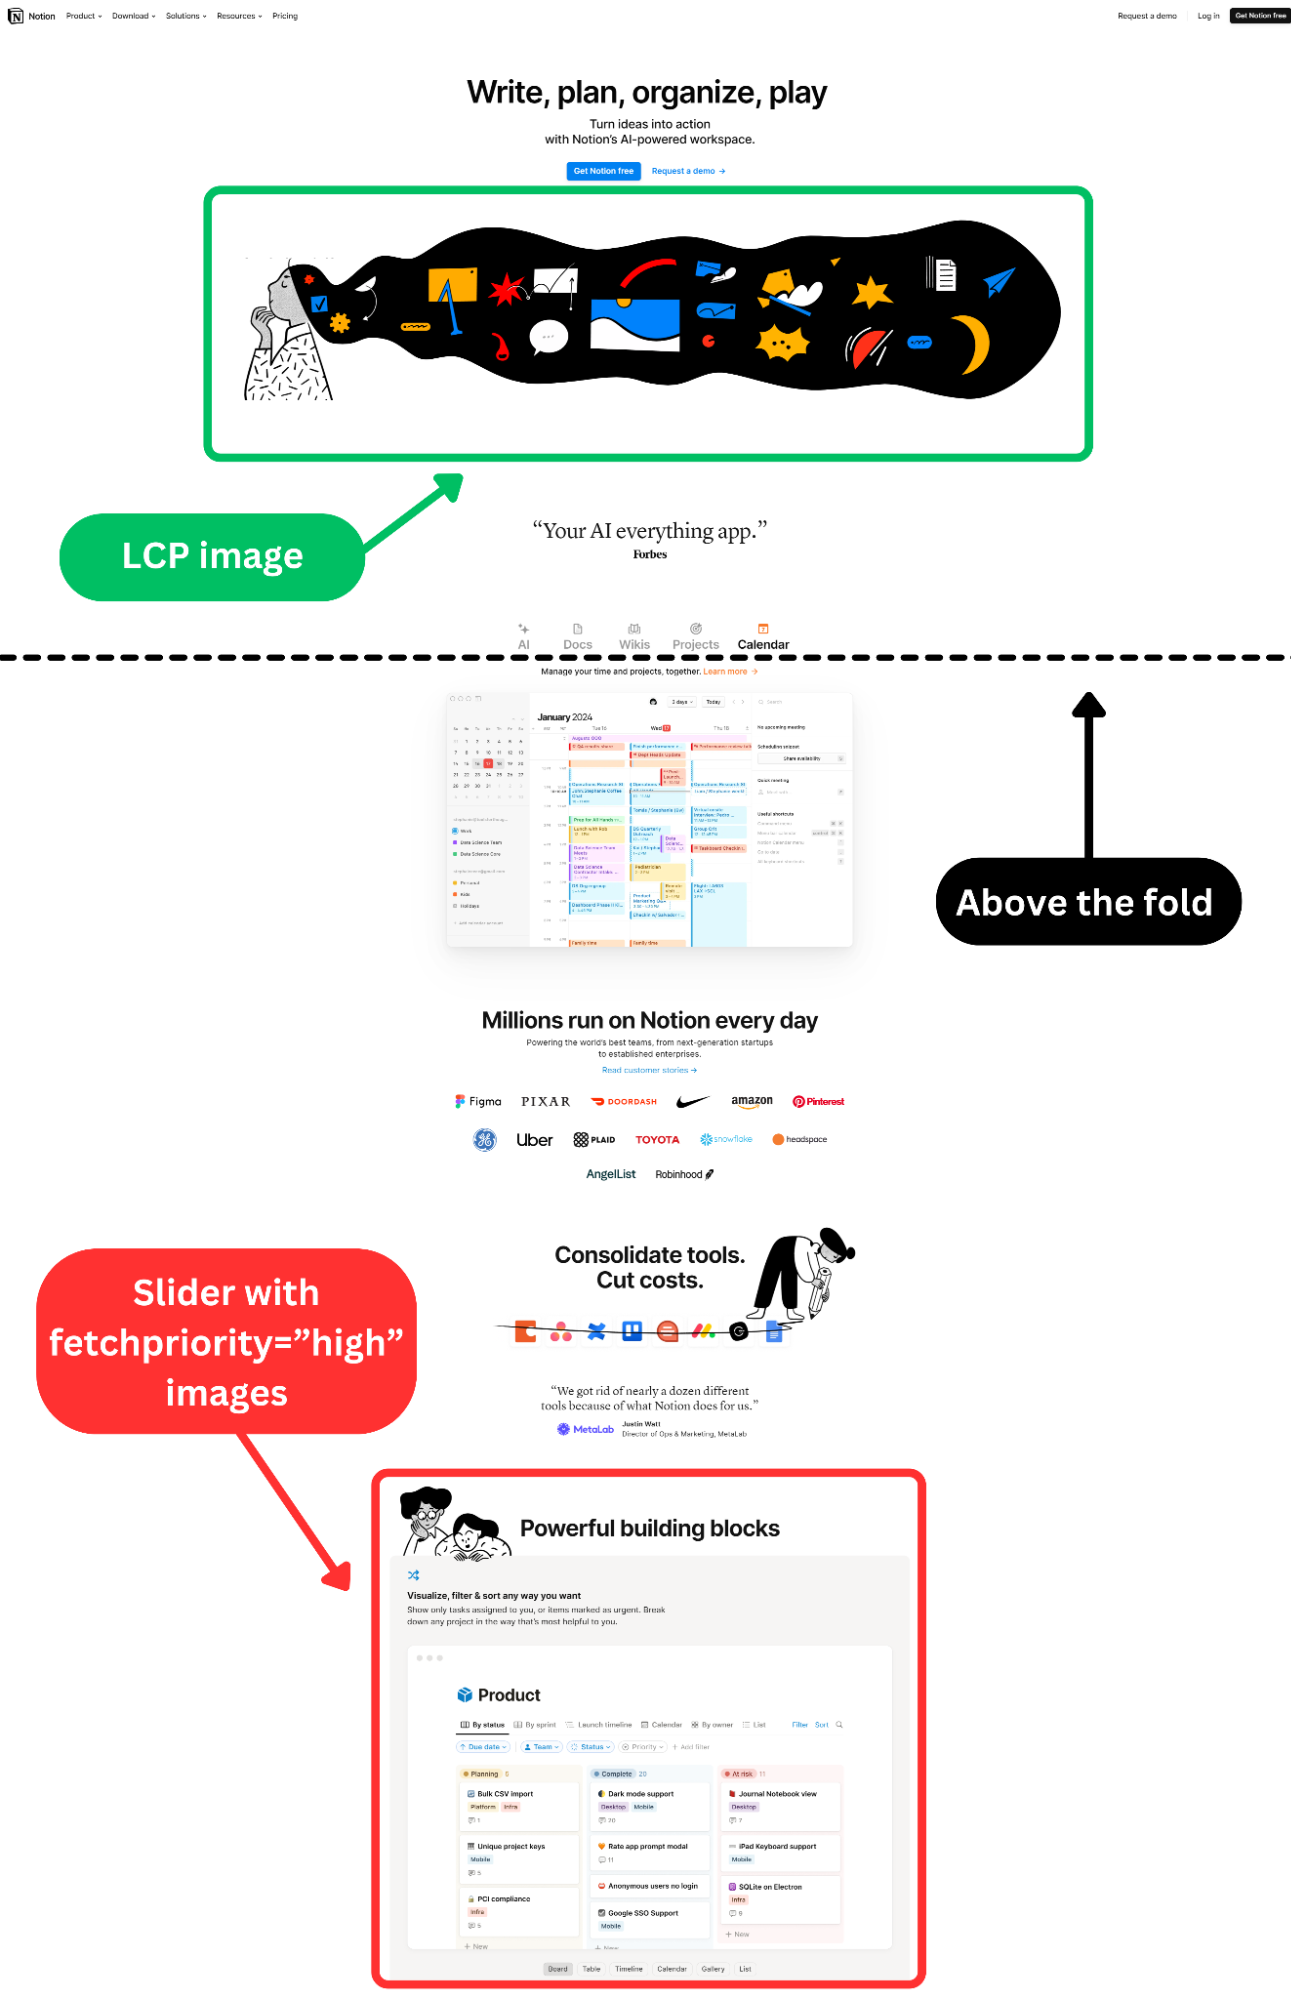
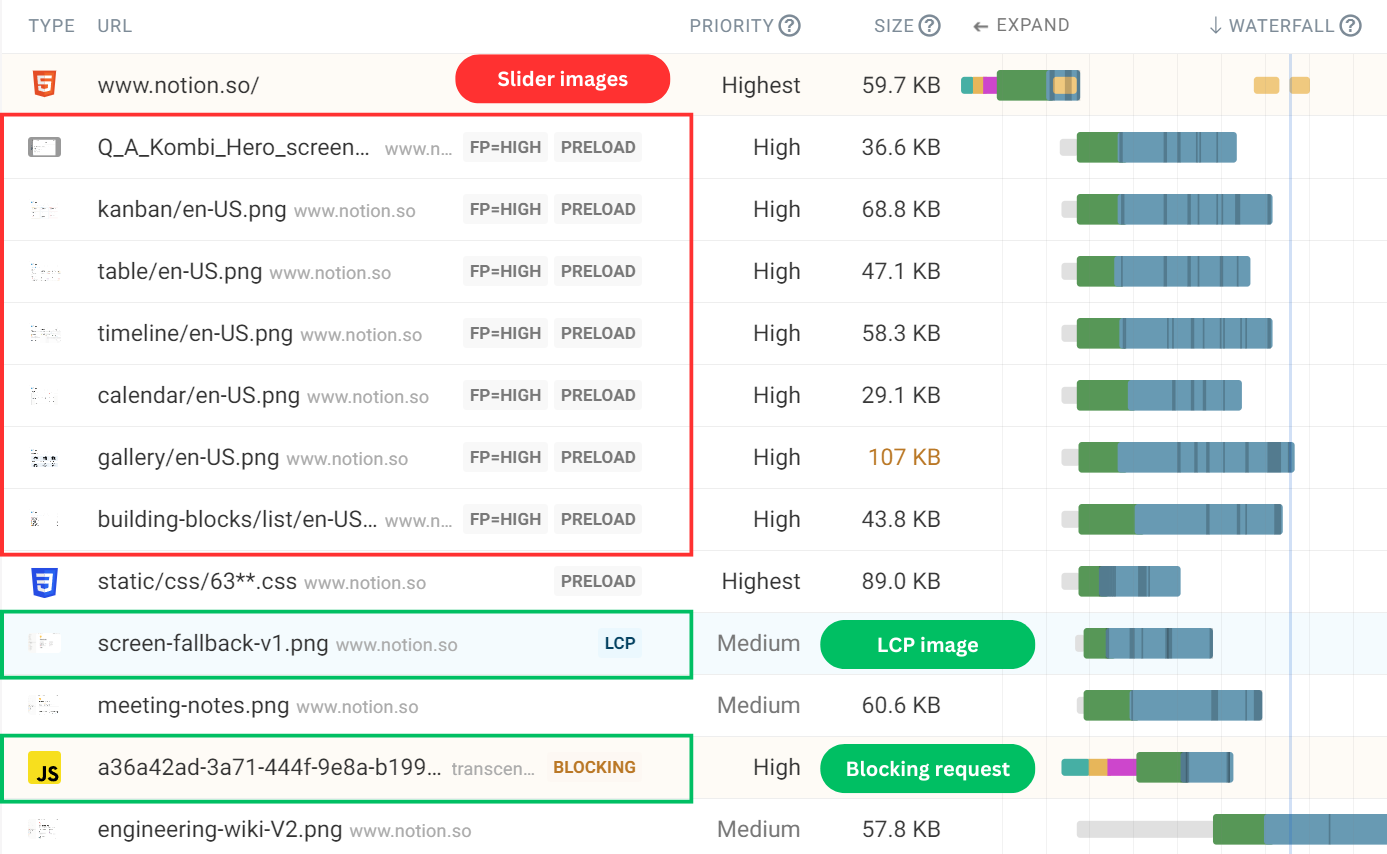
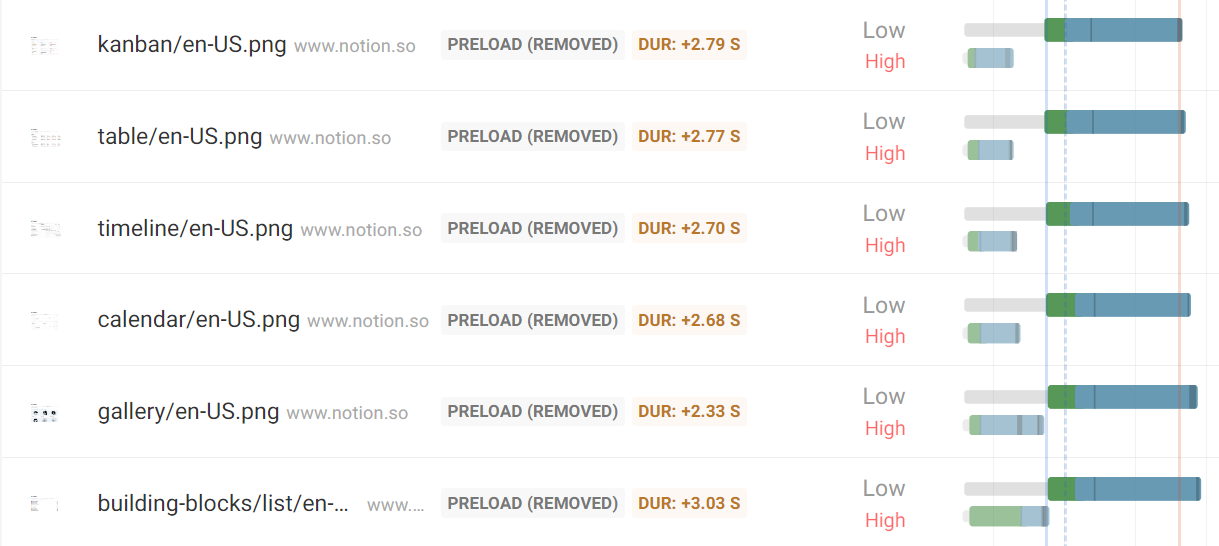
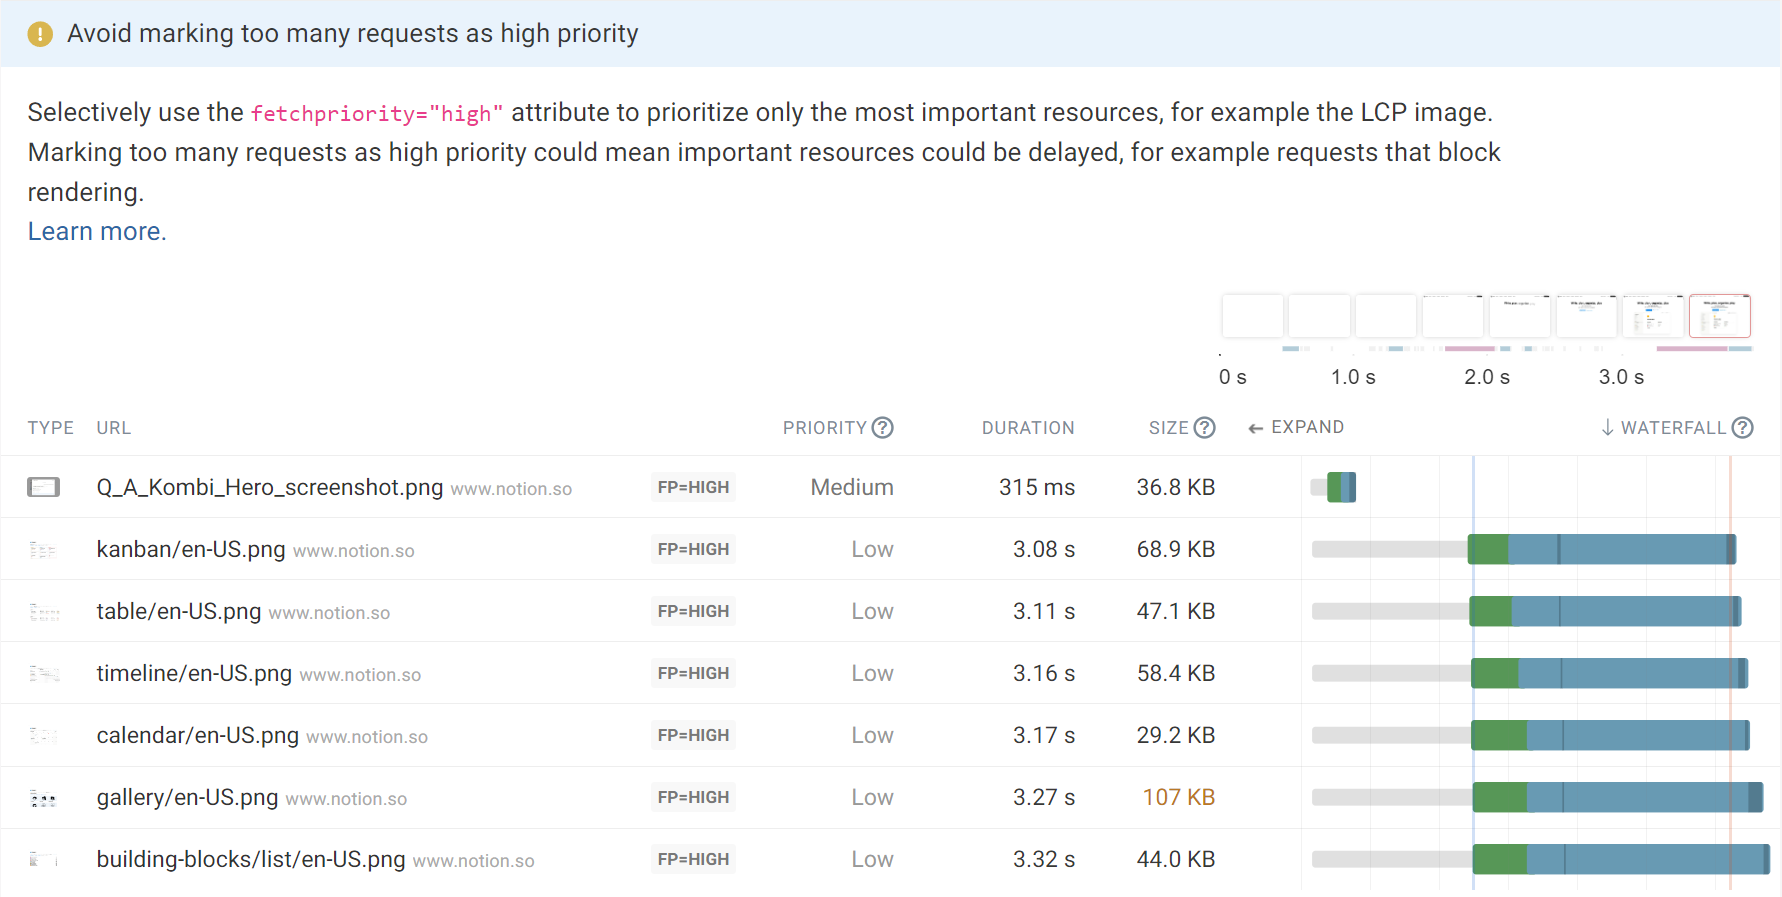
On this page, we can see a navigation bar and the LCP image. Below the fold, there is a slider containing seven images. Even though the slider only becomes visible when the visitor has scrolled down the page, the images in the slider all use `fetchpriority="high".
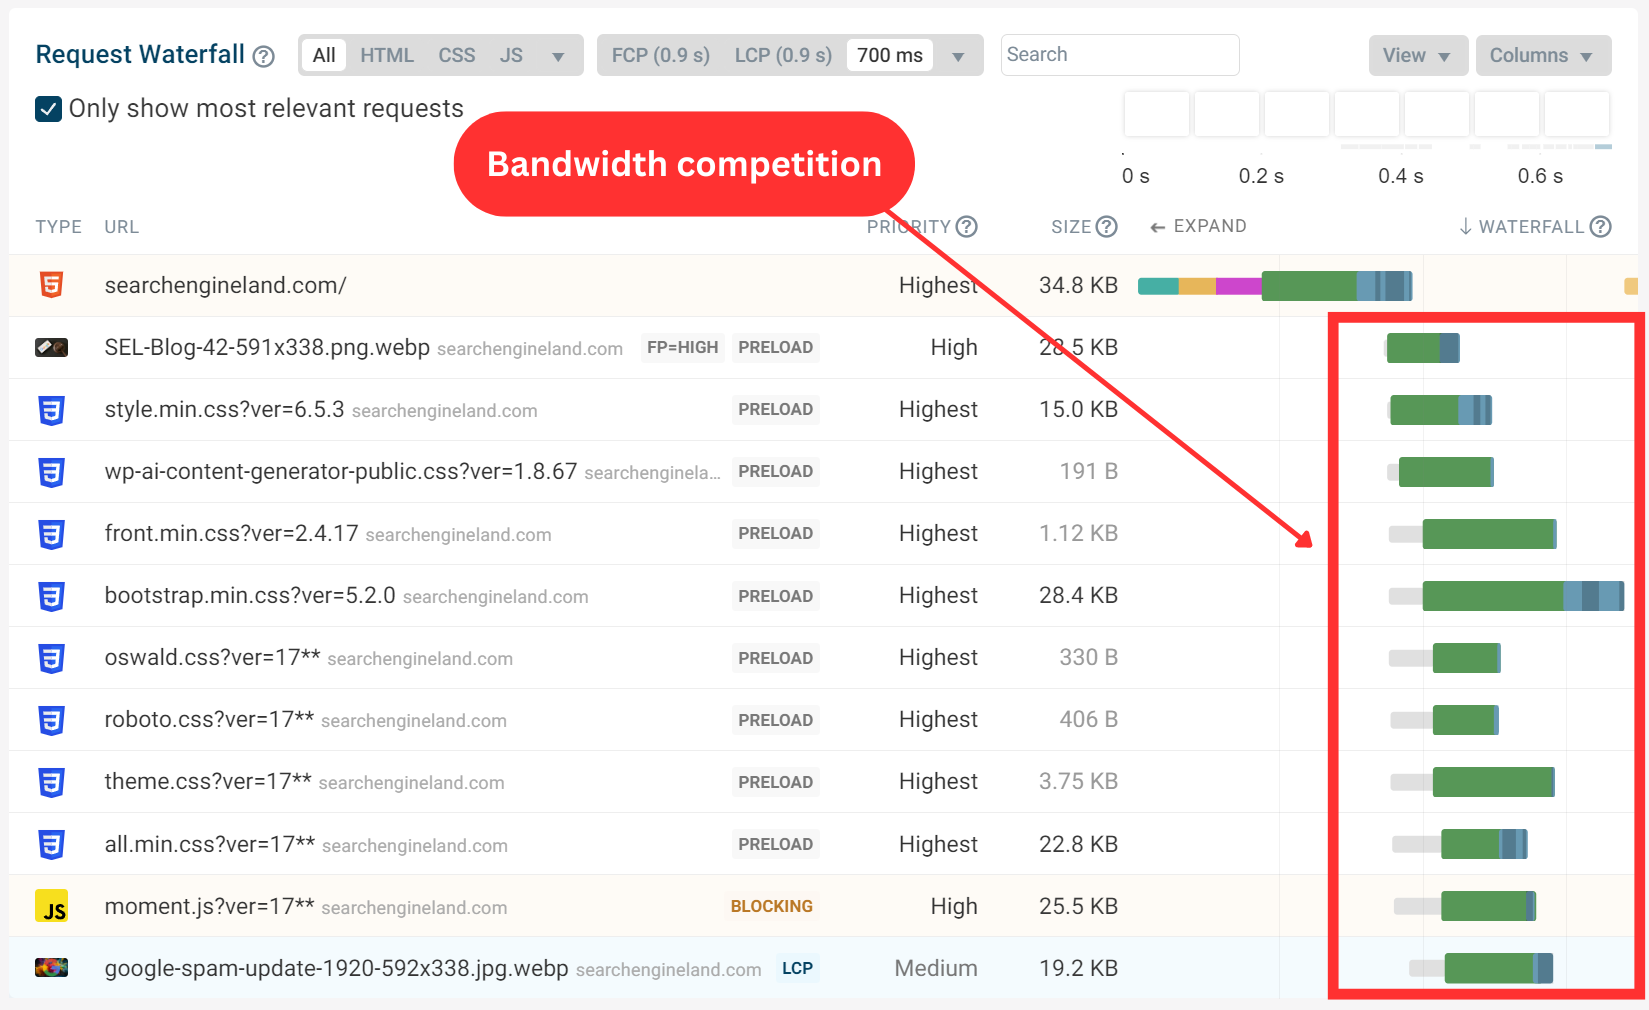
Let's look at the request waterfall to see how these 7 high priority images impact resource load time. We can see bandwidth competition among the slider images, all of which are set with fetchpriority="high". These images are prioritized ahead of the LCP image and a render-blocking script.
The bars on the right side represent the request time. The gray bar is the waiting time, the green is the server response time and the blue bar is the download.
We know these slider images aren't actually important. Instead, the render blocking script and the main image on the page should be downloaded first. But actually, as the slider images are prioritized, these two more important resources are loaded much later.
Currently, fetchpriority="high" is causing the page to load slower. The request waterfall helps us better understand how fetchpriority="high" could be utilized.
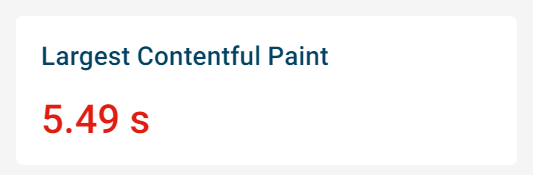
Currently, the high LCP score could be improved with some adjustments.
Using the fetchpriority attribute correctly
After analyzing the page layout and the request waterfall. We can make some changes to improve the metrics that we mentioned before.
The experiments feature in DebugBear allows us to try performance optimization without having to make changes on a production site. We will use this feature to remove fetchpriority="high" from each of the slider images. This should improve page load as the slider is below the fold.
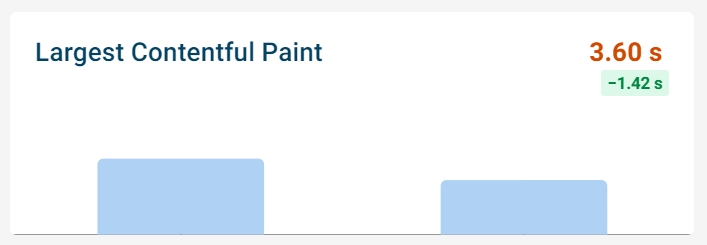
The results show that the LCP image now loads faster as it is no longer competing with the slider images.
There is still bandwidth competition between the slider images. But since the slider images now load later, they are not competing with more important requests. This allows the important requests to finish sooner.
Since the slider images appear below the fold, we don’t have to worry as much about optimizing the resource load times.
We can run another experiment by adding fetchpriority="high" to a more important request, such as the LCP image. With fewer requests competing for bandwidth, the browser should be able to display the LCP element even sooner.
The LCP element is a video with a poster attribute, allowing an image to serve as the LCP.
Adding fetchpriority="high" to the LCP image should further improve the LCP score.
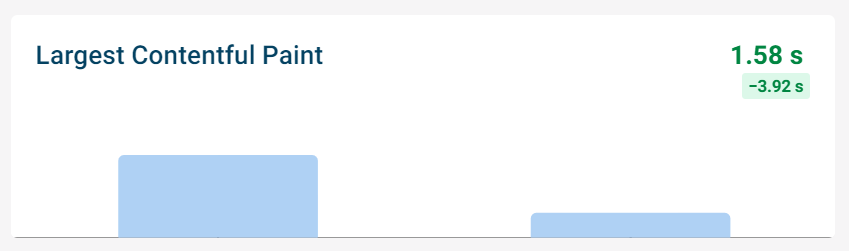
After running another experiment and preloading the poster image with fetchpriority="high", the LCP score has improved by almost 4 seconds in total.
How many fetchpriority requests is too many?
In the example above we only used fetchpriority="high" once. However, there are cases where you may need to use fetchpriority="high" on more than one resource.
From the perspective of improving Core Web Vitals we want to load LCP image early. That means being able to identify the LCP image when the <img> tag is generated on the server. However, there are some cases where identifying the LCP image can be more challenging:
- Device size: The LCP image may vary depending on the device size, requiring different images for different devices.
- Website setup: Your website setup might complicate identifying the actual element that will be the LCP. For instance, you might use a CMS where users can upload images of different sizes, which occupy varying amounts of space on different pages. To proactively identify the LCP, you'd need to measure the size of images and keep track of them on the server.
Purely in terms of user experience, you can also consider prioritizing all images that are frequently above the fold.
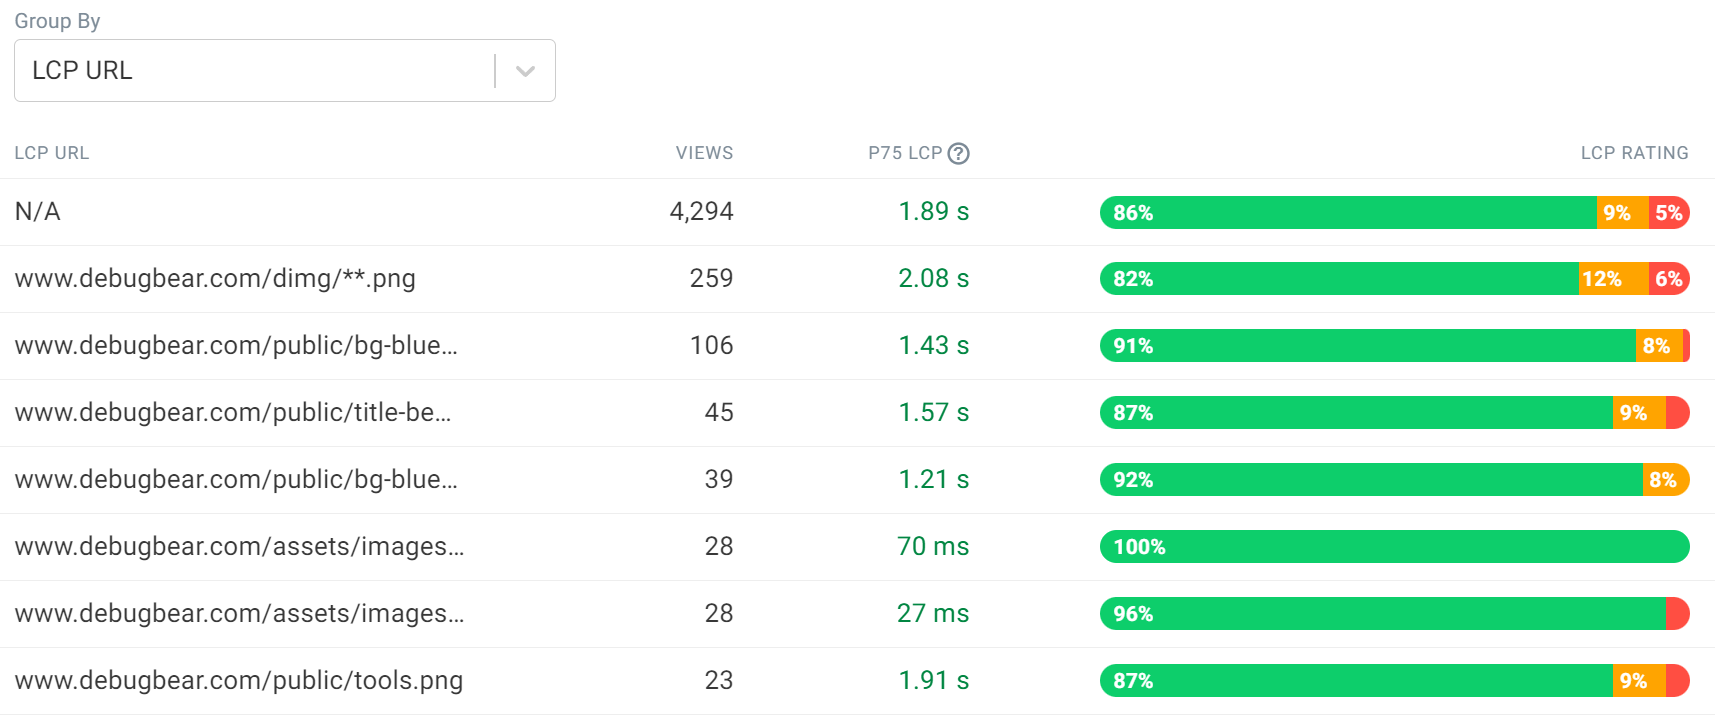
Using RUM data to identify the most common LCP images
If your LCP image varies across devices then using a Real User Monitoring tool can help you identify the most common LCP images. For example, if RUM data shows that three specific images account for 90% of LCP URLs, you can simply add fetchpriority="high" to these images.
With DebugBear real user monitoring you can find the most common LCP image URLs in the Table tab of the LCP dashboard.
Improve your website performance
From the examples we looked a we can see that fetchpriority="high" will result in bandwidth competition between important resources and less important resources that have been incorrectly prioritized.
To check if your website uses the Fetch Priority API too much, you can run a free page speed test on your website. If you overuse fetchpriority you'll see a warning in the Recommendations section.
Trying to optimize your page speed? Try DebugBear to monitor your performance continuously and get the data you need to make it faster.


Monitor Page Speed & Core Web Vitals
DebugBear monitoring includes:
- In-depth Page Speed Reports
- Automated Recommendations
- Real User Analytics Data