
An excessively large Document Object Model (DOM) can significantly impact website performance. This article explains the importance of DOM size optimization and suggests strategies to resolve issues related to large DOMs.
An example of excessive DOM size
As an example, consider the following HTML structure for a simple card component:
<div class="card">
├─ <div class="content">
│  ├─ <div class="wrapper">
│  │  ├─ <div class="container">
│  │  │  ├─ <div class="text-box">
│  │  │  │  ├─ <p class="paragraph">
│  │  │  │  │  ├─ <span class="highlight">
│  │  │  │  │  │  ├─ <strong>
│  │  │  │  │  │  │  ├─ <em>
│  │  │  │  │  │  │  │  ├─ <u>
│  │  │  │  │  │  │  │  │  ├─ "Hello"
This structure contains multiple nested elements to display some simple text. While this example performs perfectly well in isolation, it can become problematic when repeated across multiple card components on a page.
The impact of DOM size on website performance
The DOM represents the structure and content of a web page. An excessively large DOM can lead to:
- Slower initial page loads: The browser must download, parse, and render more HTML elements, leading to increased load times.
- Delayed user interactions: Complex DOM structures require more processing time, causing delays in user interactions such as scrolling and clicking.
- Increased memory usage: Large DOMs consume more memory and can be especially problematic on mobile devices with limited resources.

The Optimize DOM Size Lighthouse audit
The Optimize DOM Size audit in Lighthouse warns you about large DOMs:
- Lighthouse issues a warning if the body element contains over approximately 800 nodes.
- Lighthouse reports an error if the body element contains over approximately 1,400 nodes.
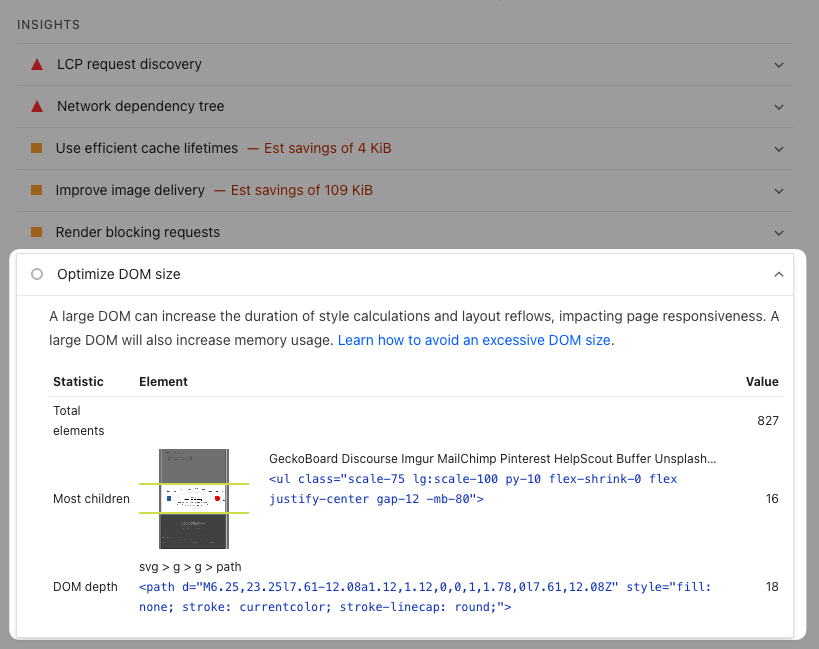
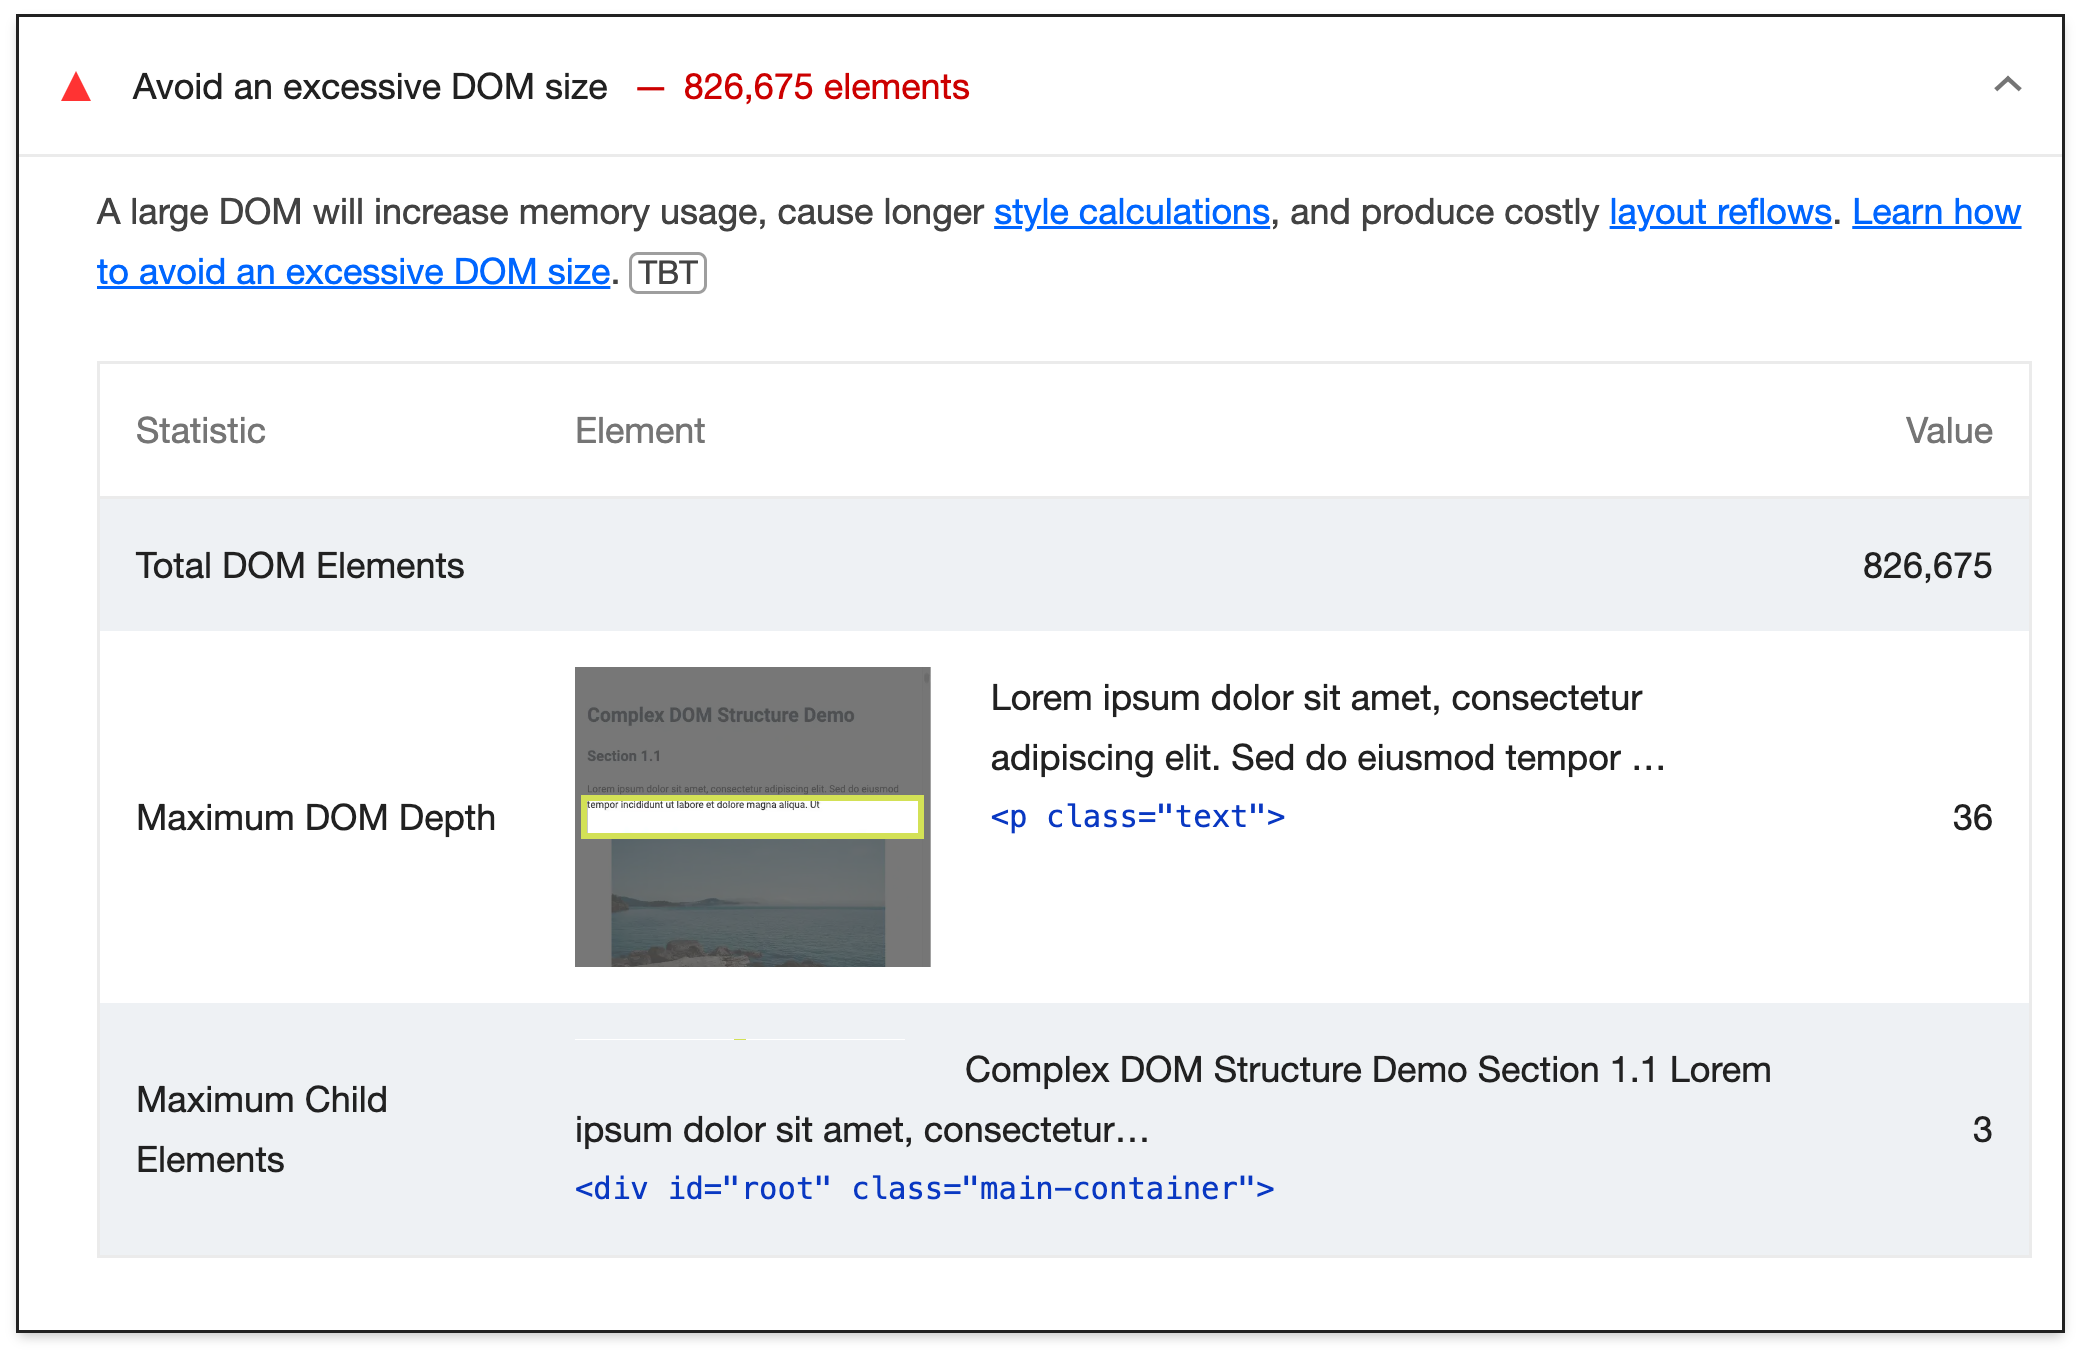
The audit was previously called "Avoid an excessive DOM size". Lighthouse explains the impact of a complex page like this:
A large DOM can increase the duration of style calculations and layout reflows, impacting page responsiveness. A large DOM will also increase memory usage.
Lighthouse reports three different DOM size statistics:
- Total DOM Elements
- Most Children
- Maximum DOM Depth
Total DOM Elements
This metric counts the number of elements on the page. It includes any elements that are part of a shadow DOM.
Having a lower number of DOM elements is better for page performance. Only this statistic is used to score the audit in Lighthouse.
Most Children
This metric tells you the largest number of children any one individual page element has. For example, the code below shows a DOM element with three children.
<ol>
  <li>1</li>
  <li>2</li>
  <li>3</li>
</ol>
The Maximum Child Elements metric also doesn't impact the audit score. If the count is greater than 50, it's worth looking at the element to check why there are so many child elements. For example, you might find a slider with more images than anyone will ever look at!
Keep in mind that these statistics are heuristics to help you understand and debug page speed issues. Focus optimizations on overall DOM size and CPU metrics like Total Blocking Time
Maximum DOM Depth
This statistic measures how deeply nested your DOM is. It starts from the body element, so in the example below the DOM is 4 levels deep.
<html lang="en">
  <body>
    <!-- 1 -->
    <header>
      <!-- 2 -->
      <div>
        <!-- 3 -->
        <h1>DOM Depth Example</h1>
        <!-- 4 -->
      </div>
    </header>
  </body>
</html>
Lighthouse does not score this metric, but typically a DOM depth below 30 is a good enough count.
DOM size and Core Web Vitals
The size of your DOM can impact your Core Web Vitals metrics, which are important for search engine optimization.
Largest Contentful Paint (LCP)
Largest Contentful Paint measures how quickly the main content of a page becomes visible. A large DOM requires more download time and more processing time before the browser can render content, potentially delaying LCP.
Interaction to Next Paint (INP)
Interaction to Next Paint assesses page responsiveness. With a large DOM, the browser must perform more extensive style recalculations and layout work when users interact with the page, leading to delays in visual updates.
Measuring DOM size and its impact
You can use a variety of techniques to understand how DOM size affects your website's performance:
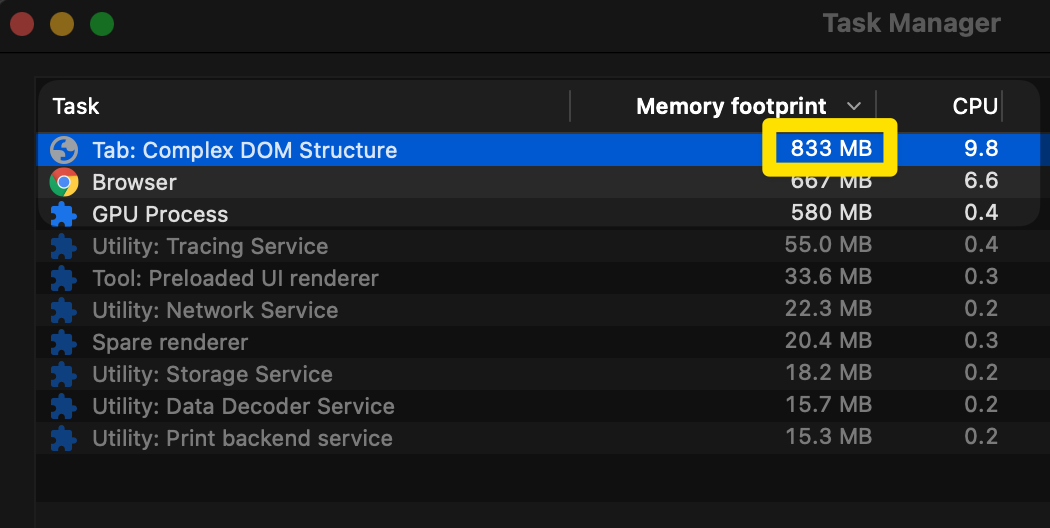
Chrome tab memory usage
Chrome has a built-in task manager. You can use it to monitor the memory usage of individual tabs, including the memory consumed by the DOM.
The following screenshot shows the memory footprint for tabs open in Chrome. The tab with the highest memory footprint uses no JavaScript, yet still consumes a large amount of memory due to its large DOM:
DevTools heap snapshot
You can take a heap snapshot in Chrome DevTools to analyze the memory usage of your website's DOM. The following table shows a heap snapshot of a website with a large DOM:
| Constructor | Retained Size (MB) |
|---|---|
| Window | 71.76 |
| Text ×537316 | 40.99 |
<div> ×139301 | 13.83 |
<img> ×19900 | 4.55 |
<figure> ×19900 | 1.97 |
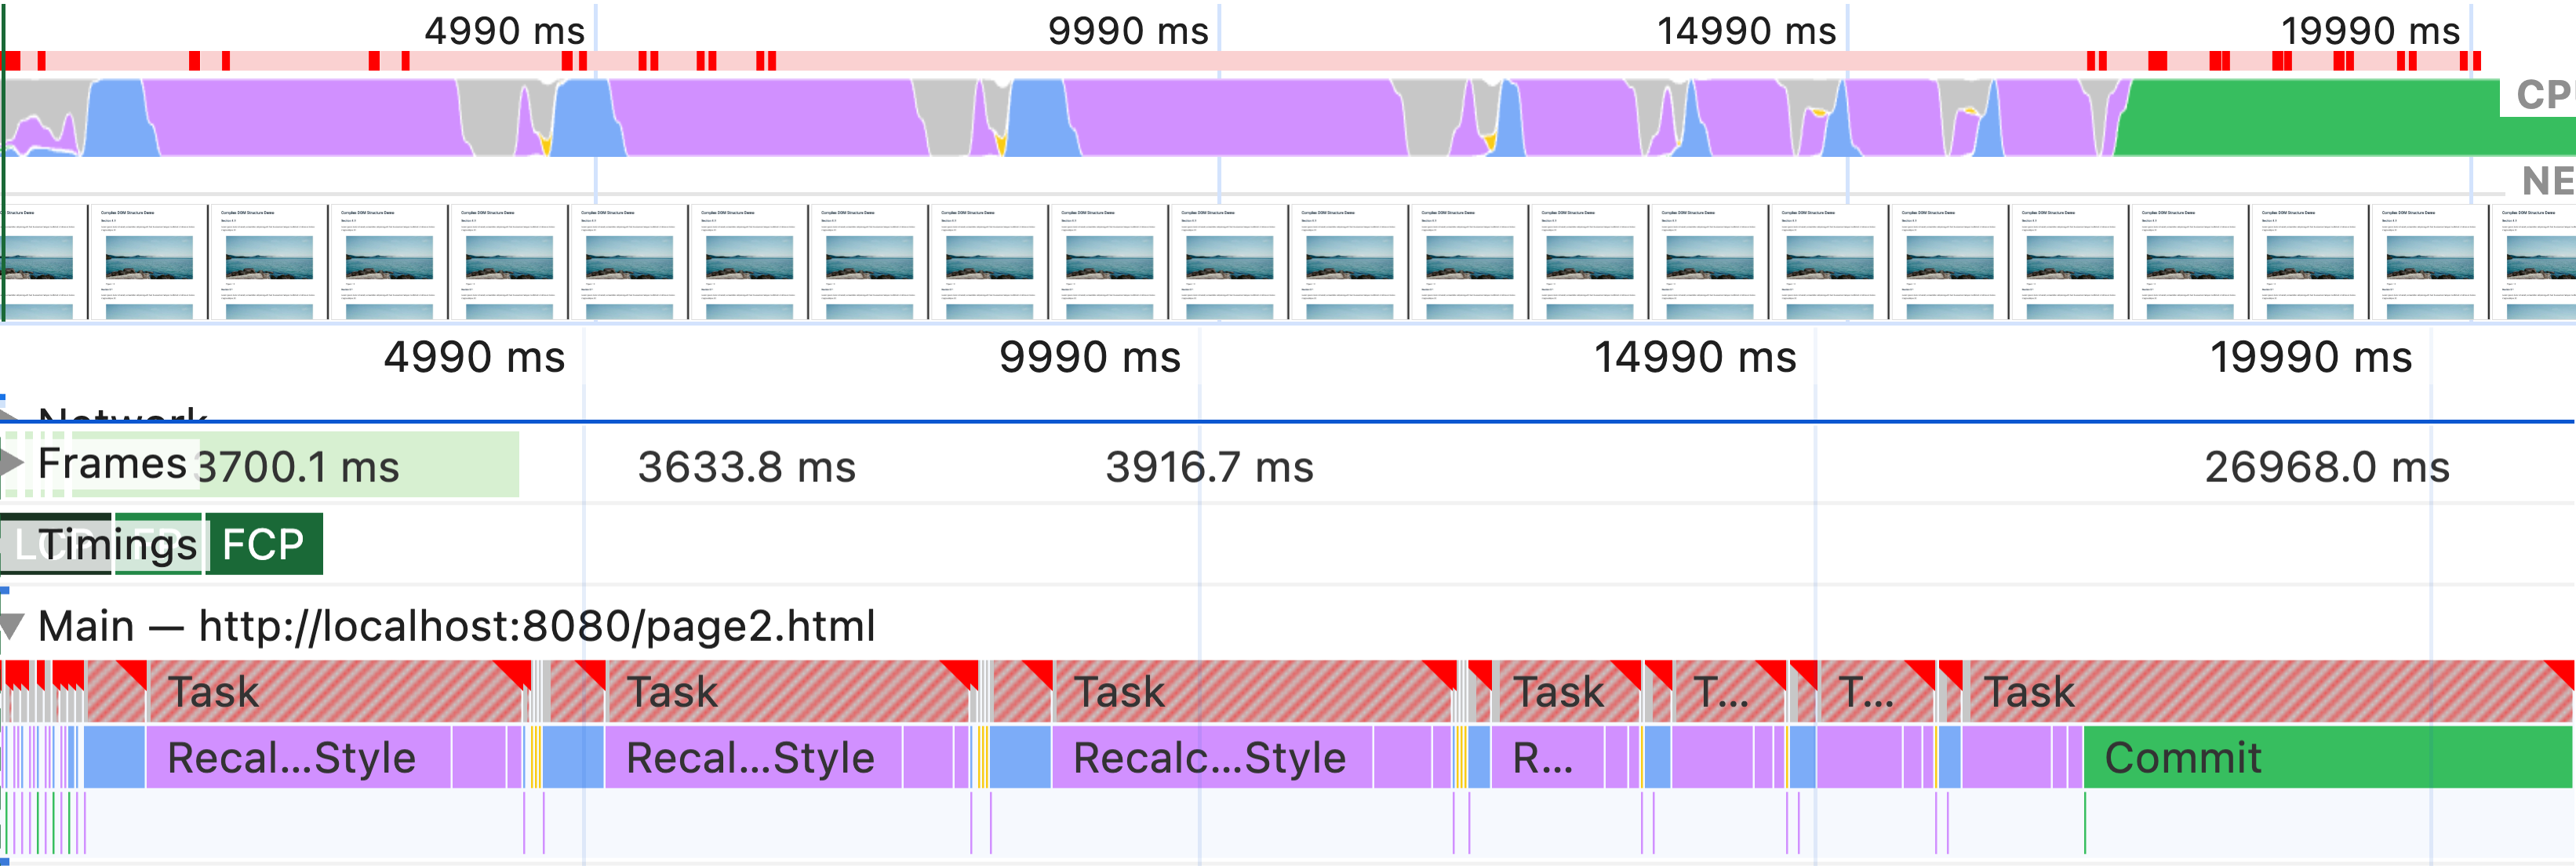
Performance profile in DevTools
You can use the Performance panel in Chrome DevTools to profile page load and interactions. The following screenshot shows a performance profile during a page load of a website with a large DOM:
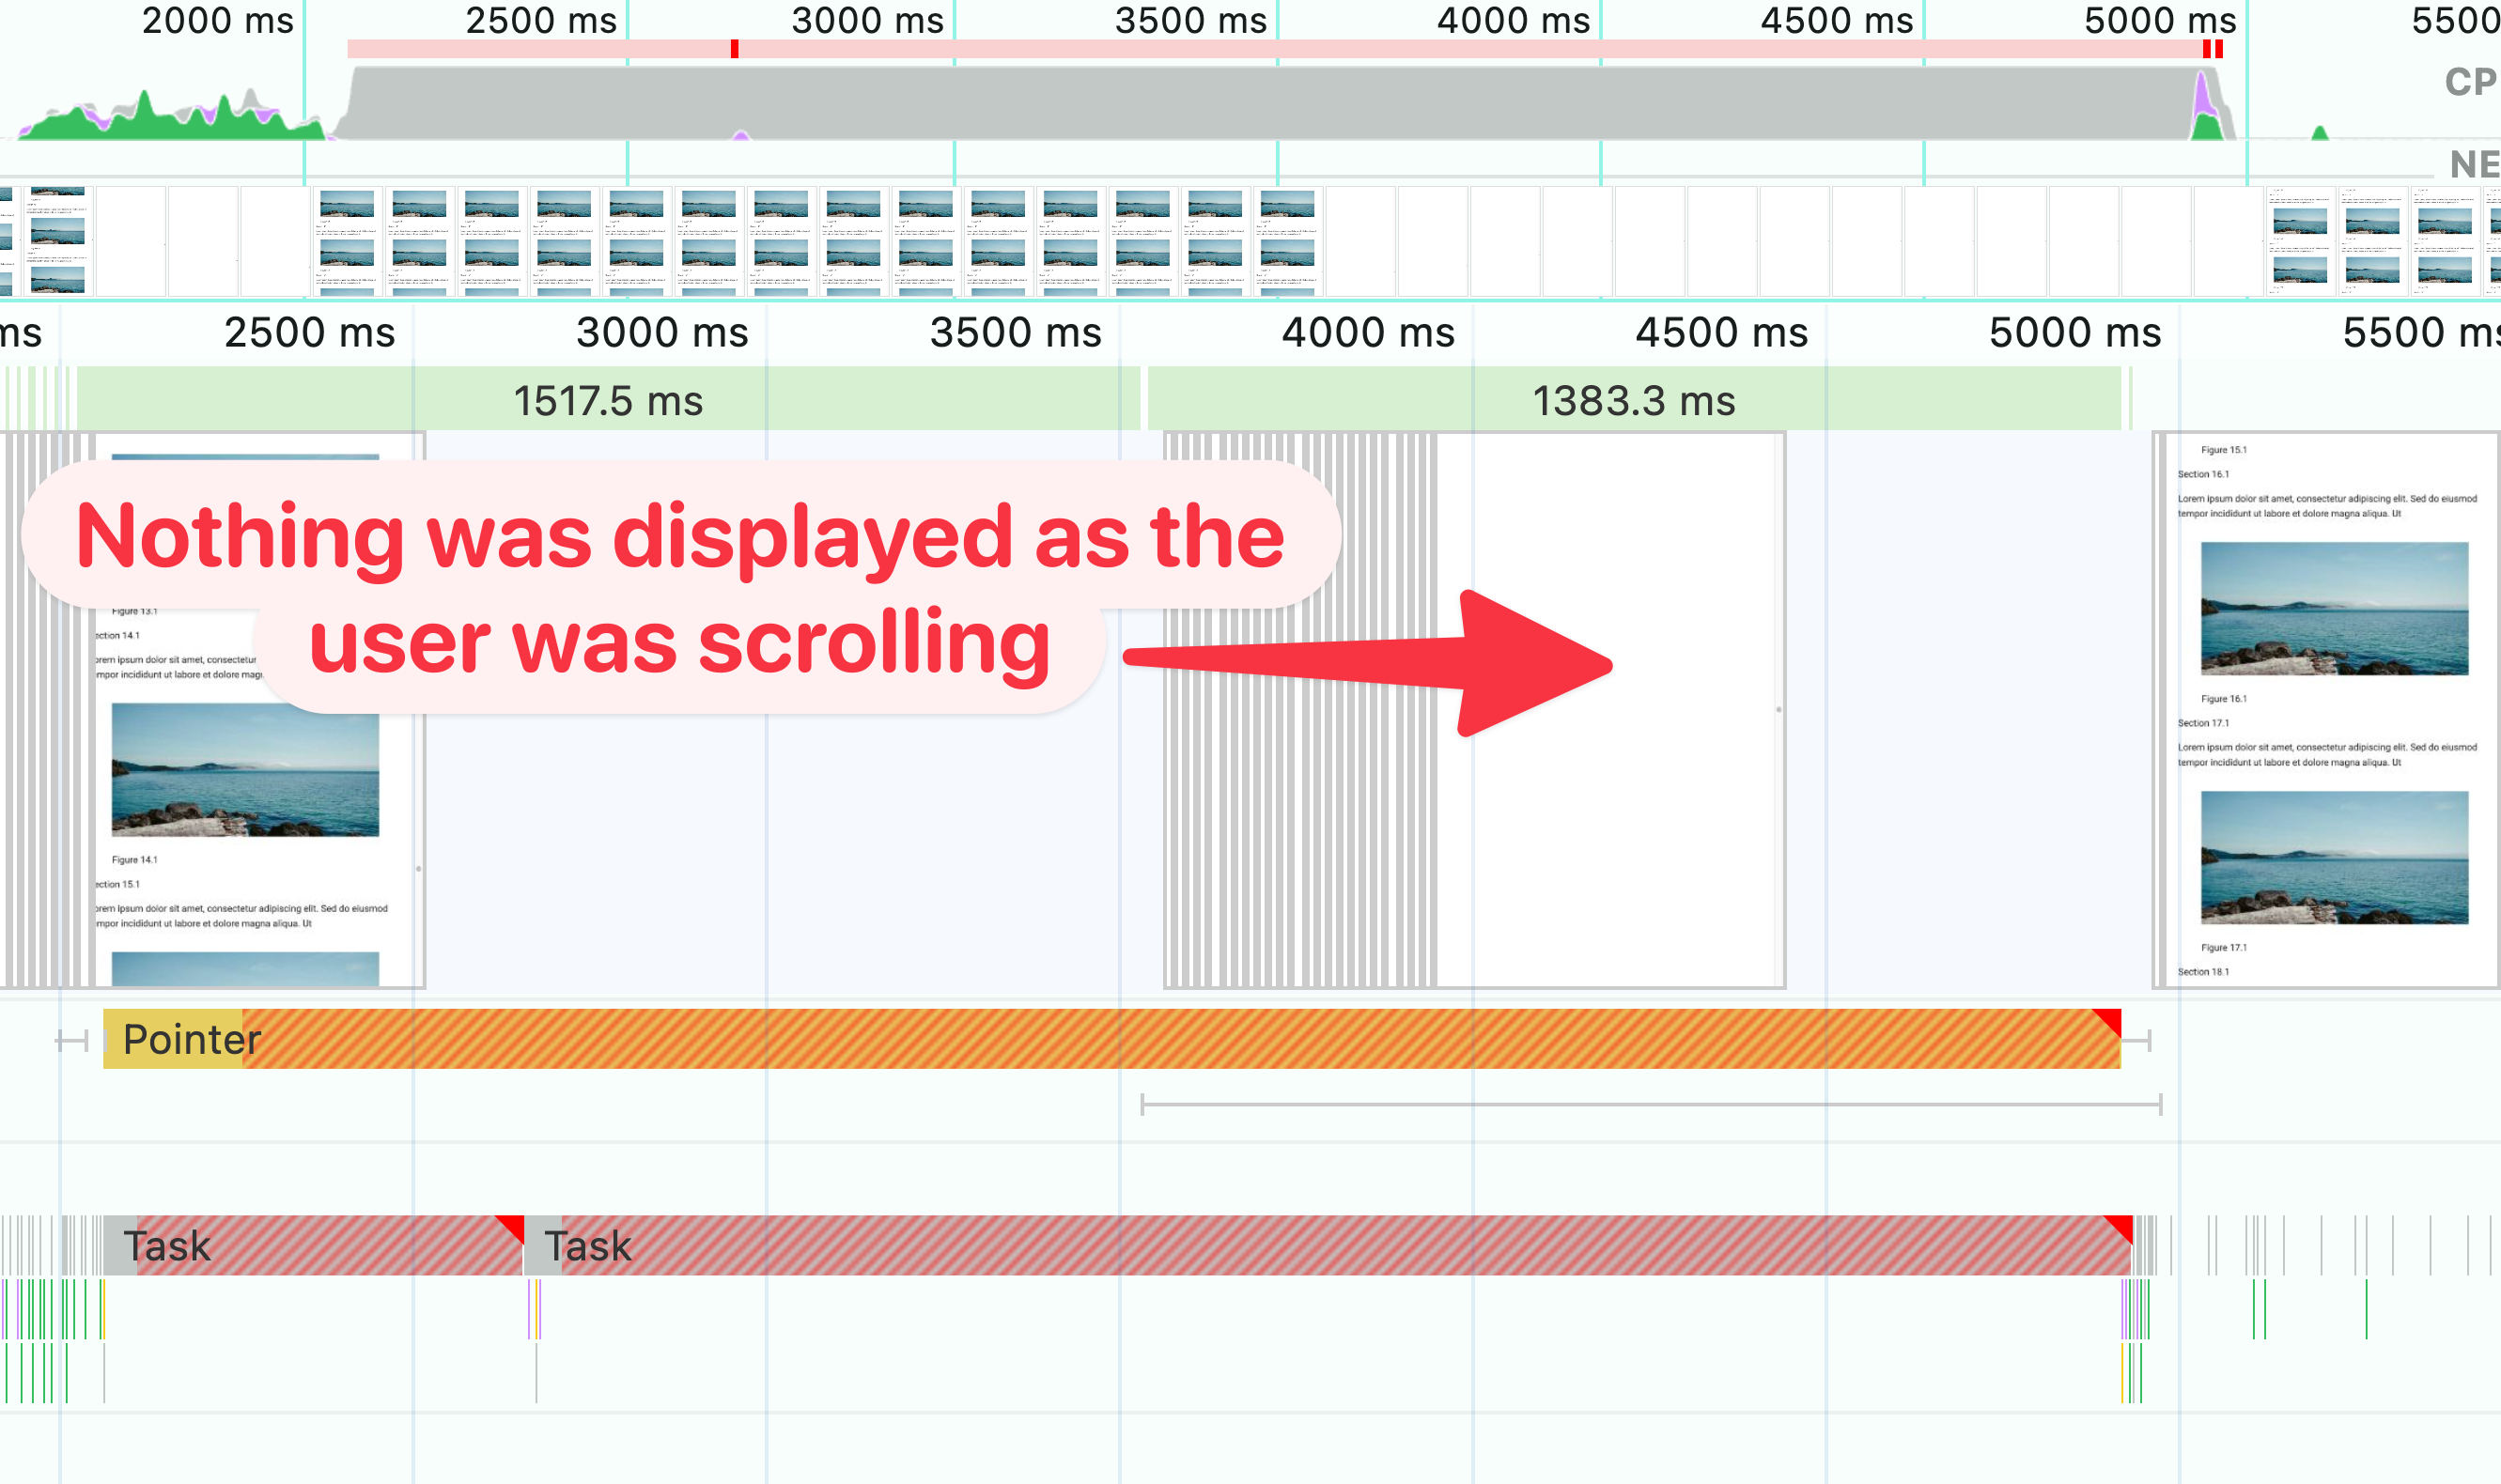
The following screenshot shows a DevTools performance profile during scrolling, highlighting the impact of a large DOM on user interactions. The browser couldn't display the contents of the page fast enough to match the user's scrolling speed:
Rapid scroll test
While a bit less scientific, you can also perform a rapid scroll test to see how your website behaves when users scroll quickly. Scroll the page very quickly, or even drag the scrollbar handle (within the scroll bar) to quickly scan through the page. If the page lags, or if content doesn't render quickly enough, this could be the sign of a large DOM.
Lighthouse performance audit
Lighthouse warns you about excessive DOM size in its performance audit. The following screenshot shows the Lighthouse performance audit failing due to an excessive DOM size:
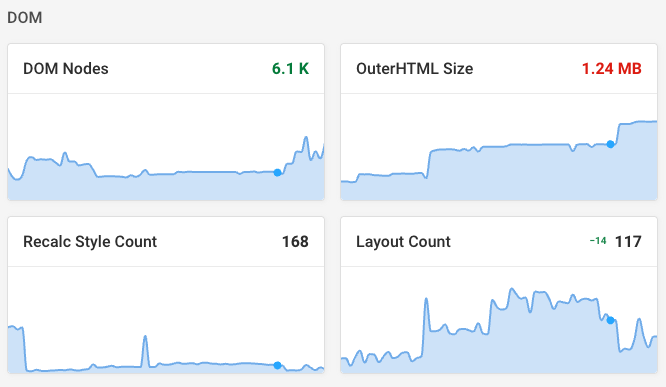
DebugBear website speed test
The DebugBear website speed test provides a detailed breakdown of your website's performance, including DOM size - through Lighthouse reports.
How to fix an excessive DOM size
Depending on your website architecture, you may need to adopt different strategies to reduce DOM size. Consider the following:
1. Flatten HTML structure
Simplify nested structures to reduce DOM depth:
Note that content management systems (CMS) and templating engines can sometimes generate unnecessary nesting. Review your templates to ensure they produce efficient HTML.
2. Use CSS Grid and Flexbox
Modern CSS layout techniques can often replace complex nested structures, reducing the need for multiple container elements. As you transition to using more modern layout techniques, you can then identify and remove unnecessary wrapper elements and repeated structures.
3. Audit third-party scripts
External widgets, tracking scripts, adverts, and more can significantly increase DOM size. You should regularly review and remove unnecessary third-party scripts from your website.
The relationship between CSS complexity and DOM size
As DOM size increases, the cost of CSS operations also grows:
- Style recalculations: As the number of elements increases, the browser must perform more calculations to determine the final styles for each element.
- Layout operations: Changes to the DOM can trigger layout recalculations, which become more expensive with larger DOMs.
- Selector matching: Complex CSS selectors take longer to match against a larger number of elements.
To mitigate these issues:
- Simplify your CSS selectors
- Use CSS methodologies that promote flat structures, e.g. BEM
- Use CSS containment to isolate parts of the page
Additional considerations
- Some JavaScript frameworks may contribute to excessive DOM size. When choosing a framework, consider its impact on DOM complexity.
- The
content-visibilityCSS property can help reduce rendering time for off-screen content in large DOMs.
Measuring the Impact of Optimizations
After implementing these changes, you can use DebugBear to track improvements in DOM size and overall performance.
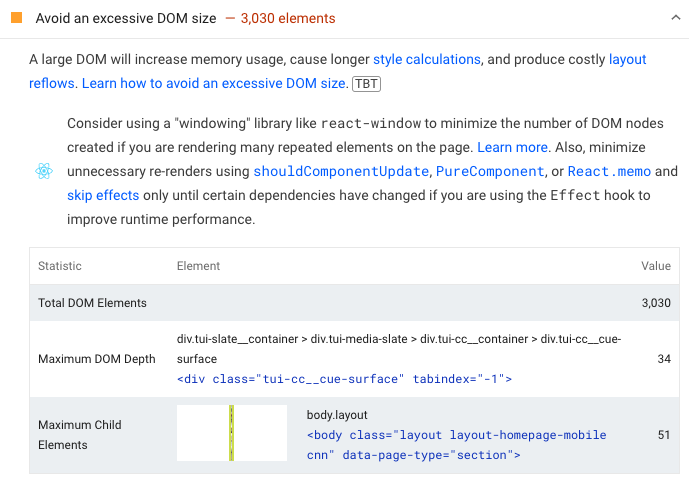
Excessive DOM Size in React
Single-page applications built using frameworks like React are often complex and display a lot of data. Accordingly, they can have a high DOM size that can impact performance.
Lighthouse provides tailored suggestions for React apps. A windowing library like react-window can help you only create DOM nodes for list items that are actually being displayed to the user.
You can also use libraries like react-intersection-observer to check if an element is in the viewport and only render more detailed content when that's the case.
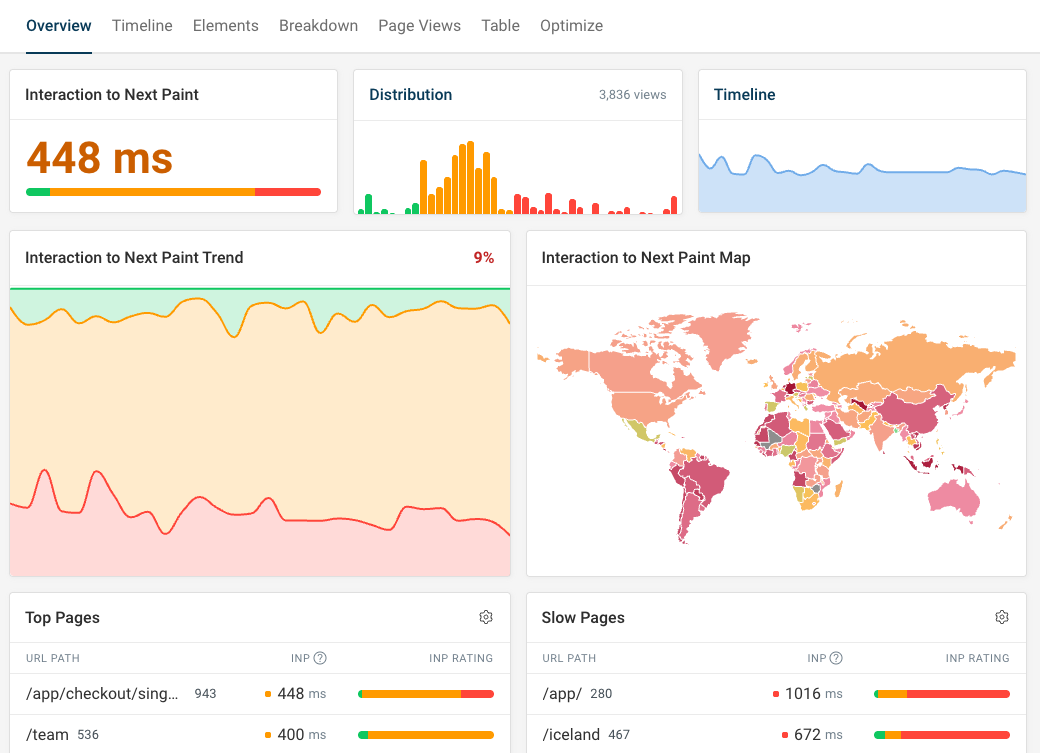
Check INP improvements with real user monitoring
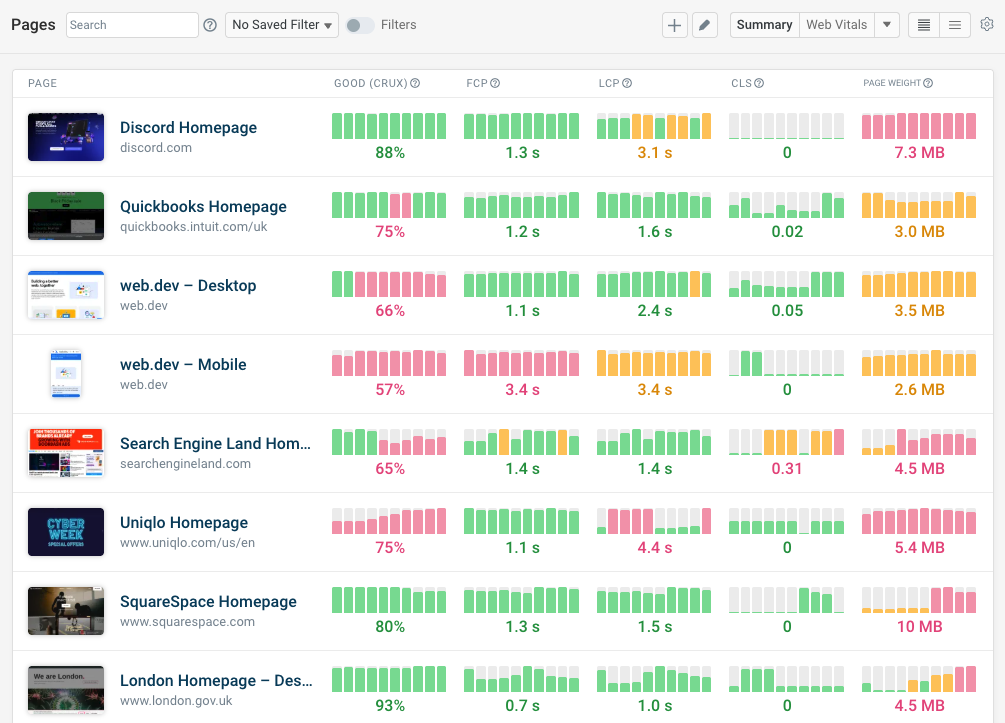
Simplifying your website can have a big improvement on the Interaction to Next Paint metric. Since it depends on user interactions, you need real user monitoring to keep track of this metric.
You can easily measure INP across your website to see whether your overall score is improving and what pages need to be optimized further.
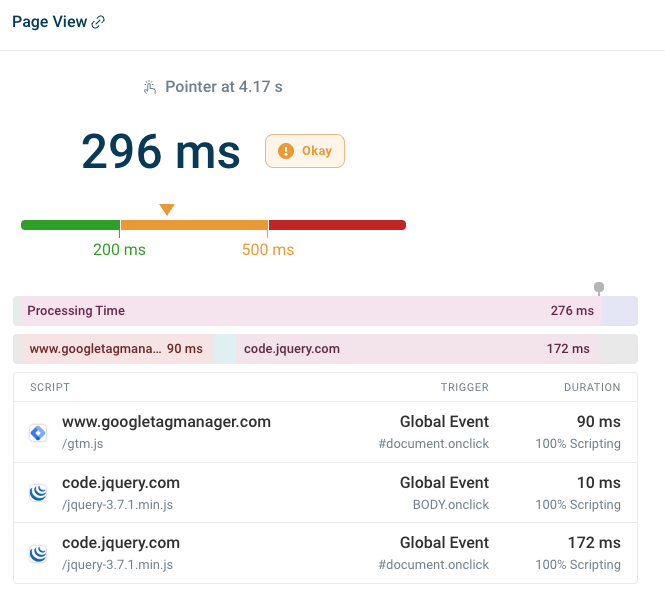
To identify exactly what is causing slow performance, DebugBear breaks down the INP score into its three components: Input Delay, Processing Time, and Presentation Delay. If you have high presentation delay that may indicate overly complex page content and styling.
We also use the Long Animation Frames API to identify specific scripts that are slowing down interactions. Click on each one to see whether the script spends its time executing code or if it's triggering style recalculations.
Monitor DOM size and web performance
Optimizing DOM size is part of maintaining a fast and responsive website. By implementing these strategies, you can improve your site's performance, enhance Core Web Vitals scores, and provide a better user experience.
DebugBear can help you keep track of your website performance by providing in-depth performance insights and alerting you when something goes wrong. Sign up for a free trial.


Monitor Page Speed & Core Web Vitals
DebugBear monitoring includes:
- In-depth Page Speed Reports
- Automated Recommendations
- Real User Analytics Data