Recording a performance trace with Chrome DevTools provides you a lot of data about your website speed.
But the performance recordings can also be confusing and full of data. The new annotations feature helps you highlight interesting observations, raise questions, and provide explanations. That way you can easily share your thoughts with other team members.
This feature will land in Chrome 131, which becomes the stable version on 12 November 2024.
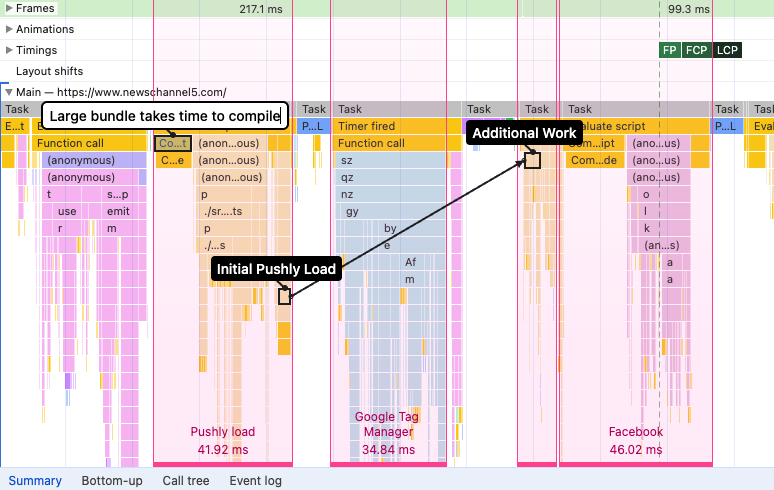
How to add an annotation in Chrome DevTools
To annotate a specific item in the performance recording you need to
- Record a performance trace
- Right click a trace item and click Label Entry
- Enter your label
- Press enter or click outside the annotation
You can also double-click a trace item to add an annotation.
Types of DevTools performance annotations
Chrome supports three types of annotations:
- Item labels
- Item connections
- Time ranges
Item labels
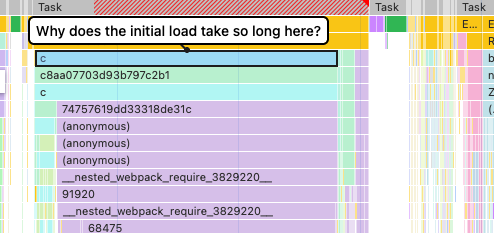
Labels provide an easy way to add more information to a CPU task, network request, rendering milestone, or other trace item.
For example, you can:
- Point out specific tasks that delay rendering
- Provide explanations for performance behavior
- Raise questions about what causes delays
Item connections
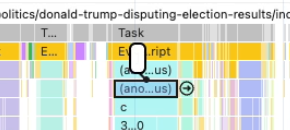
Connections let show causality or sequence between different trace entries. They let you draw arrows between different items in the performance recording.
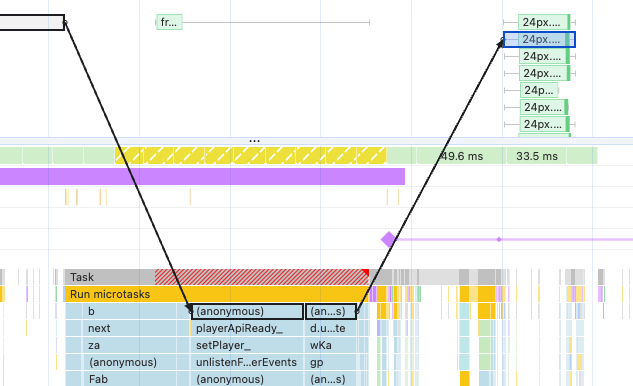
You can add a connection by right-clicking and then selecting Link entries. Or you can double click an item and then click on the little arrow button to the right of it.
Time ranges
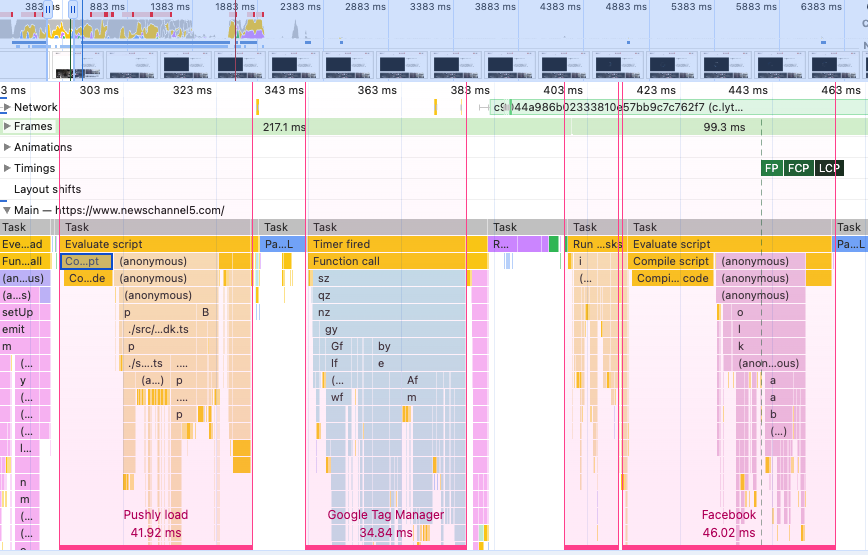
Time ranges let you label what happens in different parts of the recording. For example, you can highlight specific scripts or third parties that are slowing down your page.
To add a time range:
- Hold the shift key
- Click the starting location, and hold the mouse button
- Release the mouse button at the end time
- Assign a label
View a list of trace annotations
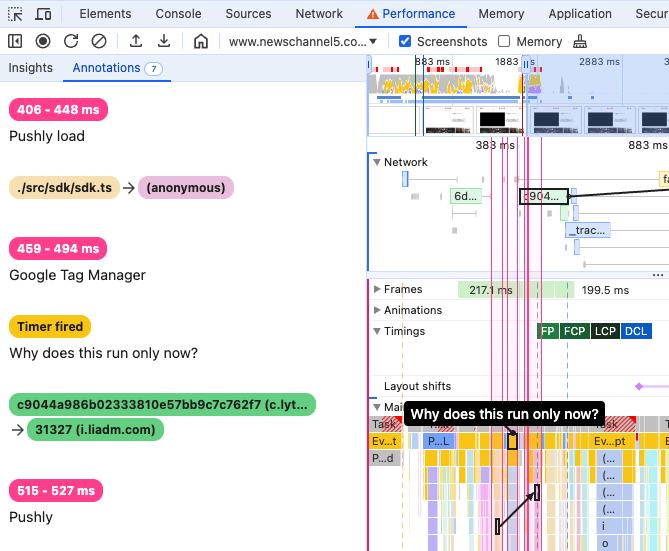
You can view all available trace annotations in the Annotations pane on the left of the trace recording.
Hover over an item and click the trash icon to delete it.
How to share annotated trace recordings
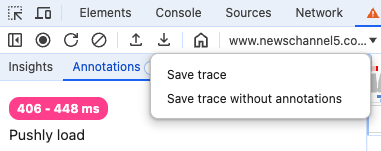
While you can share screenshots of your annotated trace, exporting the trace along with all annotations is more flexible and lets other add additional notes.
To do that, click on the Save Profile icon and select Save trace.
