
Website performance and reliability help businesses to succeed. Continuous website monitoring lets you catch issues before they impact your users. This post explores different types of website monitoring and what they are used for.
Understanding Website Monitoring
Website monitoring is the process of continuously checking your website's performance, availability, and functionality.
Why Monitor Your Website?
Monitoring your website means you'll get alerted to changes and quickly fix problems before they impact your visitors and customers.
Here are some benefits of website monitoring:
- Improve User Experience: When you're able to proactively identify and resolve issues, you help visitors have a positive experience on your site.
- Increase Conversions: A well-performing website is more likely to convert visitors into customers.
- Protect Brand Reputation: Poor performance can hurt your brand's reputation.
- Gain Competitive Advantage: A fast and reliable website helps set you apart from competitors.
Who Benefits from Website Monitoring?
Incorporating website monitoring into your process can help a number of teams in your company:
- Developers: See how code changes impact performance.
- IT Operations / DevOps: Ensure system reliability and understand how spikes in traffic are handled.
- Marketing Teams: Understand how website performance affects user engagement and conversions.
- Business Leaders: Learn about the impact of website performance on business metrics.
Types of Website Monitoring
This guide covers the following types of website monitoring:
- Performance Monitoring: Synthetic monitoring and real user monitoring (RUM)
- Availability Monitoring: Uptime and API monitoring
- User Experience Monitoring: Transaction and end-user monitoring
- Server-Side Monitoring: Used within application performance monitoring (APM)
Carry on reading to learn the details of each:
Performance Monitoring: Synthetic vs. Real User Monitoring
Performance monitoring helps you understand how your website behaves under different conditions. You can group performance monitoring into two categories: synthetic monitoring and real user monitoring.
Synthetic Monitoring
Synthetic monitoring means testing user experiences with your website from controlled lab environments. This allows you to:
- Continuously test your website's performance: Track changes over time and investigate regressions.
- Identify issues before they affect real users: You can run synthetic tests in staging environments, or immediately after deploying new features.
- Monitor popular user flows: Check that your core user journeys, such as a payment checkout process, work as expected.
- Compare performance across different locations and devices: Learn how your site performs for users in different geographic regions and on different device types.
Synthetic monitoring gives you in-depth reproducible data that you can use to optimize your website and keep it fast over time.
Examples of synthetic monitoring tools:
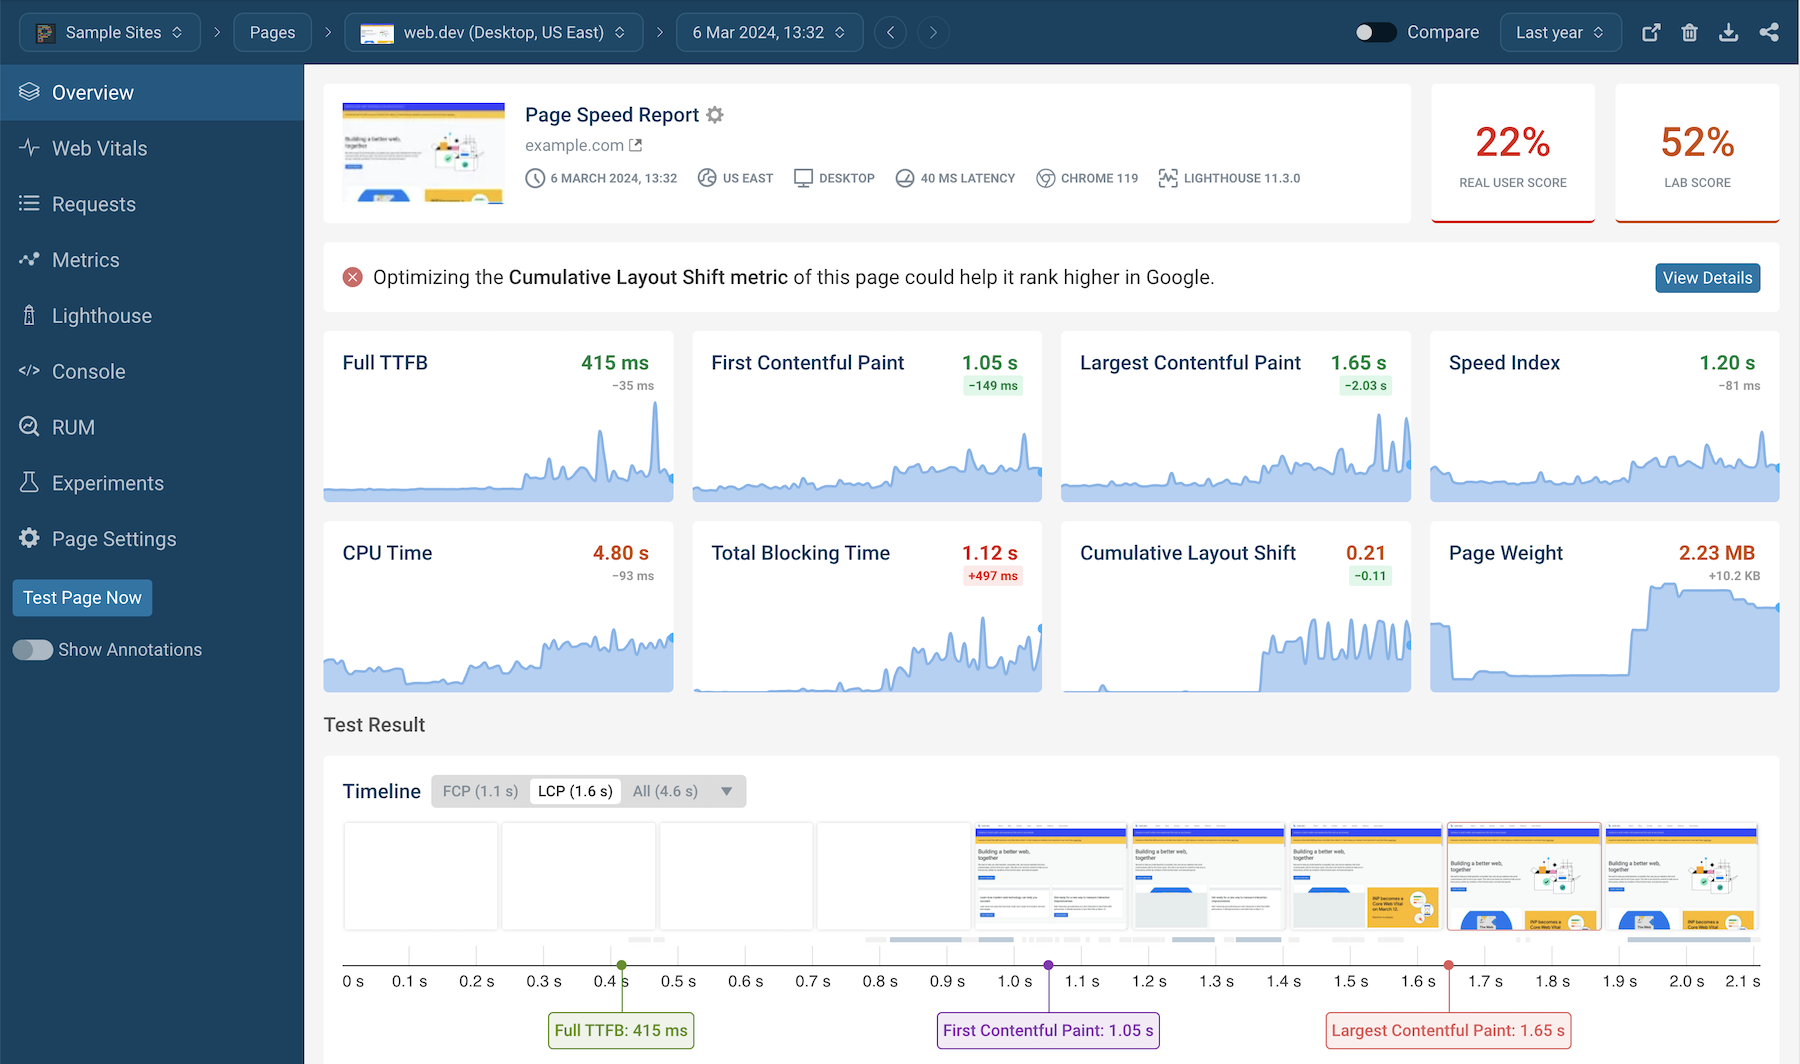
The following screenshot shows a website speed test (a lab test run in a controlled environment) within DebugBear.
Real User Monitoring (RUM)
Real User Monitoring (RUM) captures data from actual visitors to your website, this has a number of benefits:
- Learn from real-world user experiences: Find out how your site performs under real-world usage conditions, which factors in a diverse set of network speeds for example.
- Identify issues for certain user segments: Catch problems that may only affect users in specific locations, or issues that only present themselves when using certain devices.
- Connect usage patterns with business metrics: Correlate site speed with important metrics like conversion rates or bounce rates.
Examples of RUM tools:
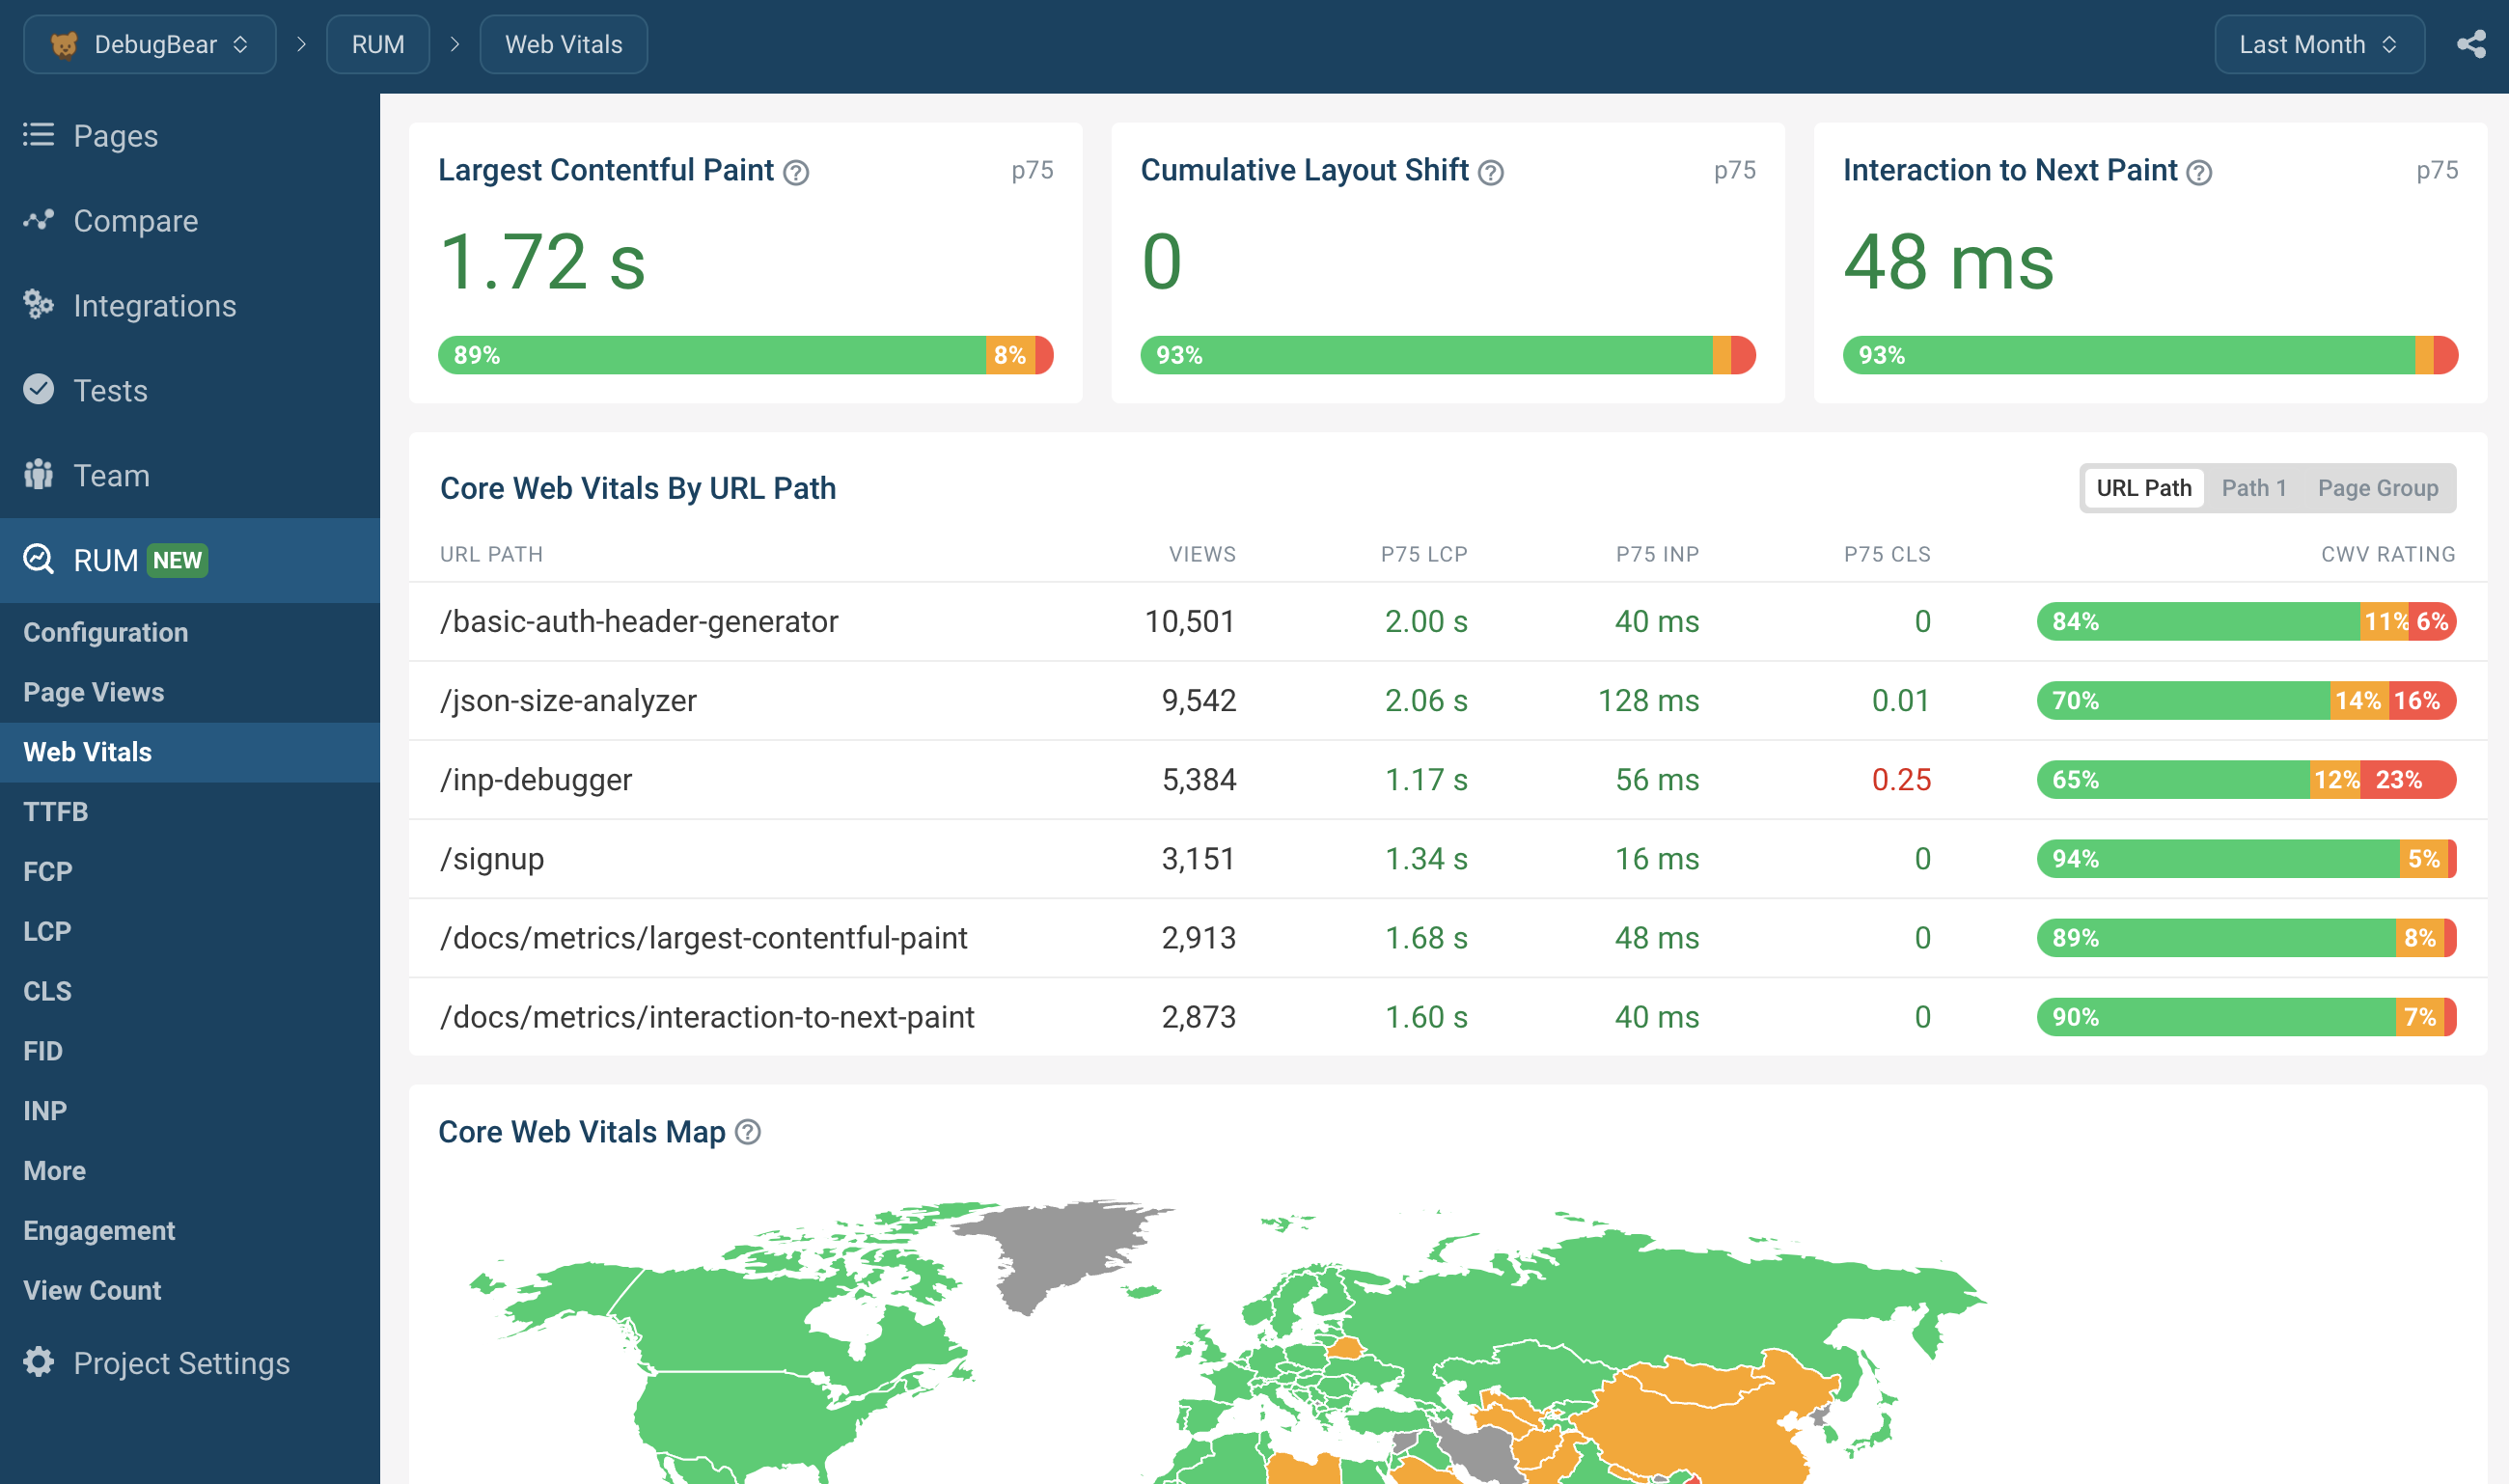
The following screenshot shows the Core Web Vitals dashboard in DebugBear.
Core Web Vitals
Core Web Vitals are a set of metrics that Google considers important in a webpage's overall user experience. These metrics can be monitored both through synthetic testing and real user data:
- Largest Contentful Paint (LCP): Measures how quickly the main content of a page becomes visible.
- Interaction to Next Paint (INP): Measures the latency of a user interaction, such as clicking a button.
- Cumulative Layout Shift (CLS): Measures the visual stability of a page.
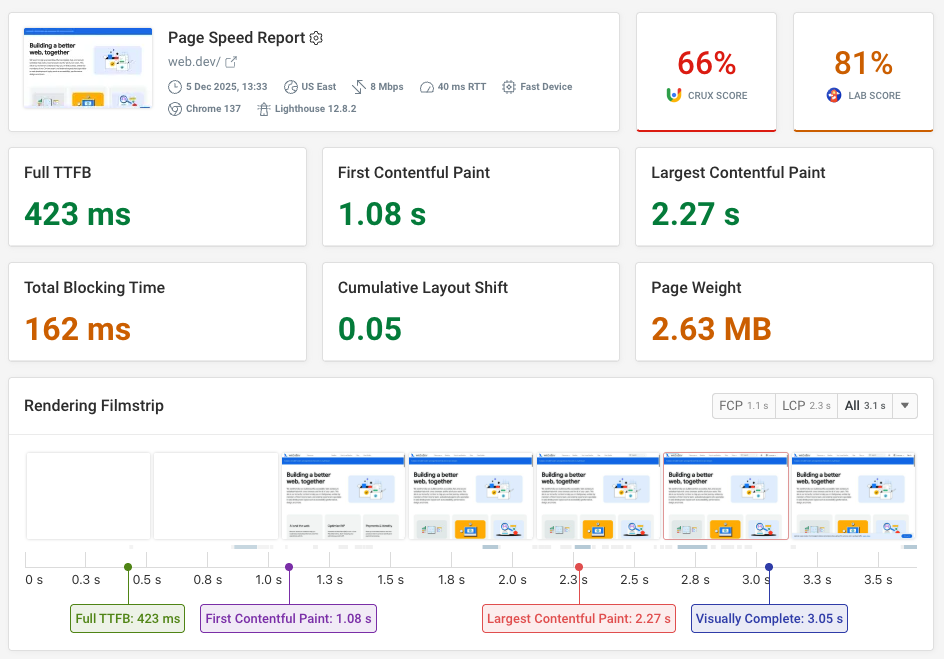
Monitoring Core Web Vitals helps your website meet Google's performance standards, and doing this can improve your search engine rankings and user experience.
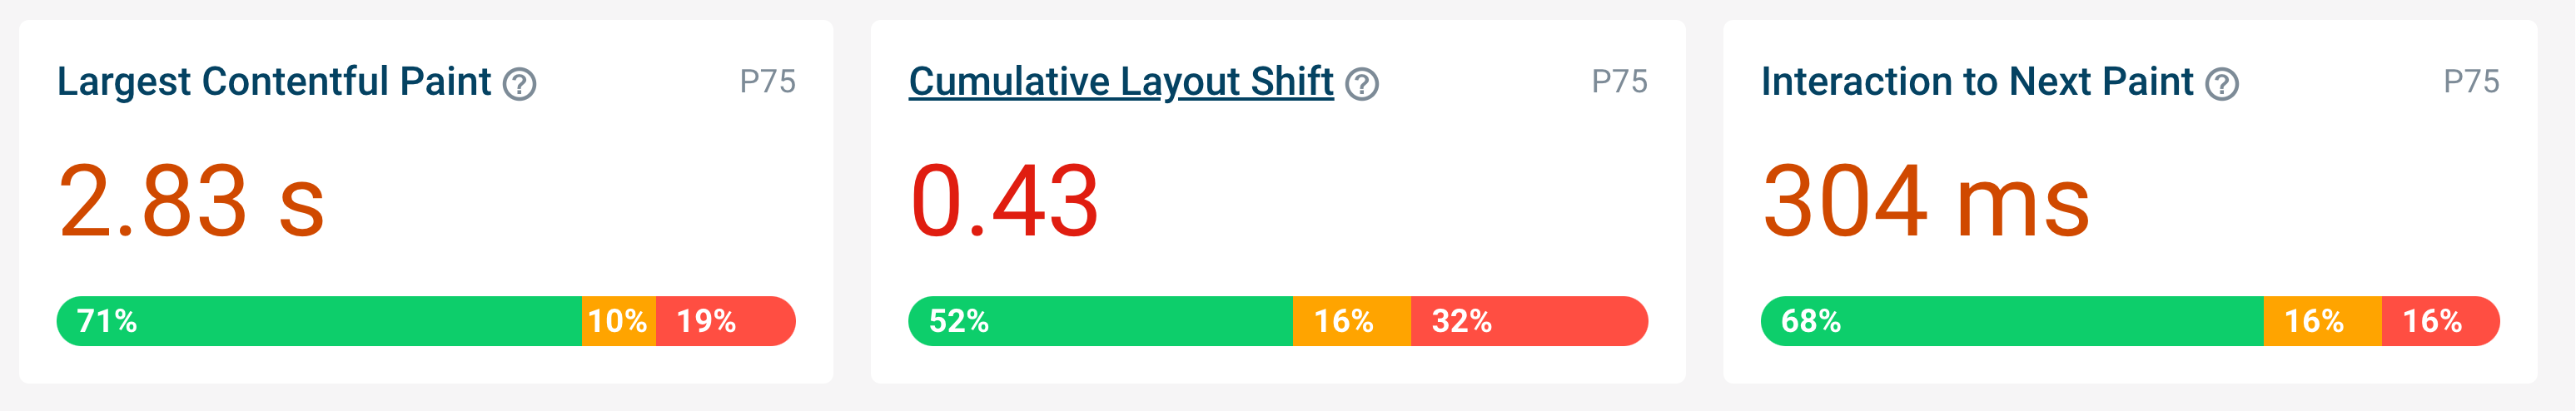
DebugBear gives you an easy to understand overview of your Core Web Vitals performance.
If you find that your Core Web Vitals metrics are poor, you can use DebugBear to identify the root cause of the issue.
The following screenshot shows how DebugBear can help you identify the part of the page identified as the Largest Contentful Paint (LCP) element.

CrUX Monitoring
The Chrome User Experience (CrUX) report is another way to monitor real user performance on your website.
Google collects CrUX data directly from Chrome users and publishes it for every website that meets certain minimum traffic thresholds. That means it's perfect for benchmarking your website against the competition.
CrUX data doesn't match RUM data 100%. Read this article on CrUX vs RUM to learn more.
Frontend monitoring
Frontend performance monitoring measures page speed in the browser. That means it considers all aspects of your website as they impact your visitors.
In contrast, backend application monitoring focuses on how fast code and database queries are on the servers in your data center.
Availability Monitoring
It can be a disappointing experience for users when they can't access your website, and downtime is expensive for your business. Availability monitoring helps you ensure your website is accessible to users at all times.
Uptime Monitoring
Uptime monitoring involves frequently checking if your website is accessible and responding to requests.
- Monitoring website availability from multiple locations: Ensures your site is accessible to users around the world.
- Checking for correct HTTP status codes: Validates that your server is responding correctly to network requests, rather than just returning a page with an error message.
- Validating the SSL certificate: Browsers now make it prominent when a site doesn't have a valid SSL certificate. Uptime monitoring can help you catch this issue before users do.
- Measuring response times: Tracks how quickly your server responds to requests.
While it's important to be fast, it's also important to be reliable. Examples of uptime monitoring tools:
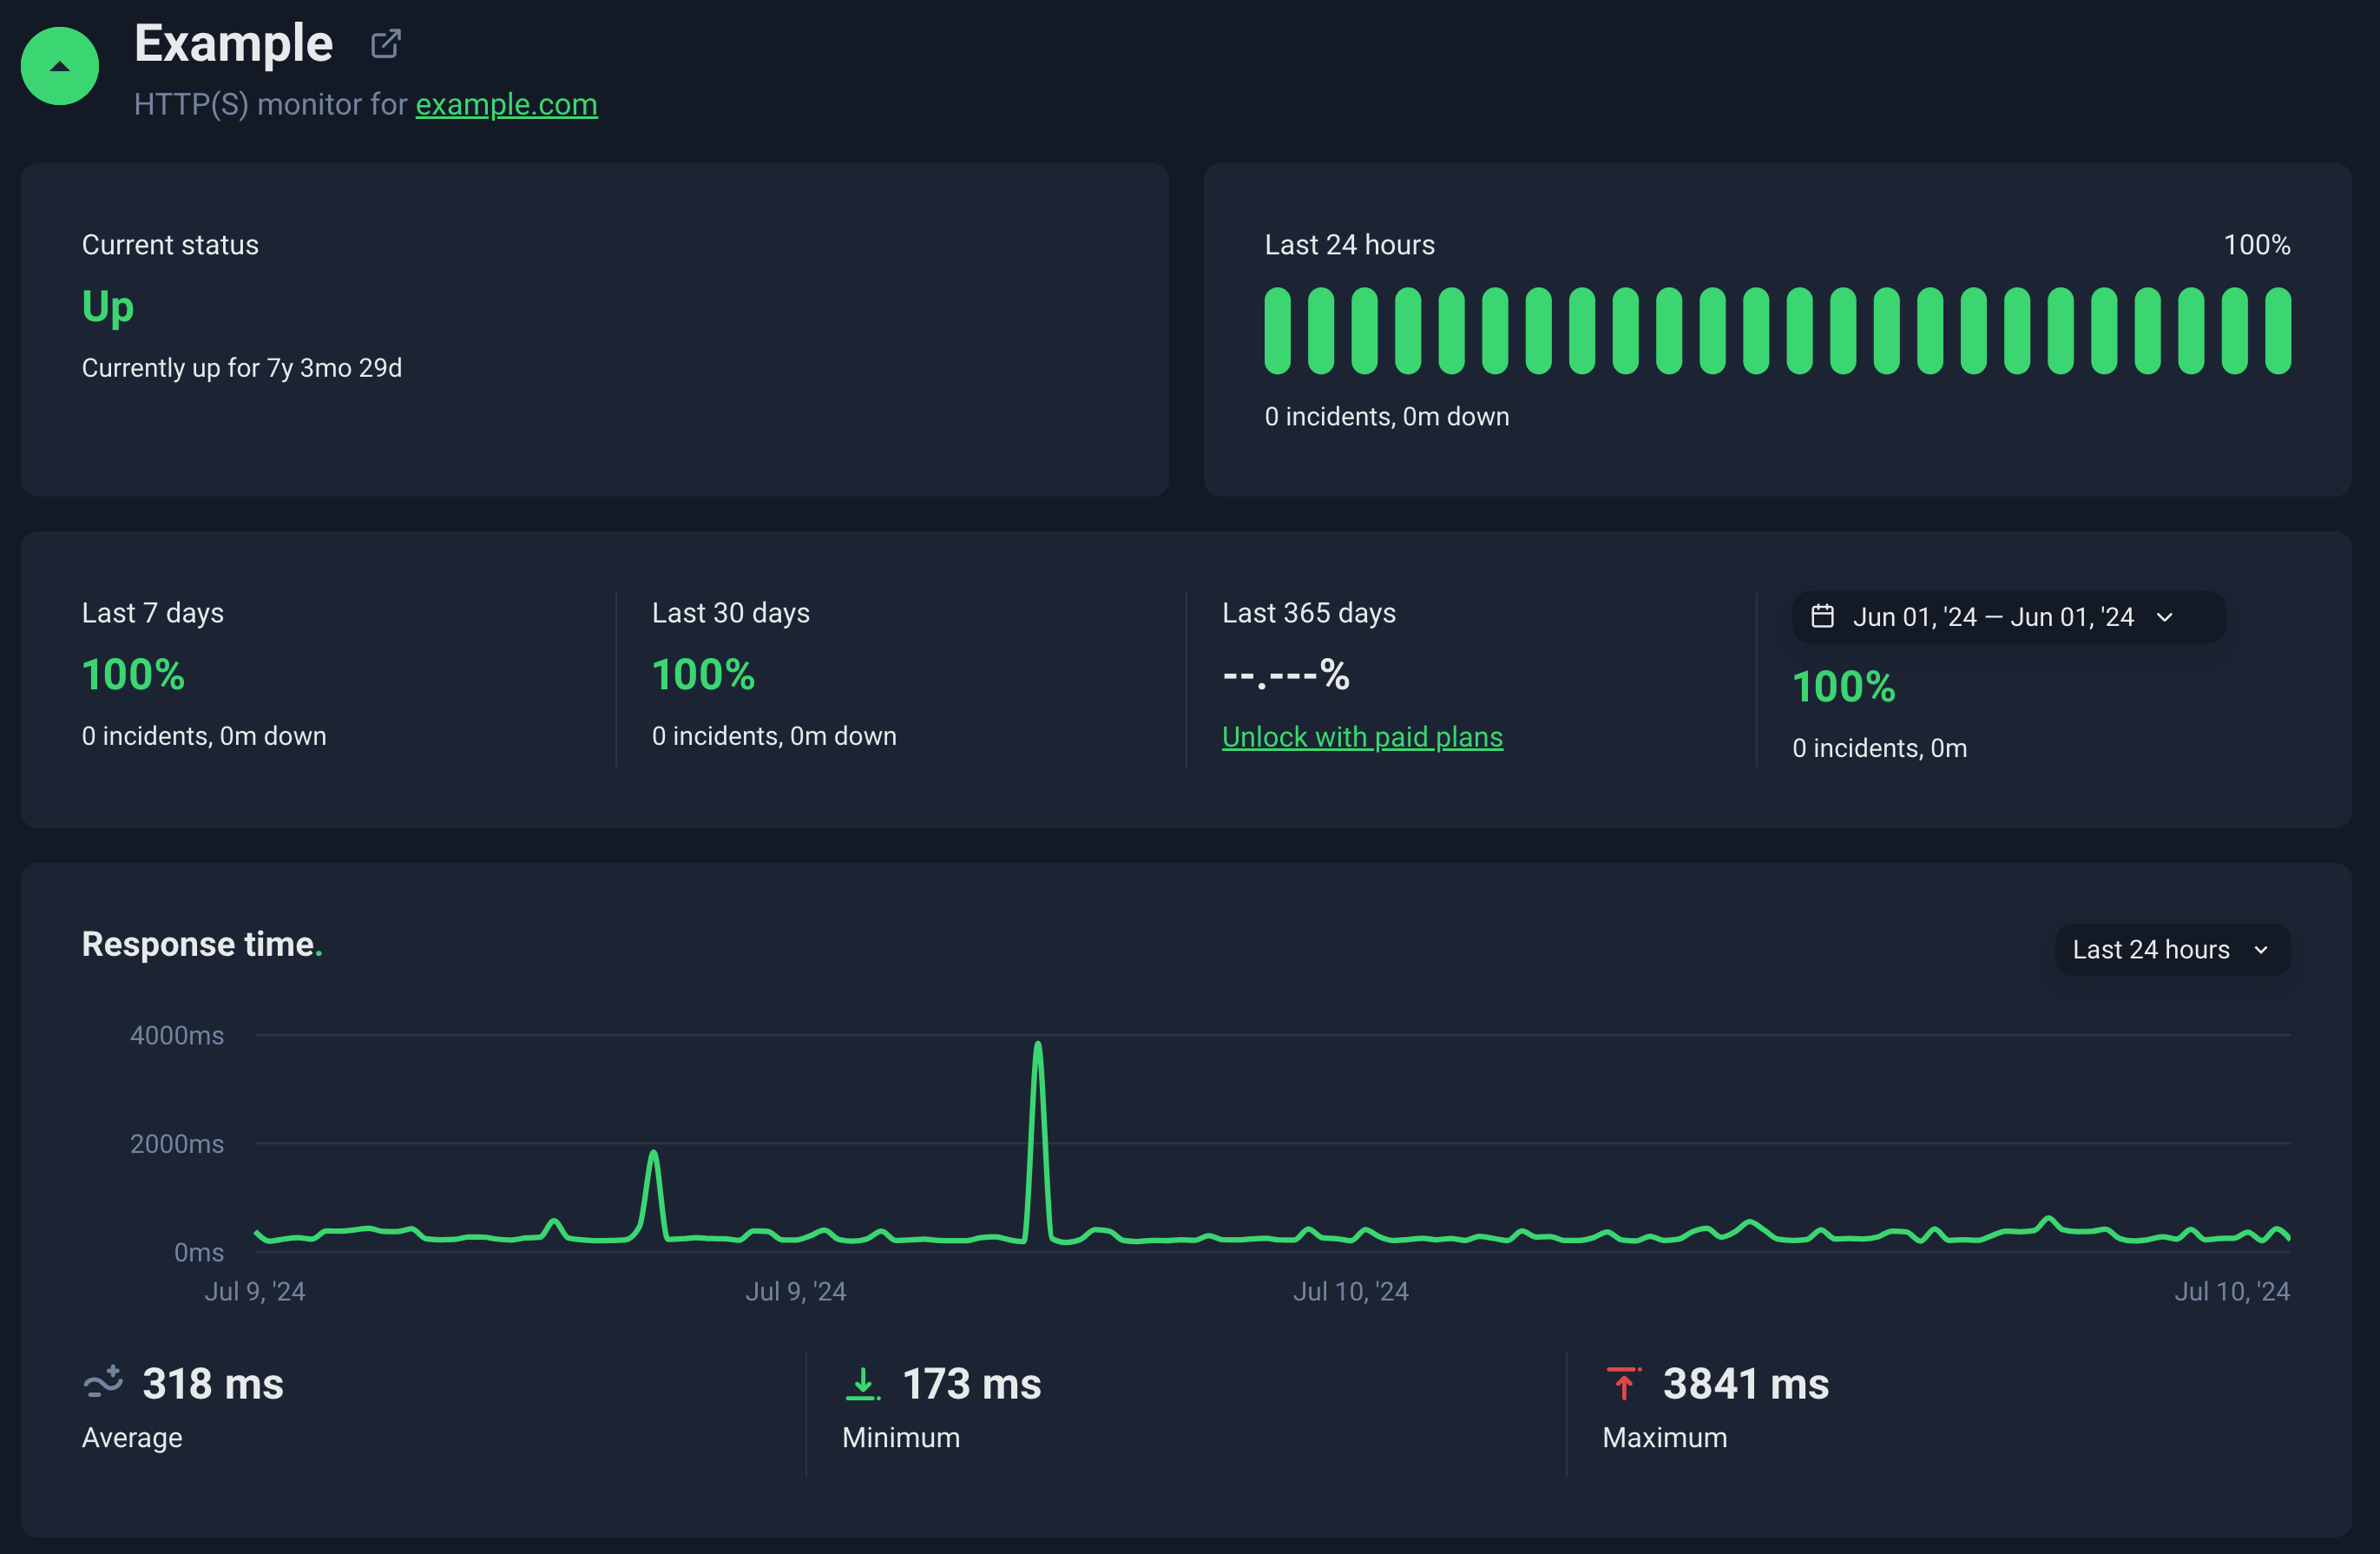
The following screenshot shows the uptime monitoring dashboard in UptimeRobot.
API Monitoring
Many websites use APIs, for example: A website might use its internal API to fetch data to display on a page. Other websites may offer APIs to their customers.
API monitoring allows you to:
- Validate API responses: Checks that responses are received for available API endpoints.
- Test the data returned by an API: Check the accuracy of data returned by an API.
- Check API response times: Tests how quickly your API responds to requests.
APIs can be especially important to monitor, as it's not always immediately obvious when they're not working.
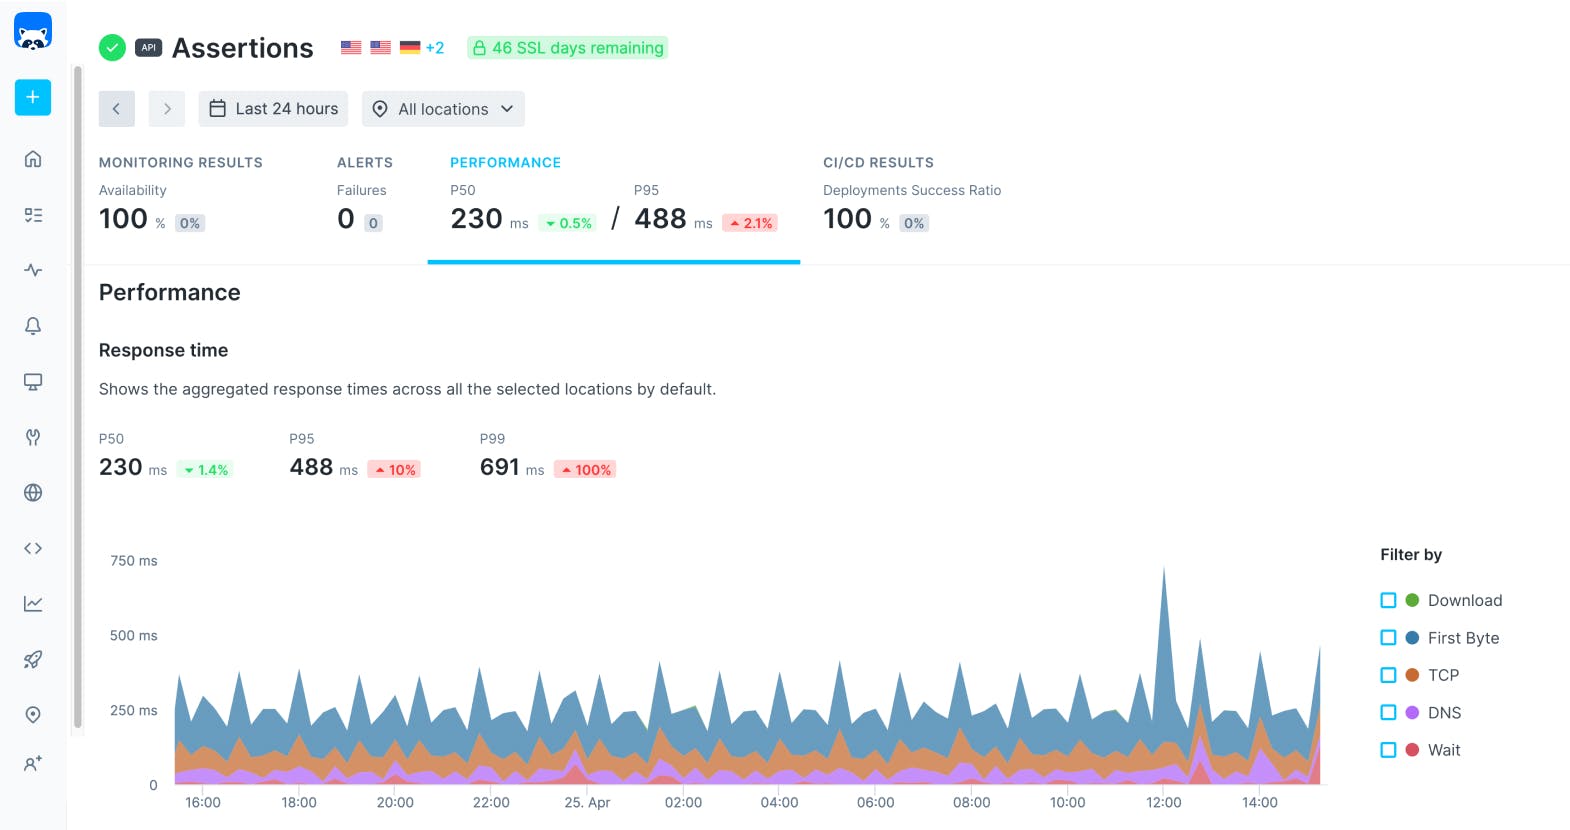
Examples of API monitoring tools:
The following screenshot shows a Checkly dashboard.
While a great oversimplification of how uptime monitoring works, you can think of it as similar to running a ping command.
If you open your terminal and run ping google.com, you should see a set of responses from Google's server. This is a hint that the Google server is up. Whether the website(s) hosted on that server is up or not is a different question!
User Experience Monitoring
Narrow quantitative metrics like "network response time" don't always capture the full user experience. User experience monitoring helps you understand how users interact with your website.
Transaction Monitoring
Transaction monitoring involves checking user flows on your website, such as:
- User sign-up: Verifies that new users can create accounts without issues.
- Login functionality: Verifies that existing users can log in as expected.
- Payment checkout: Monitors payment checkout flows to ensure users can complete the checkout process.
- Form submission: Confirm that users can submit forms without unexpected errors.
Your website might be fast, and certain metrics when measured in isolation might look good. However if users can't complete tasks as part of common user journeys, then that would be a problem.
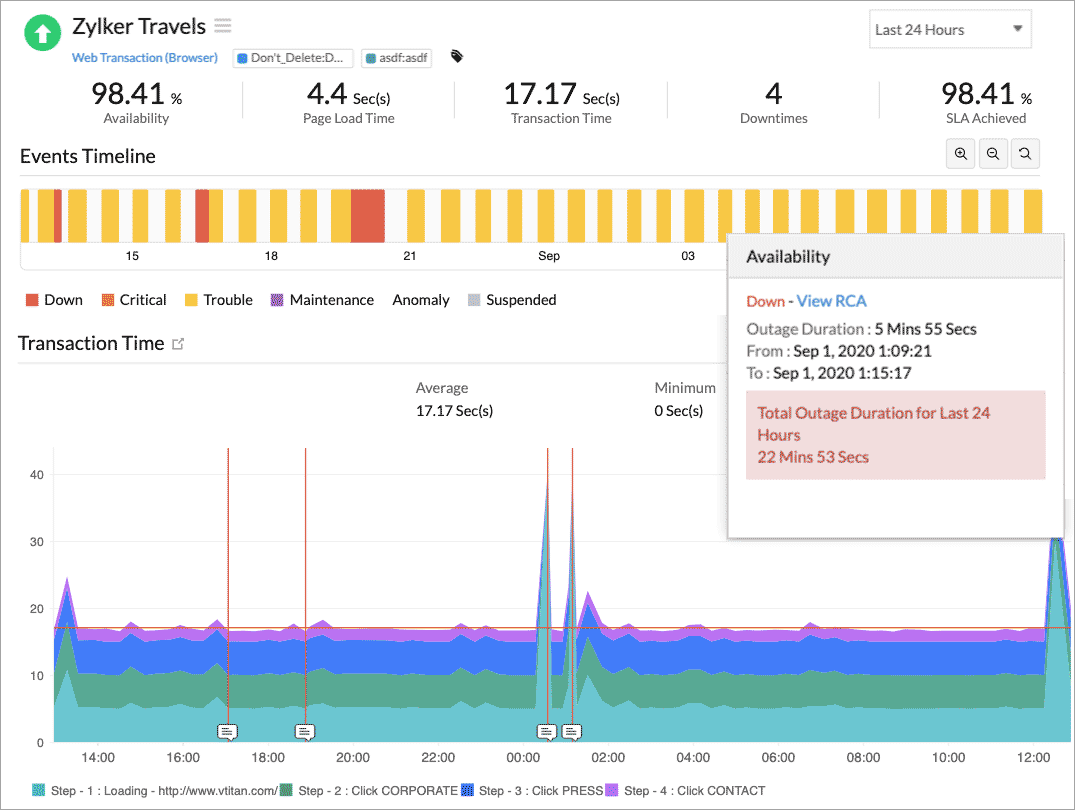
Examples of transaction monitoring tools:
The following screenshot shows a transaction monitoring dashboard in Site24x7.
End User Monitoring
End user monitoring focuses on the experience of individual users on your website. This can include:
- Session replays: Lets you playback and visualize user journeys.
- Error tracking: Helps identify web application errors and exceptions that may be breaking functionality for users.
- User behavior analytics: Provides interesting insights into how users interact with your site.
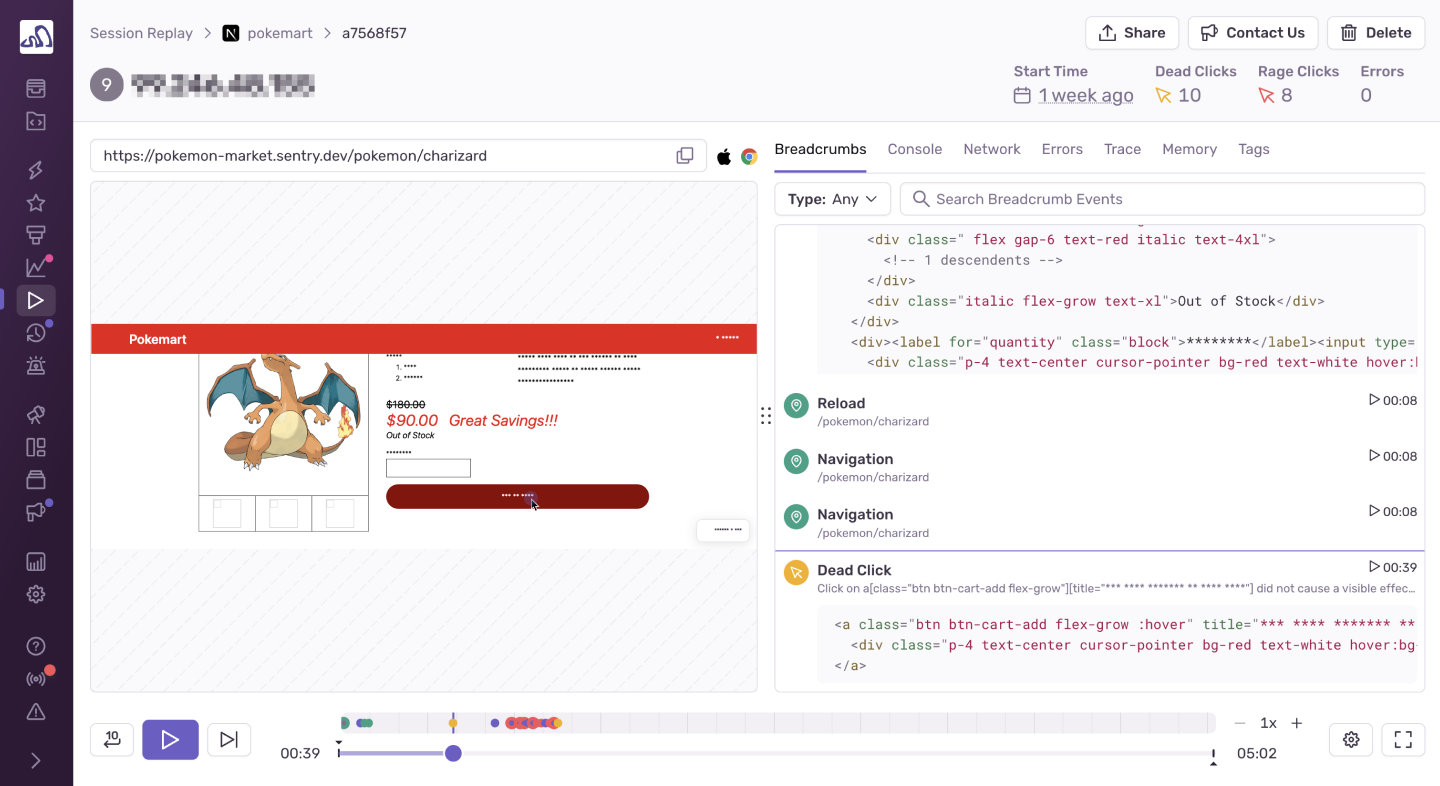
Examples of end user monitoring tools:
The following screenshot shows a session replay in Sentry.
Server-Side Monitoring
Many monitoring solutions focus on the client-side experience. It's also important to consider server-side monitoring to help ensure your website backend is working as expected.
Resource Utilization Monitoring
Monitoring server resources helps you understand how your server is performing, especially under heavy load. Metrics to track include:
- CPU usage: Check if your server struggles under high load. This can result in slow response times.
- Memory usage: Helps confirm if your web applications have enough memory available to them. This can help prevent crashes and slowdowns.
- Disk usage: Monitors how quickly your server can read and write data. This is especially important for database-heavy applications.
- Network performance: Tracks connections between your server and clients, but also between your server and other services. This can help identify network bottlenecks.
The number of visitors to your website will not always be constant. Understanding how your server behaves under different loads can help you prepare for traffic spikes.
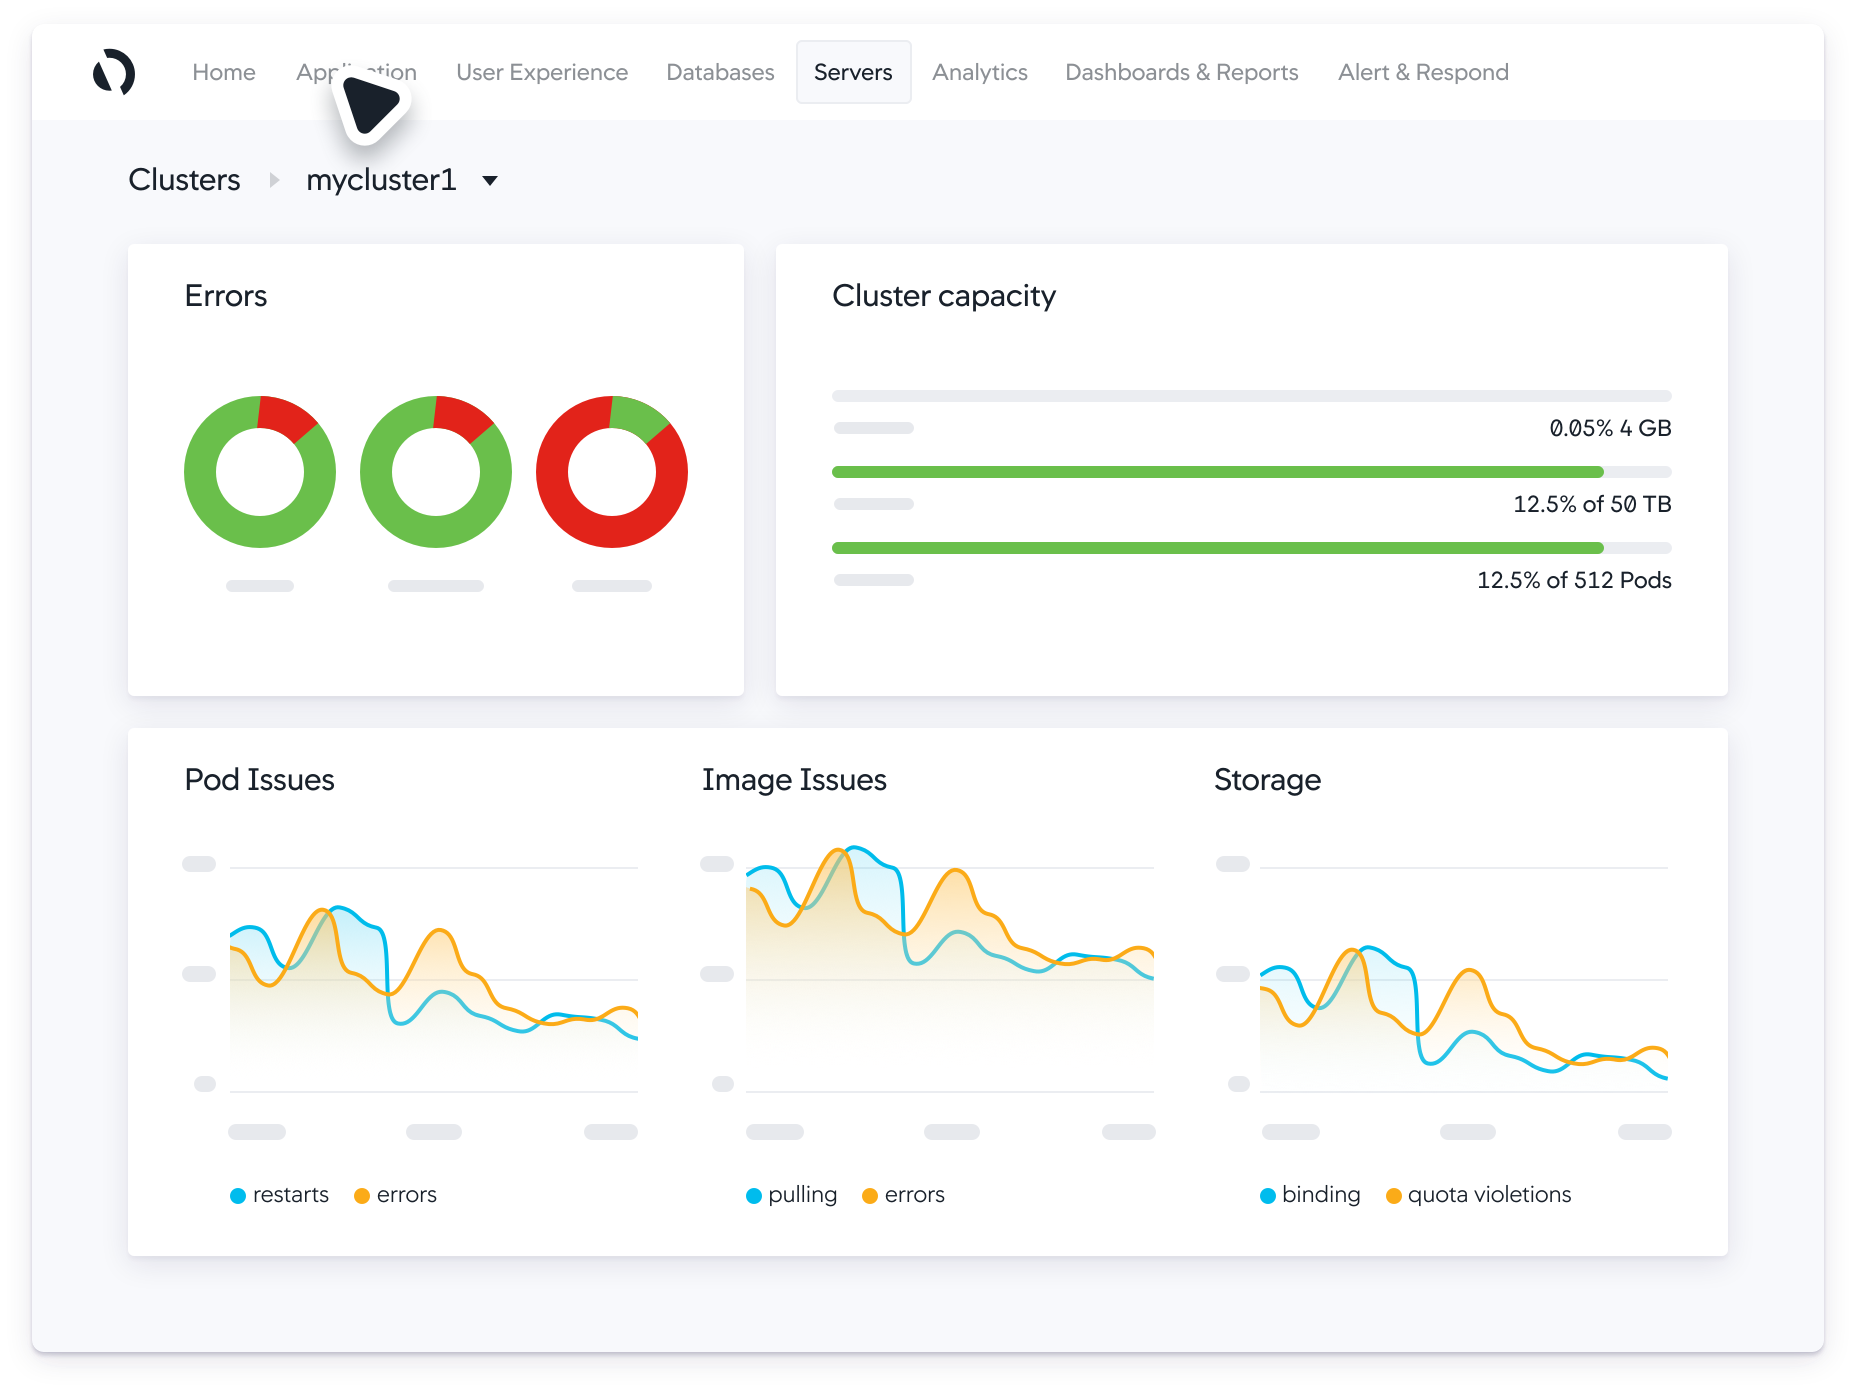
Examples of resource utilization monitoring tools:
The following screenshot shows the AppDynamics dashboard.
Application Performance Monitoring (APM)
APM tools provide insights into the performance of your server-side applications. This includes:
- Database query performance: Identify slow database queries that your web application relies on.
- Application errors and exceptions: Alerts you to unexpected crashes or errors in your web application.
- Request tracing: Lets you follow a request through your system, so you can track where time is being spent and where errors are occurring.
- Code profiling: Provides insights into code-level metrics, such as how long functions take to execute.
Note that APM has some overlap with other monitoring types covered in this post.
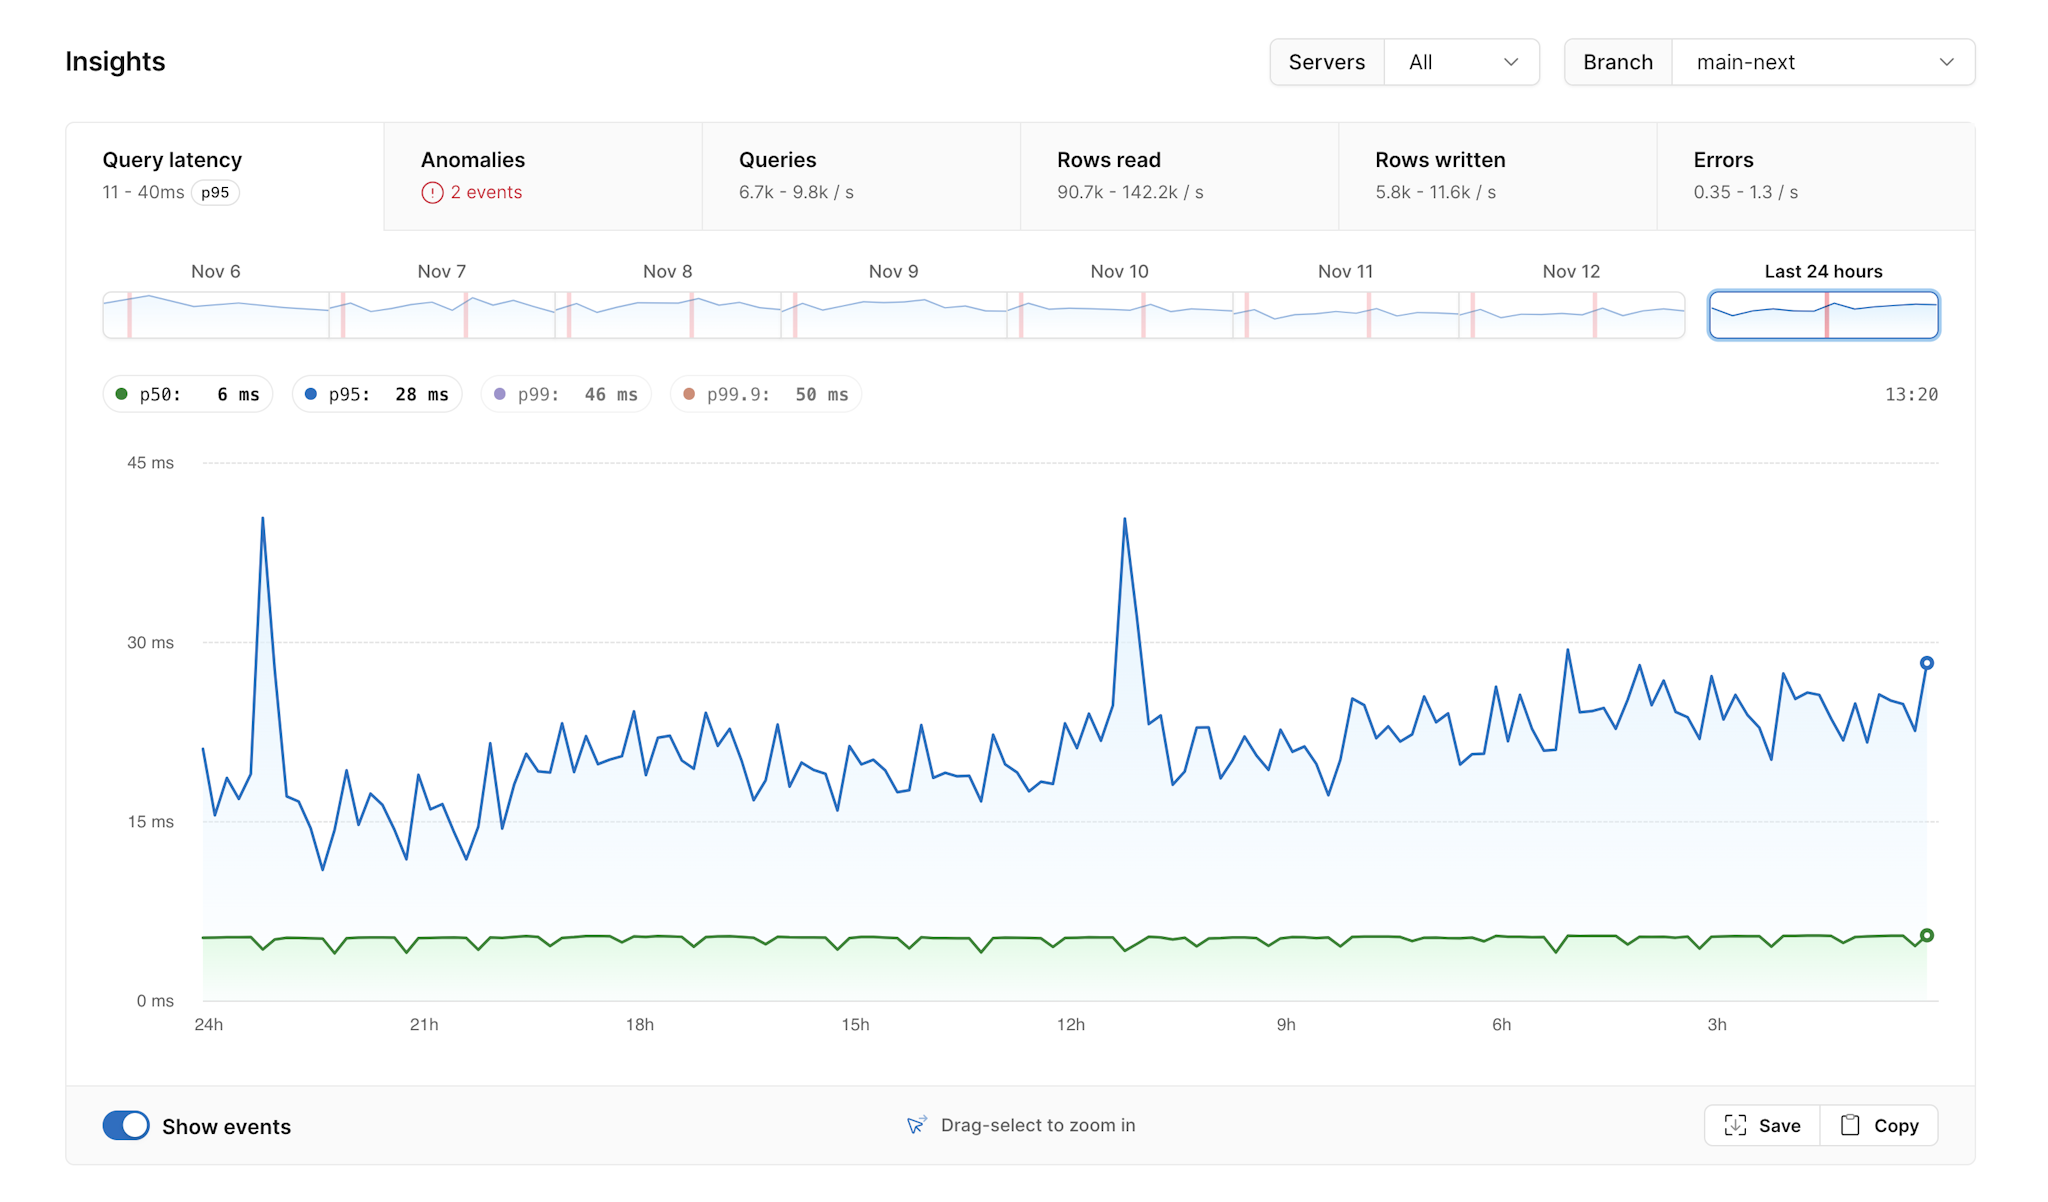
Examples of APM tools:
The following screenshot shows the "Query Insights" feature within PlanetScale - a database platform.
Apply a monitoring strategy
A good monitoring strategy uses a variety of monitoring types to capture performance and availability data of your website.
- Use both synthetic and real user monitoring for a complete performance picture.
- Use transaction monitoring for important user flows.
- Use server and infrastructure monitoring to ensure your backend is working as expected.
- Review monitoring data regularly to find areas for improvement.
For more information on how to implement effective website monitoring, check out our website performance monitoring solutions and start optimizing your online presence today.
Challenge Your Understanding
Test your knowledge by matching the correct monitoring type to each scenario. For each question, choose from one of the following options:
- Synthetic Monitoring
- Real User Monitoring (RUM)
- Uptime Monitoring
The answers are provided at the end of this post.
-
Checking Website Availability Across Regions
Your website performs well when accessible, but you've received reports of the site being unreachable from certain countries. You need to verify if the site is consistently available in different regions.
Which type of monitoring would be useful in this scenario?
-
Checking New Feature Performance Before Launch
You're launching a new website feature. Before the public launch, you want to make sure that the new features work well across different devices and browsers.
Which monitoring approach would be most suitable for pre-launch testing?
-
Understanding Performance Impact on User Behavior
Your marketing team is having issues with conversion rates. They want to better understand user journeys, and how performance issues could be impacting user behavior.
Which type of monitoring can help identify problems in this scenario?
Answers:
-
Uptime Monitoring
Uptime monitoring lets you regularly check your website's availability from different geographic locations.
-
Synthetic Monitoring
Synthetic monitoring allows you to simulate user interactions with your new website features.
-
Real User Monitoring (RUM)
RUM collects performance data from actual user sessions, helping you to correlate website performance metrics with user behavior.
DebugBear offers both scheduled lab tests and real user monitoring solutions for your website. Don't wait for your users to report issues, start monitoring your website today!
Run A Free Page Speed Test
Test Your Website:
- Automated Recommendations
- Detailed Request Waterfall
- Web Vitals Assessment