
Interaction to Next Paint (INP) is a Core Web Vital metric that impacts Google search rankings. As web developers and website owners work to optimize their sites, some misconceptions about INP emerge.
This post addresses such misconceptions, and provides clear guidance on how INP works.
Are there misconceptions about INP?
INP is well documented. For some common user interactions, especially when you're testing locally, it's generally straightforward to understand how INP works: You click the 'add to cart' button, and the cart updates with a new product. The time between your click and the cart update is the INP.
However our Real User Monitoring customers would often find results that didn't align with their expectations.
- Why is INP so high for a seemingly simple interaction? It runs smoothly on my local machine.
- Why is this slow INP score showing that the user clicked on a paragraph element? It doesn't have any event listeners attached to it!
- I've profiled all my website code and it's optimized, and even runs well on low-end devices. Why is INP still high?
These are some of the questions that we set out to answer in this post.
Misconception 1: Visual Updates Are Required for INP
Some assume that INP waits for the visual update that follows an interaction. While a visual update does often follow an interaction, it's not a requirement for INP measurement.
In the following diagram, both scenarios involve user interactions, but only one scenario results in a visual update. Both scenarios trigger INP.
The Truth About INP and Visual Updates
Contrary to the "next paint" in its name, INP doesn't require visual updates to measure interaction delays.
INP measures the time between a user interaction and the next frame render, regardless of visual changes. It's more about rendering opportunities, rather than visual UI changes.
You can play around with this Interaction to Next Paint playground and learn more about what interactions can trigger INP. For example, you can click/tap on the header and notice an INP score is still reported, even though no visual update is needed in response to the click/tap interaction.
How to fix slow INP scores where there's no expected visual update
If you're getting slow INP scores for interactions that don't require visual updates, you likely have slow main thread tasks that are blocking the next frame render. In this case, you should work towards the recommendations listed in total blocking time to improve INP scores:
- Record a DevTools Performance profile to identify what main thread activity is happening during the user interaction.
- Focus on optimizing the main thread work that's causing the delay. This could involve breaking up long-running tasks, or moving client side work to the server.
While this could be a whole other misconception in itself, note that this post intentionally uses terms like "main thread work" rather than just "JavaScript work" to emphasize that INP is affected by all main thread tasks, not just JavaScript. In fact, you can get slow INP scores from interactivity without JavaScript.
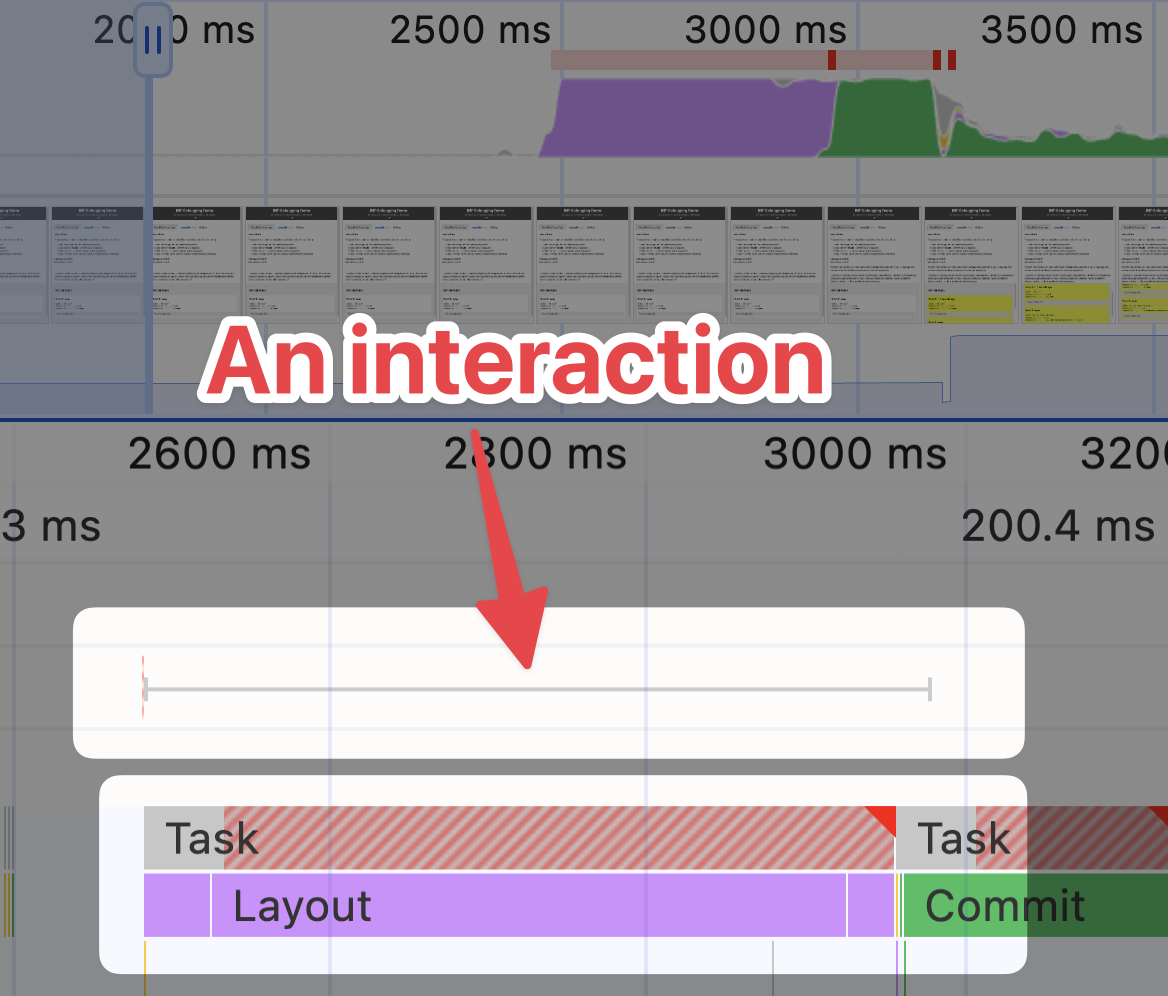
The following screenshot shows heavy rendering activity from a user interaction, however no JavaScript is involved:
Misconception 2: Only Interactive Elements Affect INP
A common belief is that INP only applies to elements with event listeners, or elements that have visible responses to interactions.
For example, it's understandable to think how a button click or form submission could affect INP, but what about a click on a static paragraph element?
The Reality of INP and Page Elements
Any element on your page can influence INP scores, including seemingly inert elements like paragraphs. Background tasks and overall page performance play a big role in INP, regardless of the element interacted with.
For instance, clicking on a <p> tag without any attached event listeners can still result in poor INP if there is still a lot of main thread work happening on the page.
<p>
  This paragraph has no event listeners, but clicking it can still affect INP.
</p>

<script>
  // Long-running task that can affect the INP score
  function longRunningTask() {
    for (let i = 0; i < 1000000; i++) {
      // Simulating heavy computation
    }
  }

  setInterval(longRunningTask, 100);
</script>
You may be wondering: why might a user click on a static paragraph? This is a common question we get from our Real User Monitoring customers. Users can interact with a page in unexpected ways. In the context of an inert paragraph, consider the following scenarios:
- A user accidentally taps on the paragraph while scrolling.
- A user performs a long-press on a word within a paragraph, expecting a context menu.
- A user performs a long-press on the paragraph to form a text selection, so they can copy the content.
- A user taps on the paragraph to test if the page is responsive.
- A user happens to click on the paragraph so that the page gains focus and they begin tabbing through the page.
The takeaway here is that any part of a page can impact INP, not just interactive elements.
How to fix slow INP scores for non-interactive elements
The fixes here involve similar fixes to improve general page performance:
- Minimize main thread work to ensure the browser can handle user interactions smoothly.
- Optimize recurring tasks, for example those through
setIntervalorsetTimeout, as their execution may coincide with user interactions which can affect INP. - Use requestIdleCallback to schedule non-essential tasks during idle periods, rather than during user interactions.
Misconception 3: Only Your Own Website Code Impacts INP
It's easy to assume that your own website code is the sole factor in INP performance. Surely the battery life and device temperature of the user's device can't affect INP, right?
In reality, INP can be affected by battery life, device performance and much more.
Your website code might be very performant, but if your user's device is thermal throttling because it's overheating, and maybe couple that with a low battery, then the INP score could be impacted as the operating system tries to conserve power, which can slow down the device.
Not all examples have to be aligned with extremes, or edge cases. Here are some common external factors that can impact INP:
Third-Party Scripts can affect INP
External scripts can introduce delays that impact INP, even if they're not directly related to user interactions.
Some external scripts can attach event listeners to all elements on the page - for tracking purposes.
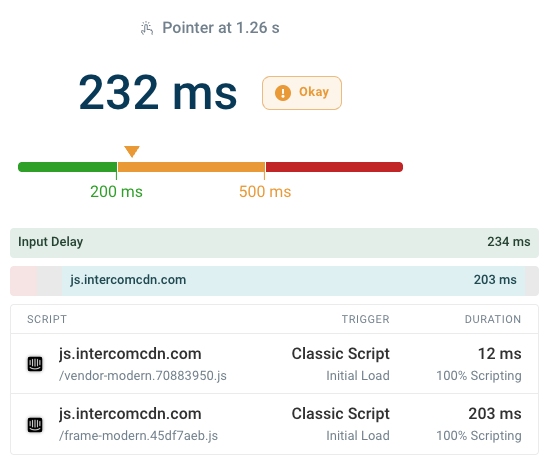
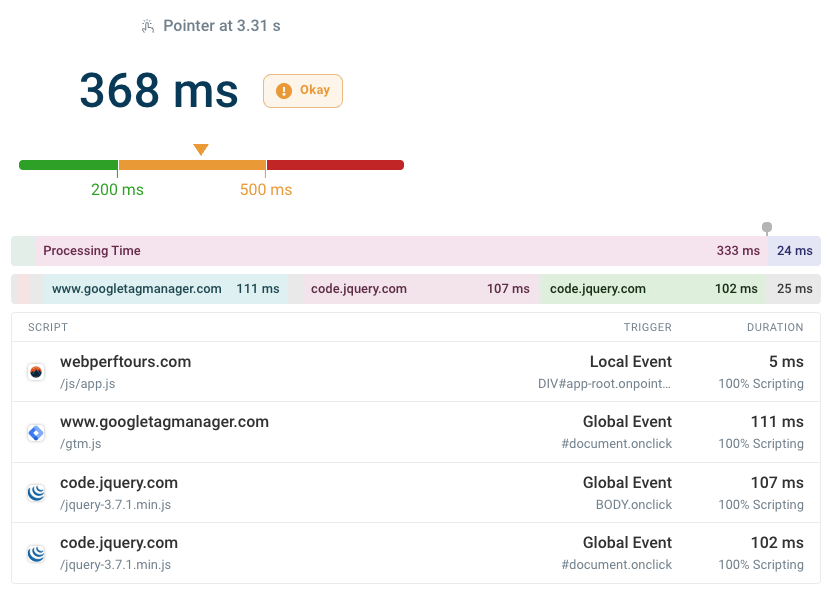
Interactions while third-parties are in the process of loading can also be slow. Here the script attribution data in DebugBear shows that Intercom is initializing. The entire INP delay consists of input delay rather than time spent handling the actual interaction.
Browser Extensions can affect INP
Browser extensions can interfere with your website's performance, and note that browser extensions are not just reserved for power users.
Sometimes institutions like schools provide access to devices with extensions already installed. These extensions can inject significant amounts of JavaScript into every page, where the JavaScript performs some kind of monitoring or safety check on the content within the page.
Operating System Processes can affect INP
As mentioned previously, an operating system can limit or throttle resources it makes available to the browser, to conserve power. This can increase the time it takes for usual main thread tasks to complete, thus affecting INP.
Device Hardware Limitations can affect INP
On a similar note to the previous point, the hardware of the device can also impact INP. Older devices with slower processors or less memory can struggle to keep up with the demands of modern websites, leading to poor INP scores.
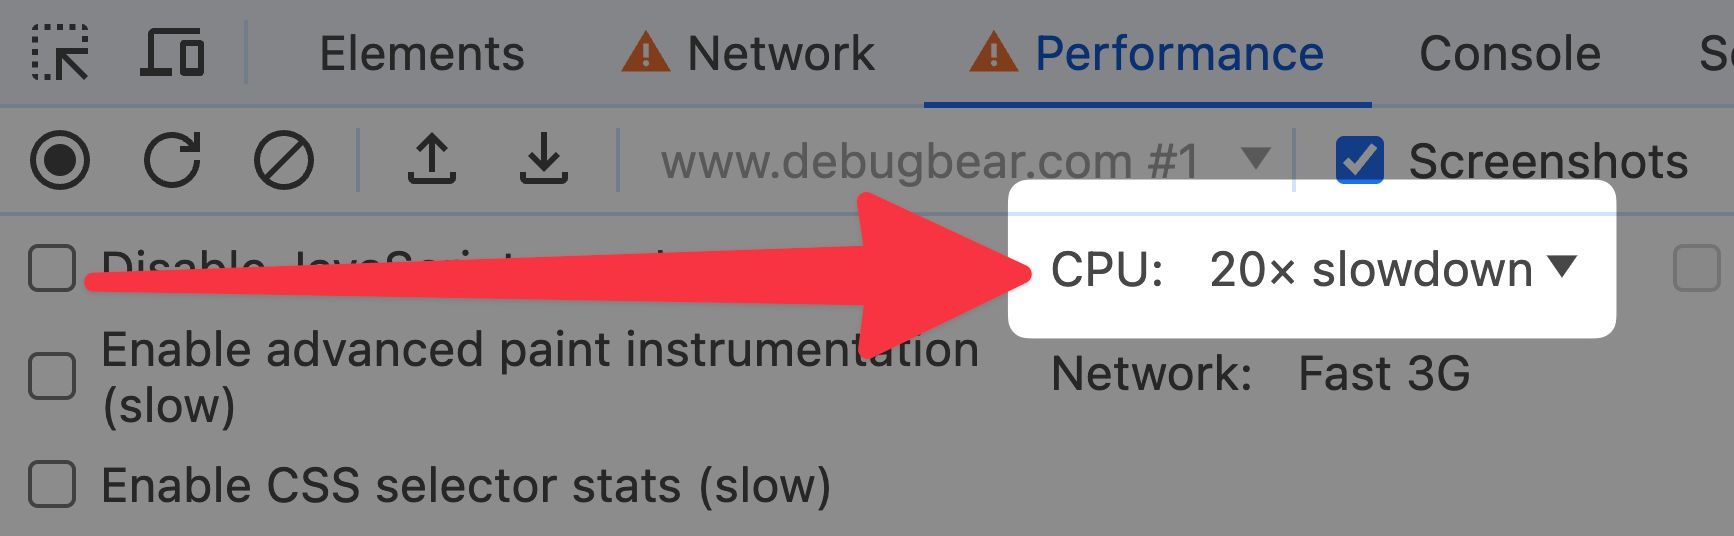
In fact, some browsers like Chrome and Edge let you throttle the CPU to simulate lower-end devices.
Optimizing INP scores for third-party code issues
You have little control over external factors like device performance, battery life, and browser extensions. However, you do have influence over the third-party code you include on your website.
Make sure that the third-party code you include is necessary and optimized.
Misconception 4: INP Represents Typical Interaction Delay
Many believe that INP reflects the average or typical delay users experience when interacting with a page.
When Google stores INP data from your page visits, it's not calculating the average interaction delay to determine your score.
Understanding INP's Focus on Poor Experiences
INP is calculated in a more nuanced way than simply averaging all interaction delays. Here's a breakdown of how it works:
-
Per-page view basis: INP is calculated separately for each visit. Each time a user loads your page, INP looks at all the interactions (a user clicks a button, a user fills in a form, etc.) that occur during that session.
-
Focusing on the worst experiences: For each page view, INP typically focuses on the slowest interaction delay. However, for sites with many interactions, one highest interaction for every 50 interactions is excluded - this is to prevent outliers from skewing the score.
-
Percentile-based reporting: When looking at INP across many page views (e.g., in tools like the Chrome User Experience Report), INP is typically reported at the 75th percentile. This means that the reported INP score represents a value that 75% of page views were at or below.
-
Impact on score: Even if most of your interactions are fast, a few consistently slow interactions can result in a poor overall INP score.
Misconception 5: INP only gets measured once the page is fully loaded
Your users can only interact with your 'add to cart' button once the page is fully loaded, right? And when you're using a heavy JavaScript framework to hydrate your page, the INP measurement only starts once the 'new DOM' has been created, right?
Not quite.
INP can be measured before the page is fully loaded
This is another case where Real User Monitoring shines. We scripted synthetic lab tests that simulate user interactions (after waiting for the page to fully load), and found many websites had excellent INP scores. However those exact same websites had poor INP scores in our Real User Monitoring dashboards.
It wasn't because of the device or network conditions being slower in the real world!
DebugBear uses network throttling to simulate real-world conditions in synthetic lab tests.
In the real world, users interact with your page both during and after the page is loading. During page load the browser may be doing any combination of:
- Downloading resources
- Parsing HTML, CSS, and JavaScript
- Executing JavaScript
- Rendering the page
You can try out this page load simulator to see how user interactions can be affected during the page load phase.
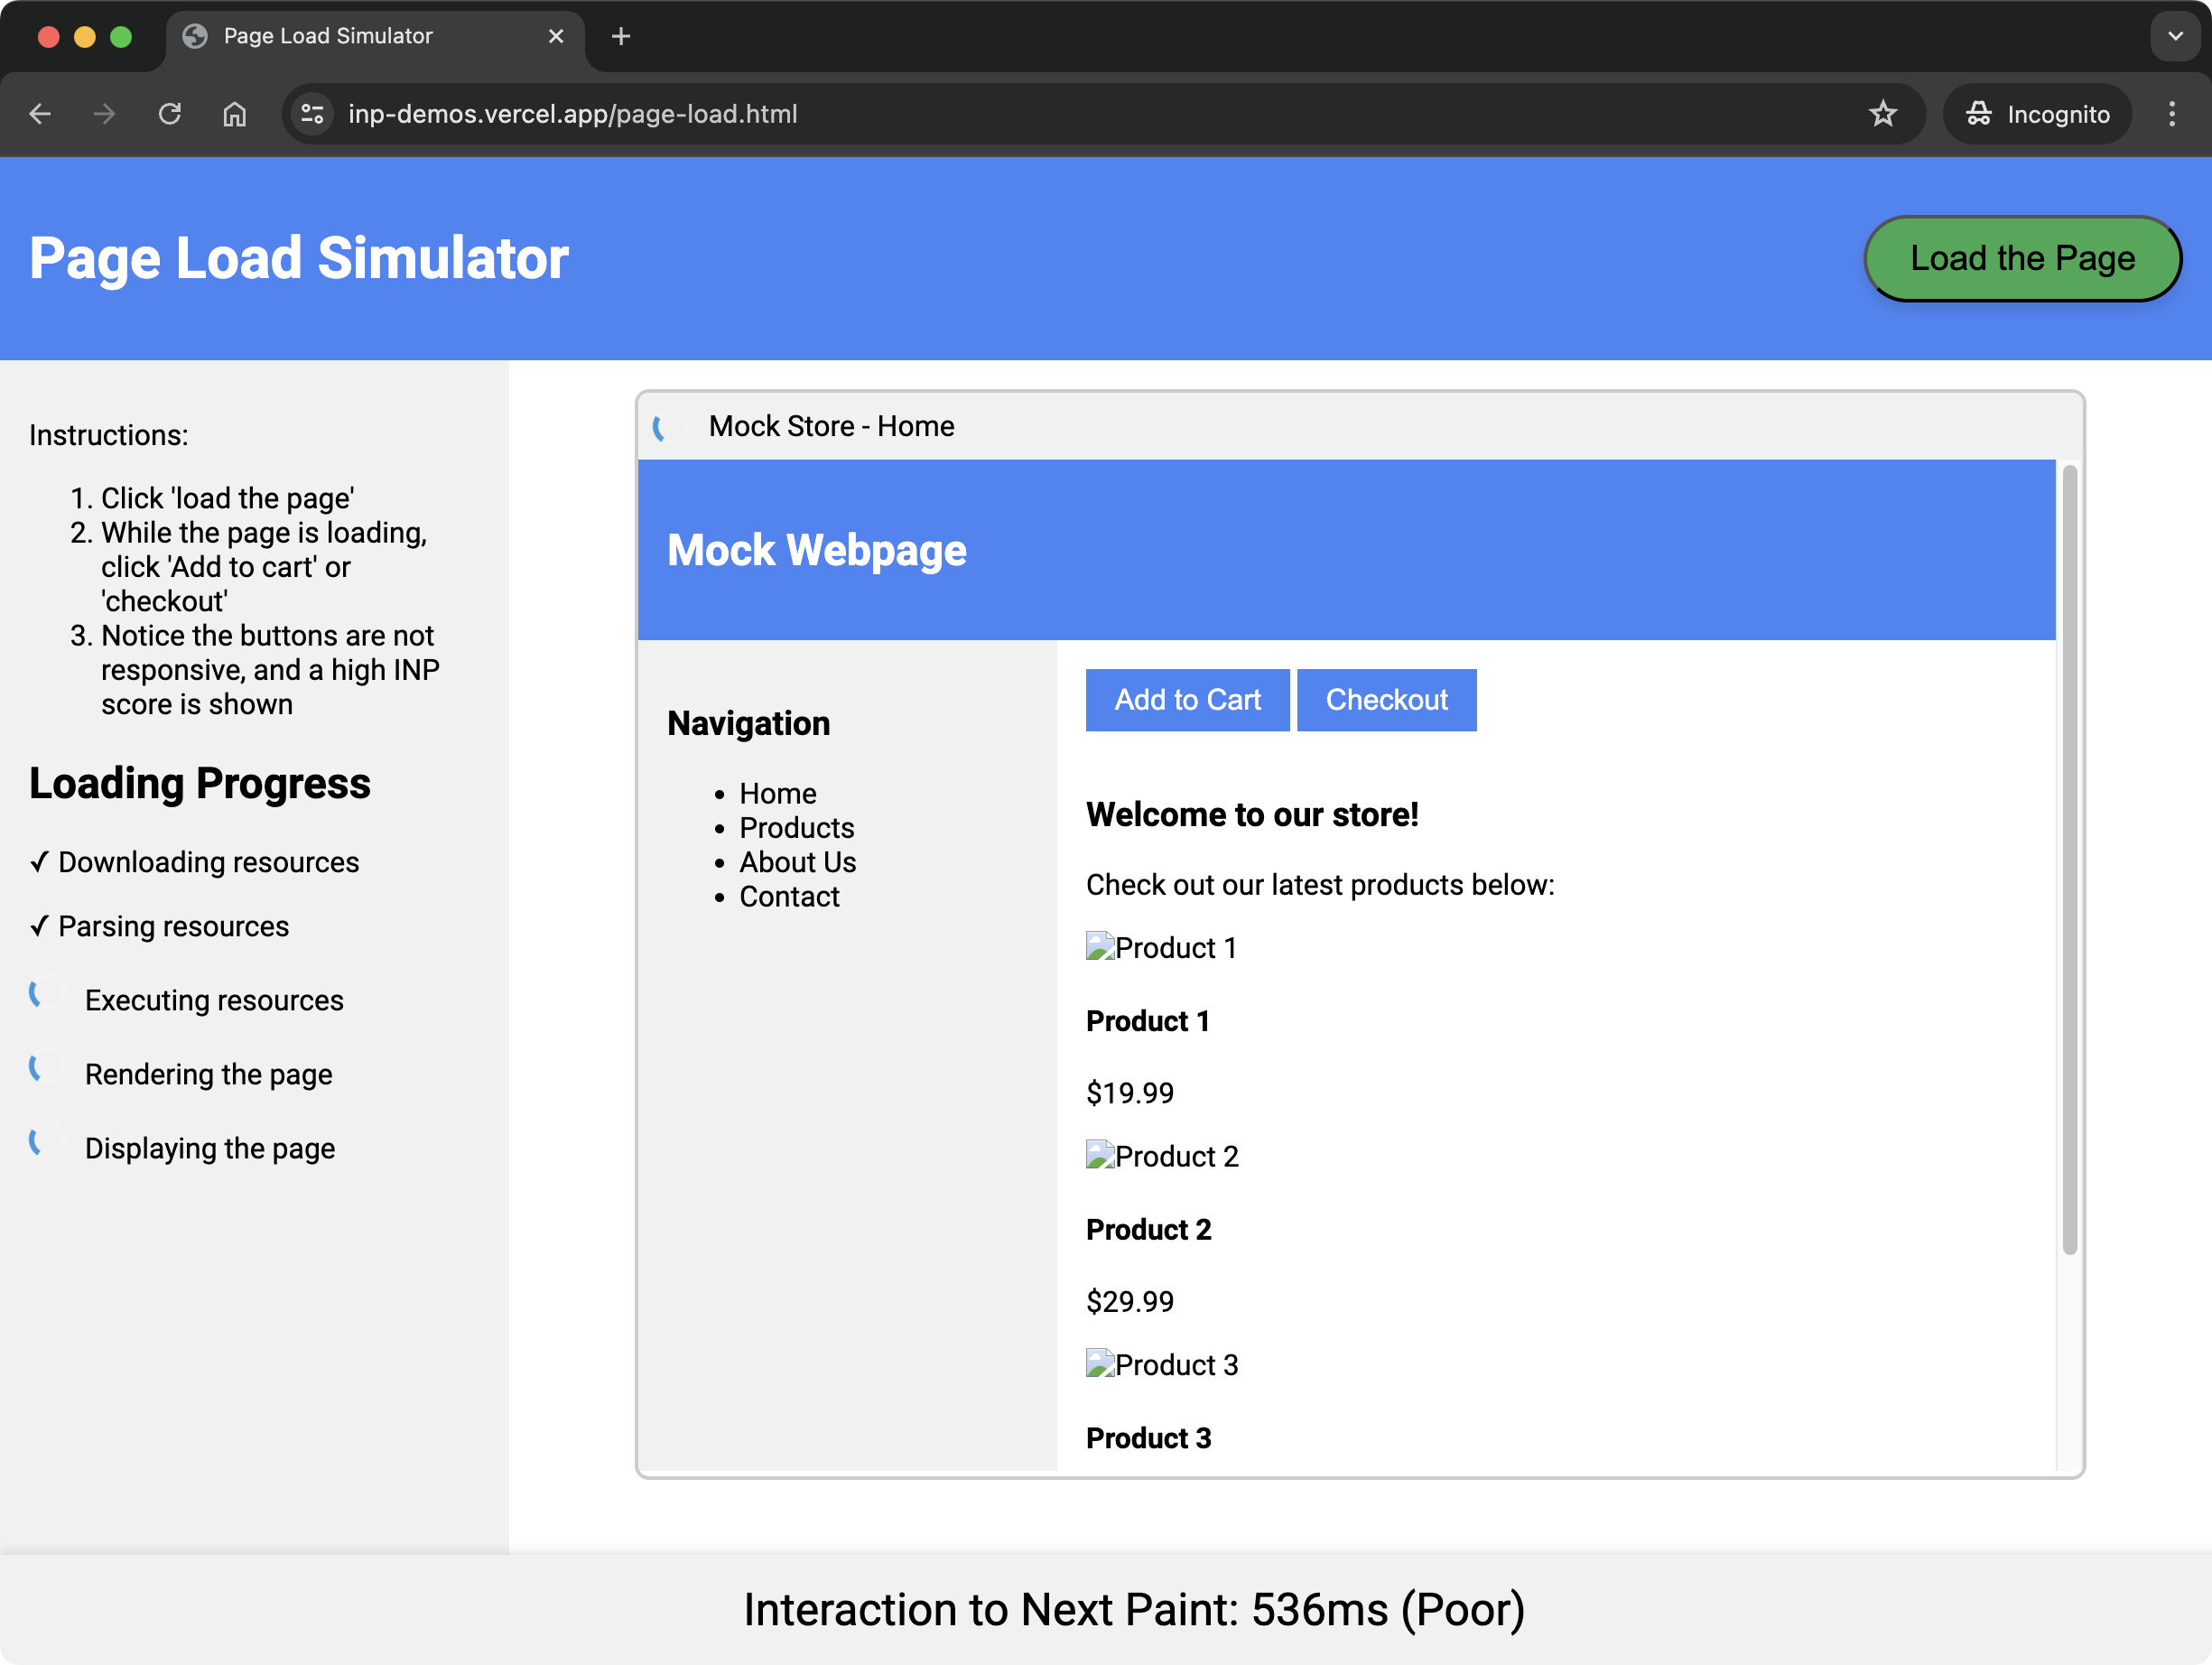
In fact, some third-party trackers - which are notorious for slowing down page speed - can be far more costly during the page load phase than after the page has fully loaded.
So going back to the initial example, when a user clicks on the 'add to cart' button during the page load phase, but scripts are still downloading, parsing, and executing, the main thread can be blocked, leading to a poor INP score.
How to fix slow INP scores during page load
You may think that interactions during page load can't be optimized as you don't have control over how the browser loads your page. However interestingly, many general page load performance optimizations can also help improve INP scores during page load.
To mitigate slow INP scores during page load, consider the following:
-
Minimize main thread work during page load.
-
During your JavaScript module initialization scripts, break up the work into smaller tasks and yield to the main thread regularly.
When you yield back to the main thread, the browser can use that time to process and handle user interactions which may be pending.
-
While elements cannot be interacted with, ensure they're hidden or ensure it's explicitly clear that they're not interactive.
As you learnt earlier, a user may still interact with these elements, and others!
-
If using a JavaScript framework that hydrates your server-side rendered content, ensure the hydration process is optimized. It is wasteful to re-render the entire page when the browser has already done the work of loading and rendering the initial content.
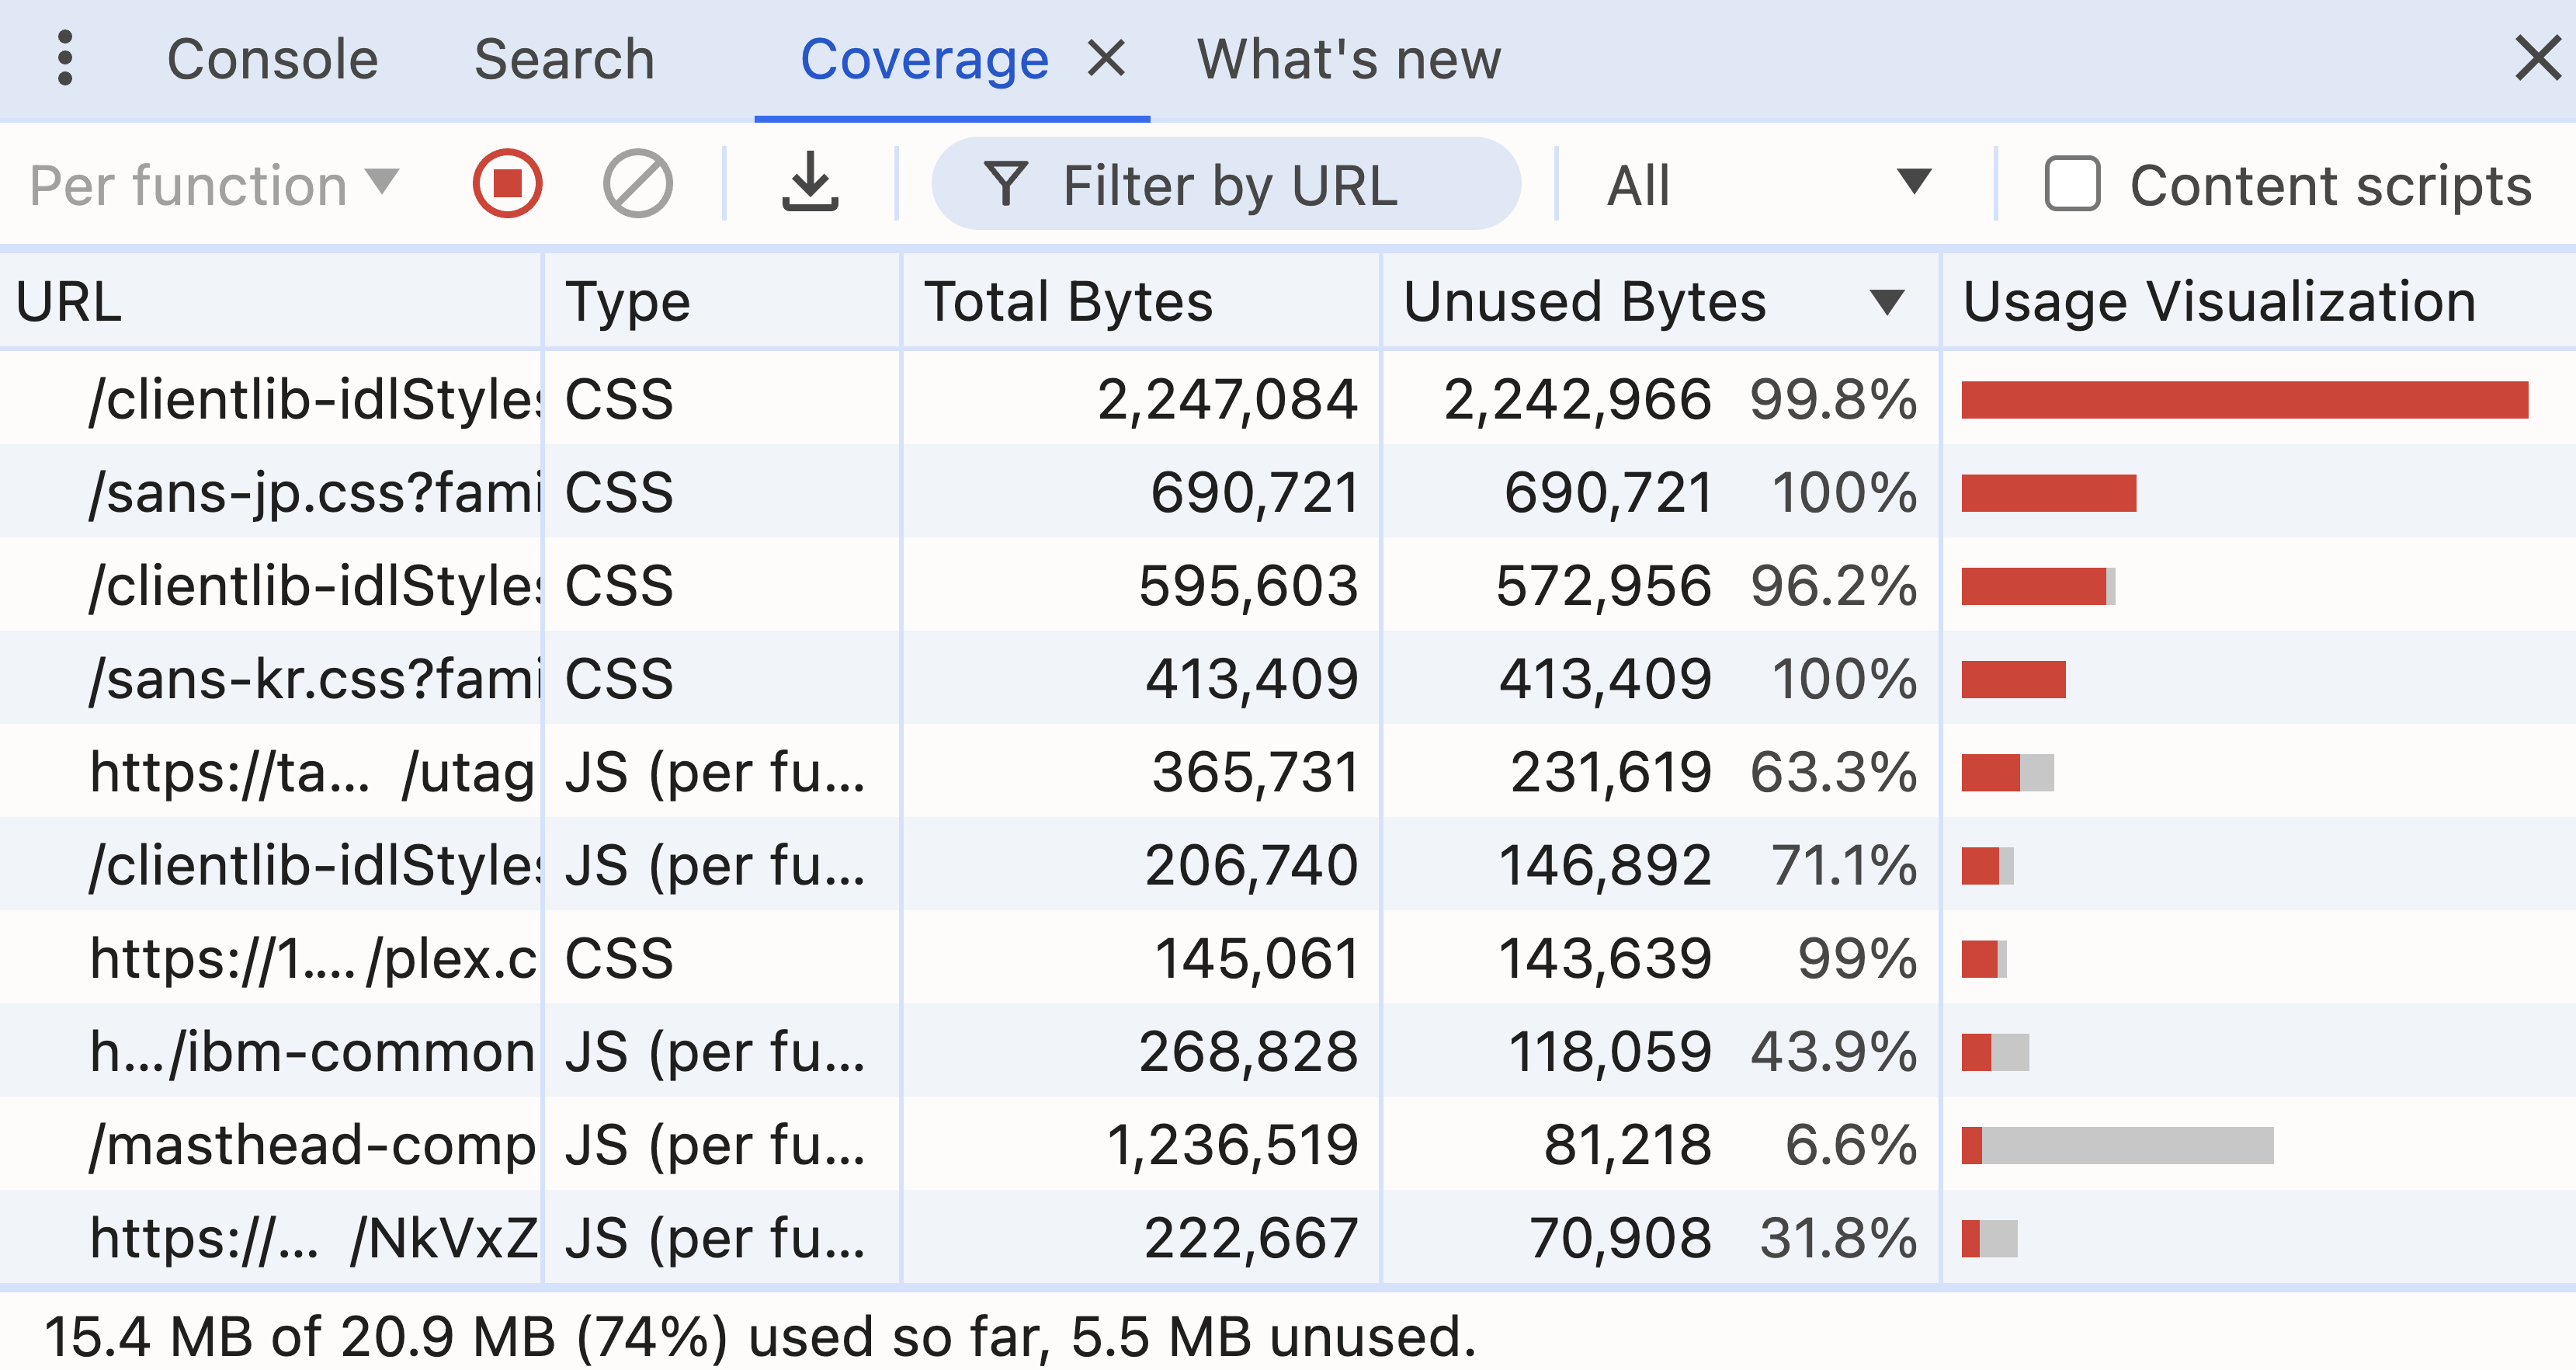
-
Use browser developer tooling to run a code coverage analysis of your page. Any unused JavaScript or CSS you find is still downloaded, parsed, and executed by the browser, which keeps the main thread busy. Deferring or removing this code can help improve INP scores during page load.
Challenge Yourself: Test Your INP Knowledge
Now that you've seen those misconceptions, you can test your understanding with some scenarios:
- A user clicks on a blank area of your webpage, causing no visual change. Could INP be registered here?
- Does INP factor in your first-party code only, or can external scripts impact INP also?
- You've optimized 70% of user interactions to be under 200ms. Does this guarantee a good INP score according to Google's Core Web Vitals guidelines?
- A text paragraph on your site offers no custom interactivity, yet consistently shows high INP scores in your Real User Monitoring dashboard. Is this likely a measurement error?
Answers to the challenge
- Yes, clicking on a blank area can still affect INP if there are background tasks or other factors delaying the next frame render.
- Yes, external scripts, browser extensions, and other factors can impact INP. Real User Monitoring tools like DebugBear can help you pinpoint these issues.
- No, INP typically focuses on the slowest interaction delay, so a few slow interactions can still result in a poor score.
- No, high INP scores for a static paragraph are likely due to background tasks or other factors affecting the page's responsiveness.
A Recap of INP Misconceptions
Here's a reminder of the key points covered in this post:
- Visual updates aren't necessary for INP measurement.
- All page elements can affect INP.
- External factors beyond your own code can impact INP.
- INP represents the worst interactions, not typical ones.
- INP can be measured during page load, not just after.
Monitor your website with DebugBear to get insights into your INP performance and identify areas for improvement.
You can see what elements often cause poor INP scores and can identify specific scripts that are slowing down your website.
Continuously collect real user data to see what pages often result in slow interactions and get alerted when your Core Web Vitals get worse. Sign up for a free trial.


Monitor Page Speed & Core Web Vitals
DebugBear monitoring includes:
- In-depth Page Speed Reports
- Automated Recommendations
- Real User Analytics Data