
When visitors return to your website, you can make their experience lightning-fast by efficiently caching your static assets and using the longest 'lifetime' possible. This guide explains what the Serve static assets with an efficient cache policy Lighthouse audit checks for and how to fix it.
Why caching static assets matters
Every time someone visits your website, their browser needs to download all the resources that make up your page: images, JavaScript files, stylesheets, fonts, and more. This downloading process takes time and uses bandwidth.
With proper HTTP caching, a browser can be told: "You've downloaded this file already. You can reuse it from your local storage instead of downloading it again." This is known as a cache hit, and it's much faster than a cache miss, where the browser has to download the file again. It means:
- Faster page loads for returning visitors
- Reduced bandwidth usage for both your users and your server
- Lower server costs from fewer requests
Consider this example of a user visiting a page for the first time:
It was necessary to download main.js from the server the first time the user visited the page. However, the browser stored main.js in its cache, so it can be reused on future visits.
Consider this example of a user visiting a page for the second time:
Here, the browser can reuse main.js from its cache, bypassing the network entirely.
Understanding the Lighthouse audit
The "Use efficient cache lifetimes" audit appears in a Lighthouse report. It identifies static resources that could be cached but aren't, or that have ineffective cache settings.
The efficient cache lifetimes audit used to be called "Serve static assets with an efficient cache policy" in older versions of Lighthouse.
What the audit checks
When Lighthouse runs this audit, it examines most resources loaded by your page, including:
- Images: such as JPEGs, PNGs, and SVGs
- JavaScript files: for example, your main-v1.js or vendor.js files
- CSS stylesheets: like styles.css or main-v2.css
- Fonts: web fonts you might be using, such as a woff2 file
- Media files (videos, audio): if you have any on your page, like an mp4 video
For each resource, it checks if:
- The resource has a successful HTTP status code (200, 203, or 206)
- There's no explicit
no-cachepolicy - The cache duration is appropriate
If a resource fails these checks, it will appear as a recommendation in the Lighthouse report, along with details on applicable resources.
Use our website cache checker to check your cache-control headers and CDN cache status.
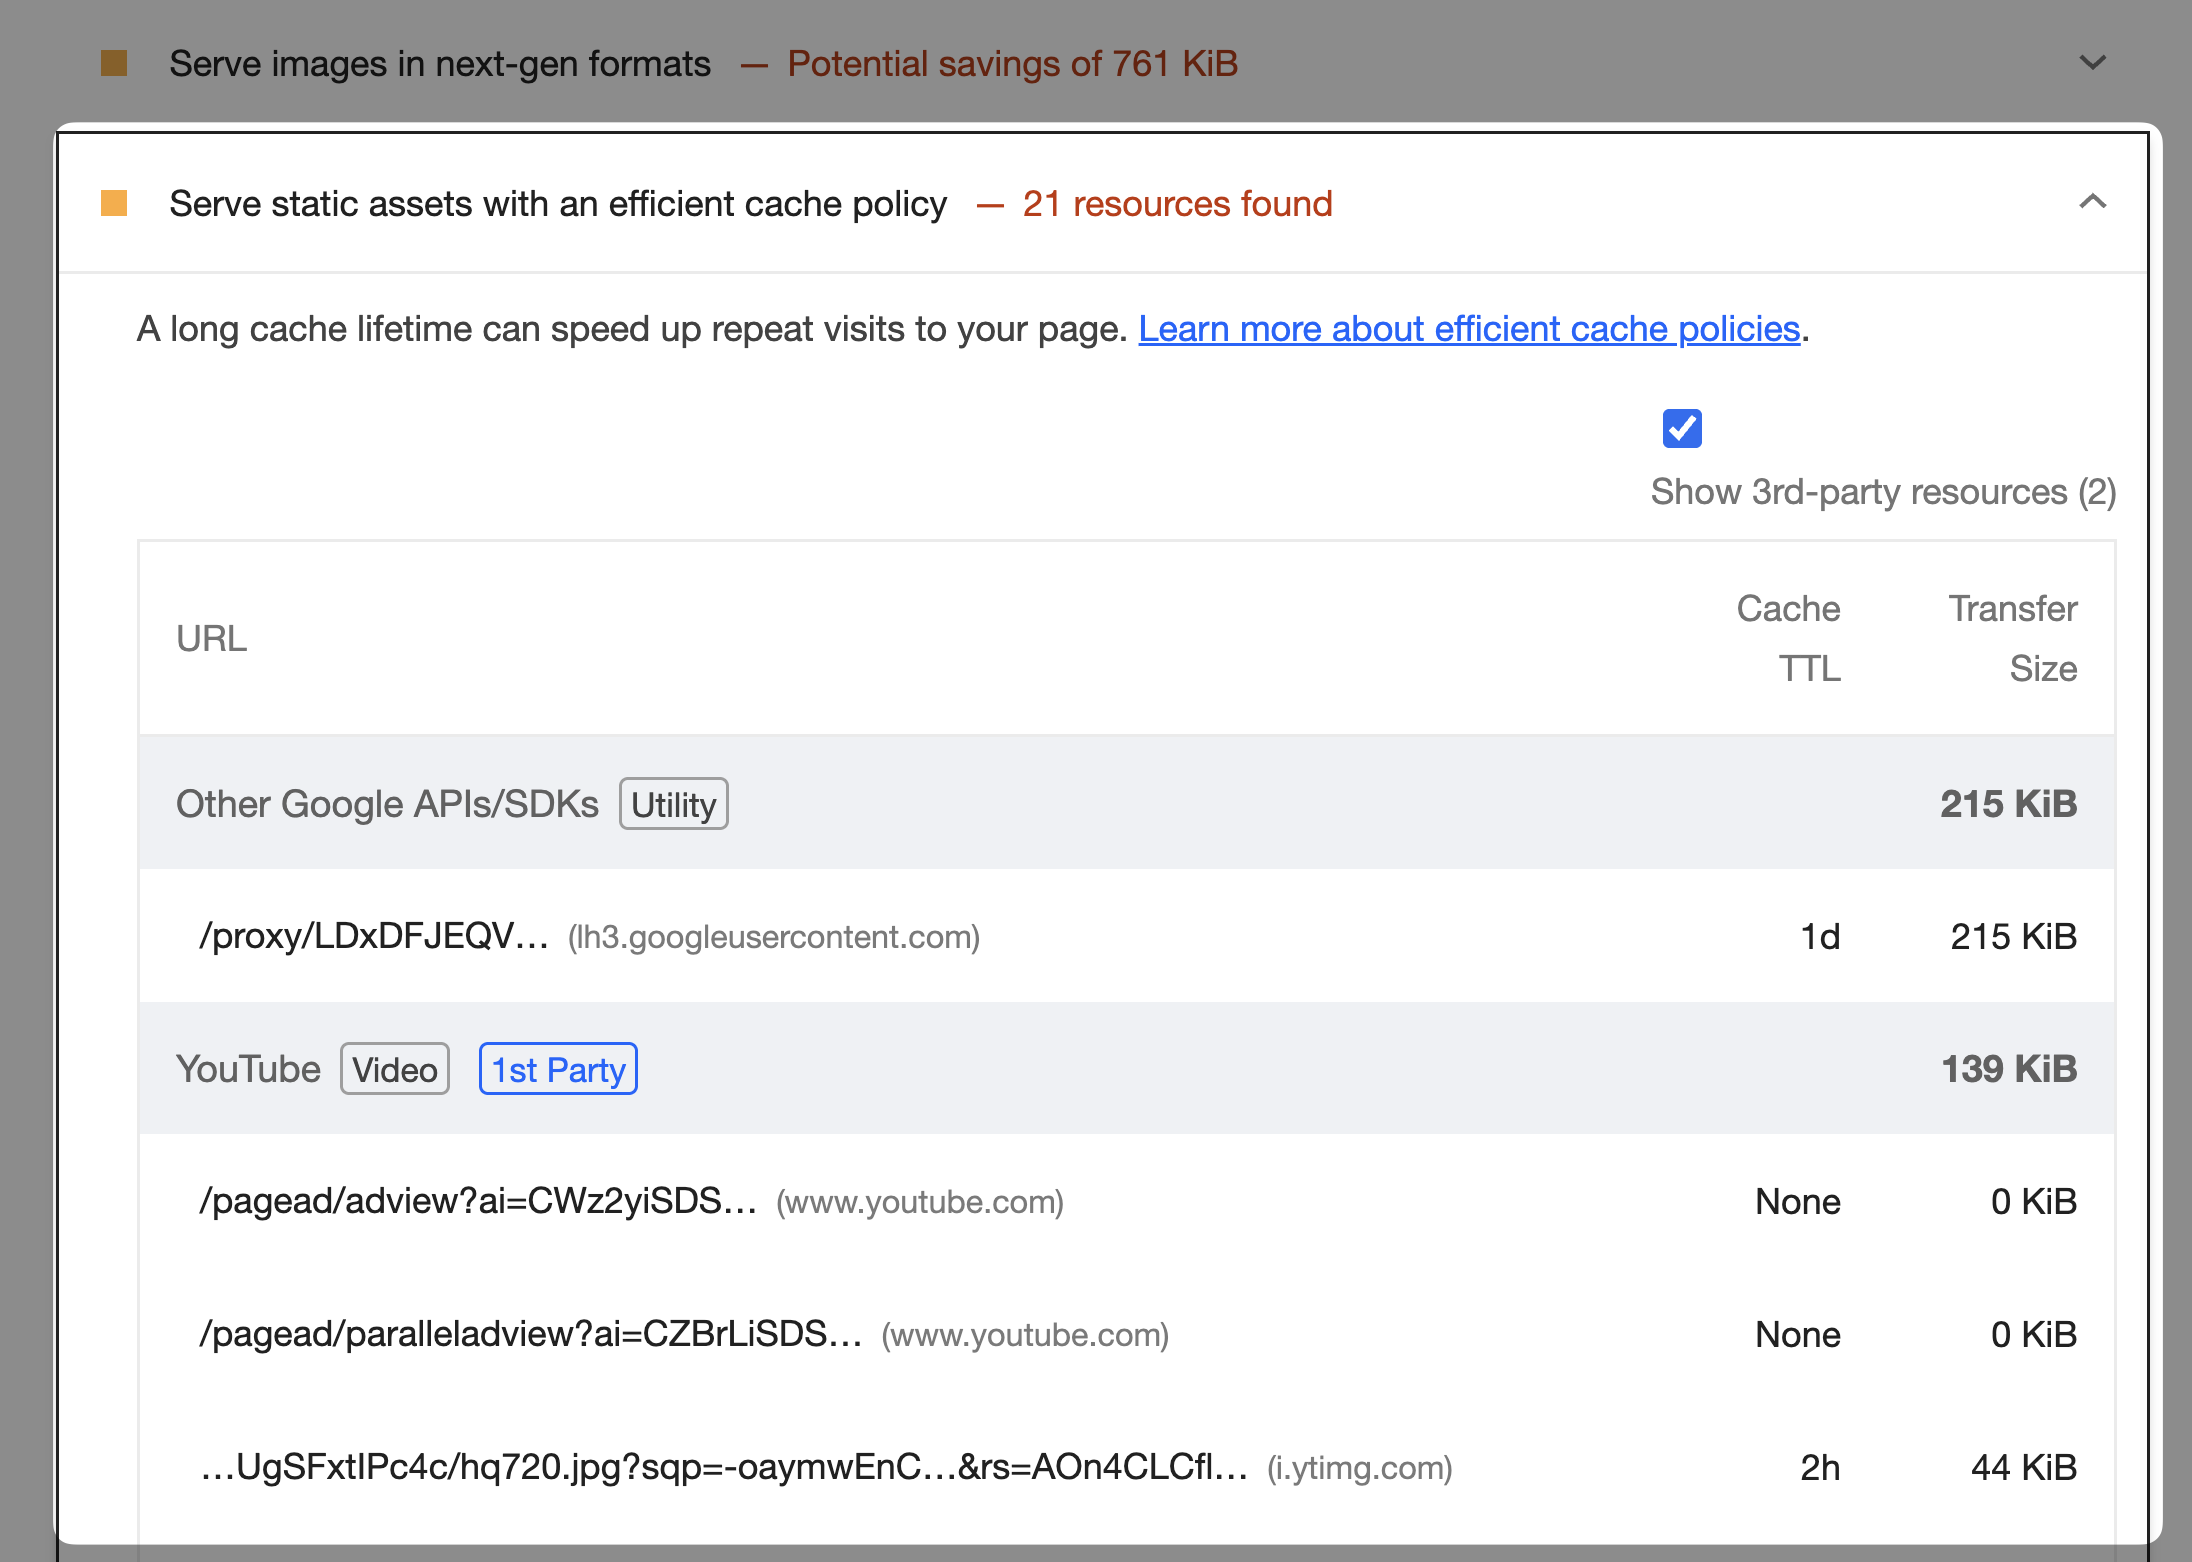
'Serve static assets with an efficient cache policy' message in performance audit diagnostics
Currently, Lighthouse displays this message in the 'audit' report.
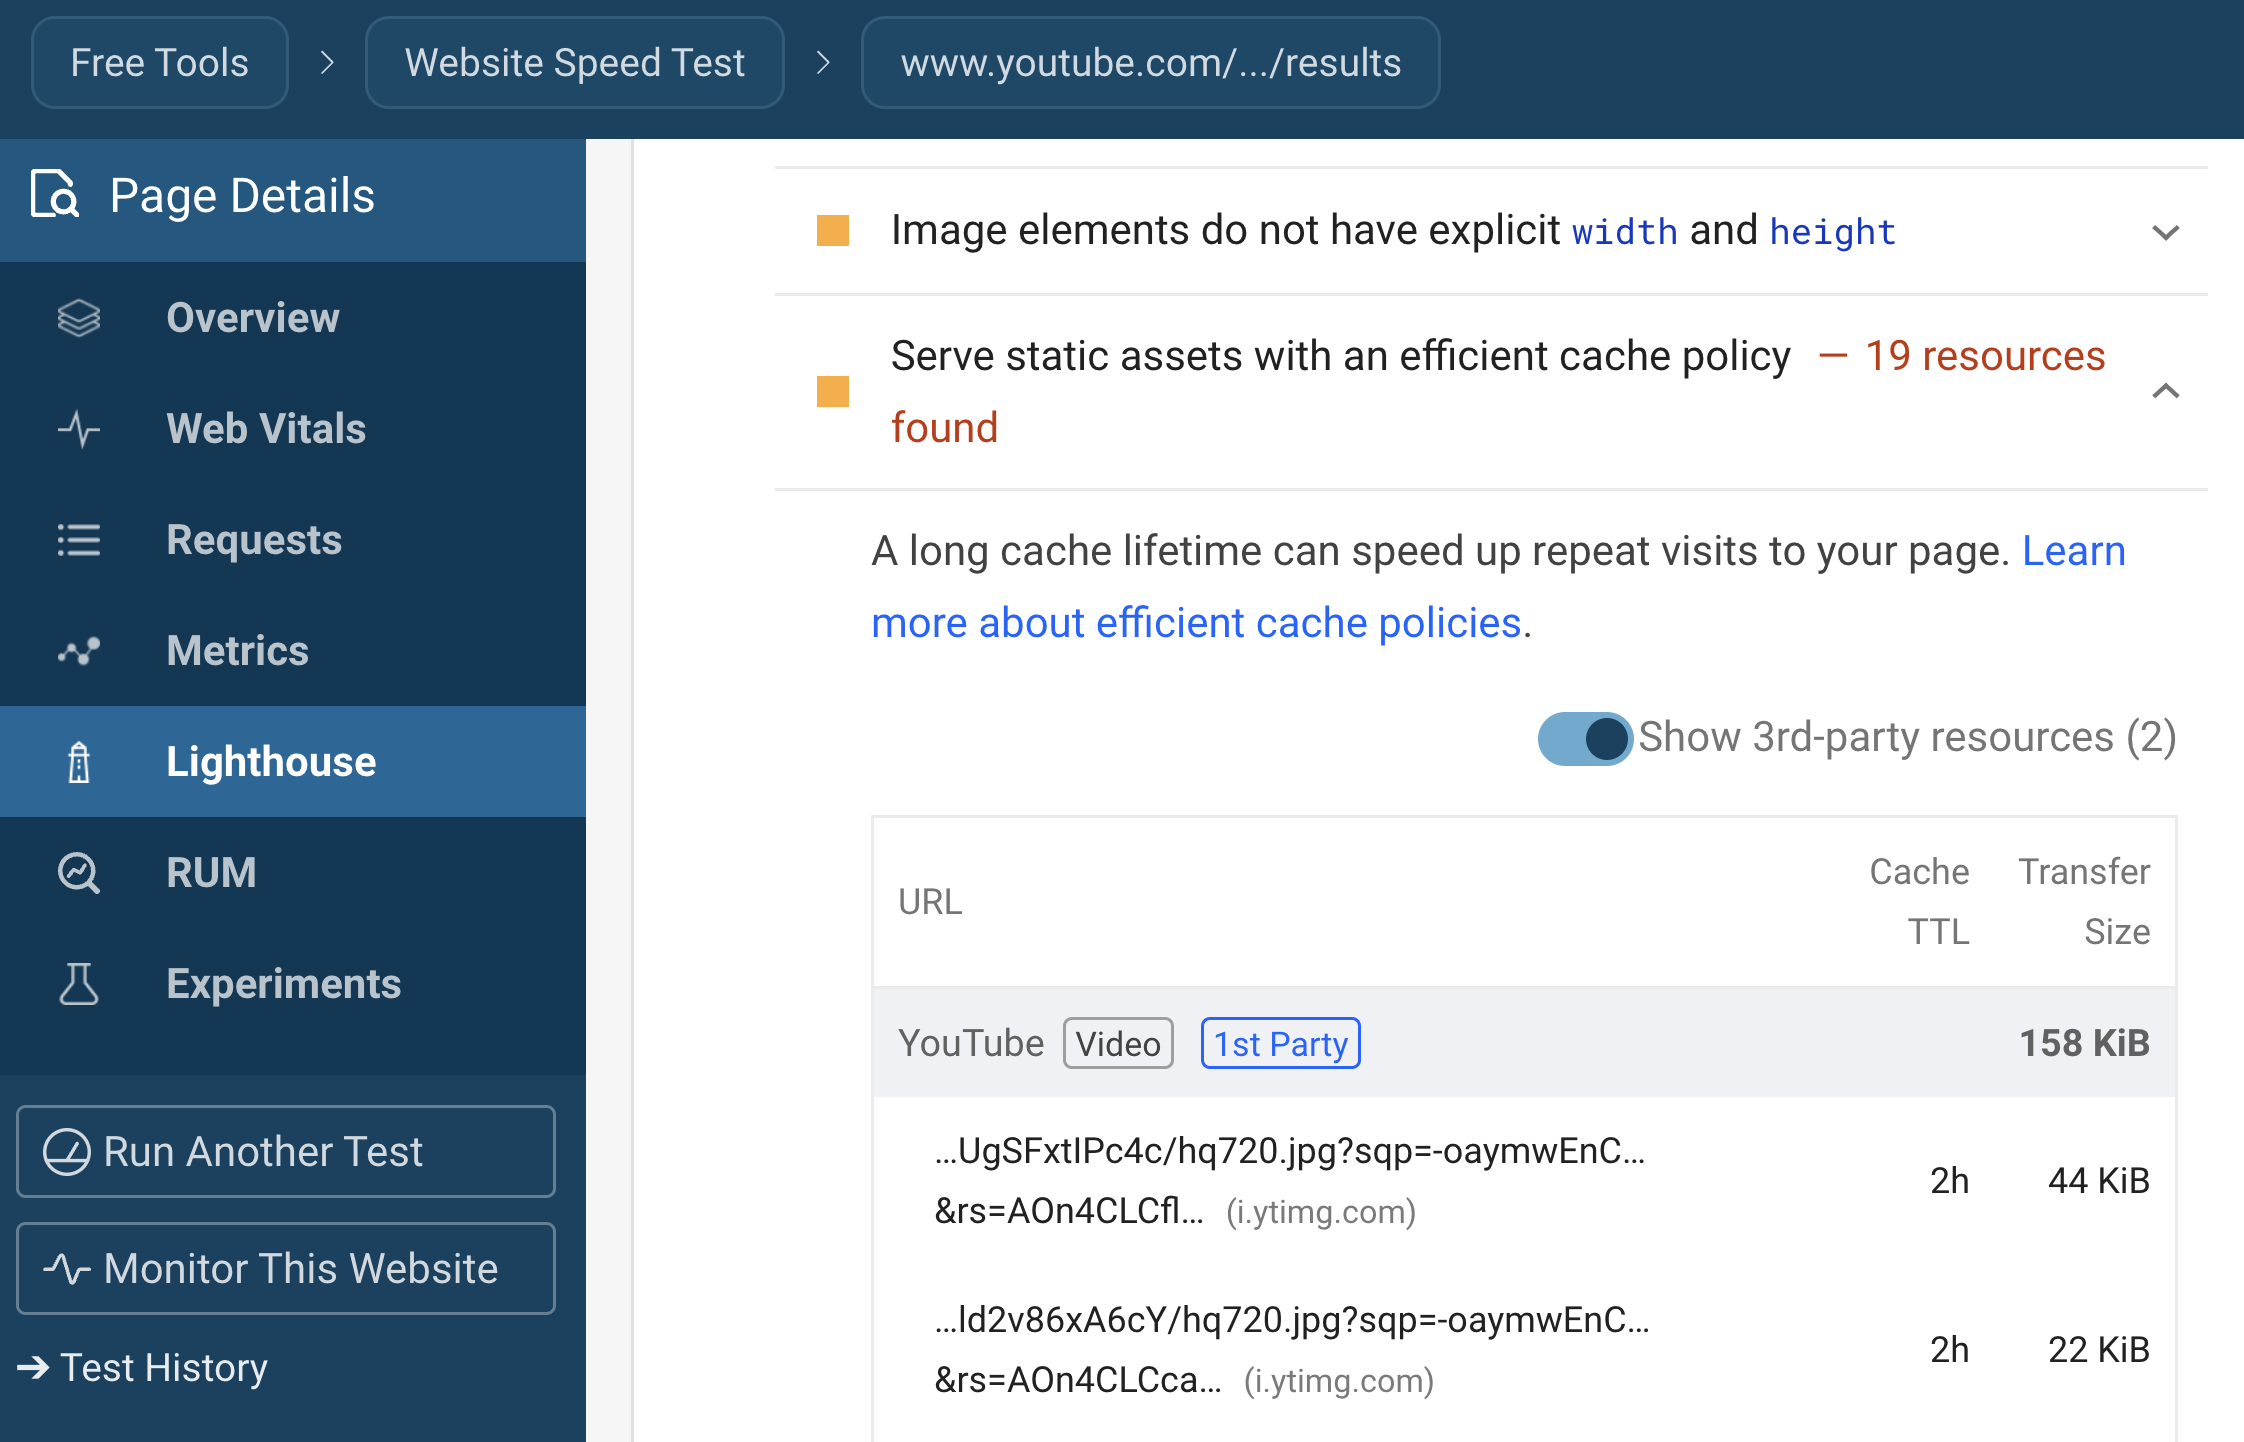
You might be used to running Lighthouse from Chrome DevTools; however, DebugBear also provides a Lighthouse Report as part of its free website speed test feature. The same terminology is used here.
'Use efficient cache lifetimes' message in the new insights view
Later in 2025, the performance audit will be replaced with Insights. However, the performance feedback provided will be similar, and standardized between Lighthouse and Chrome DevTools.
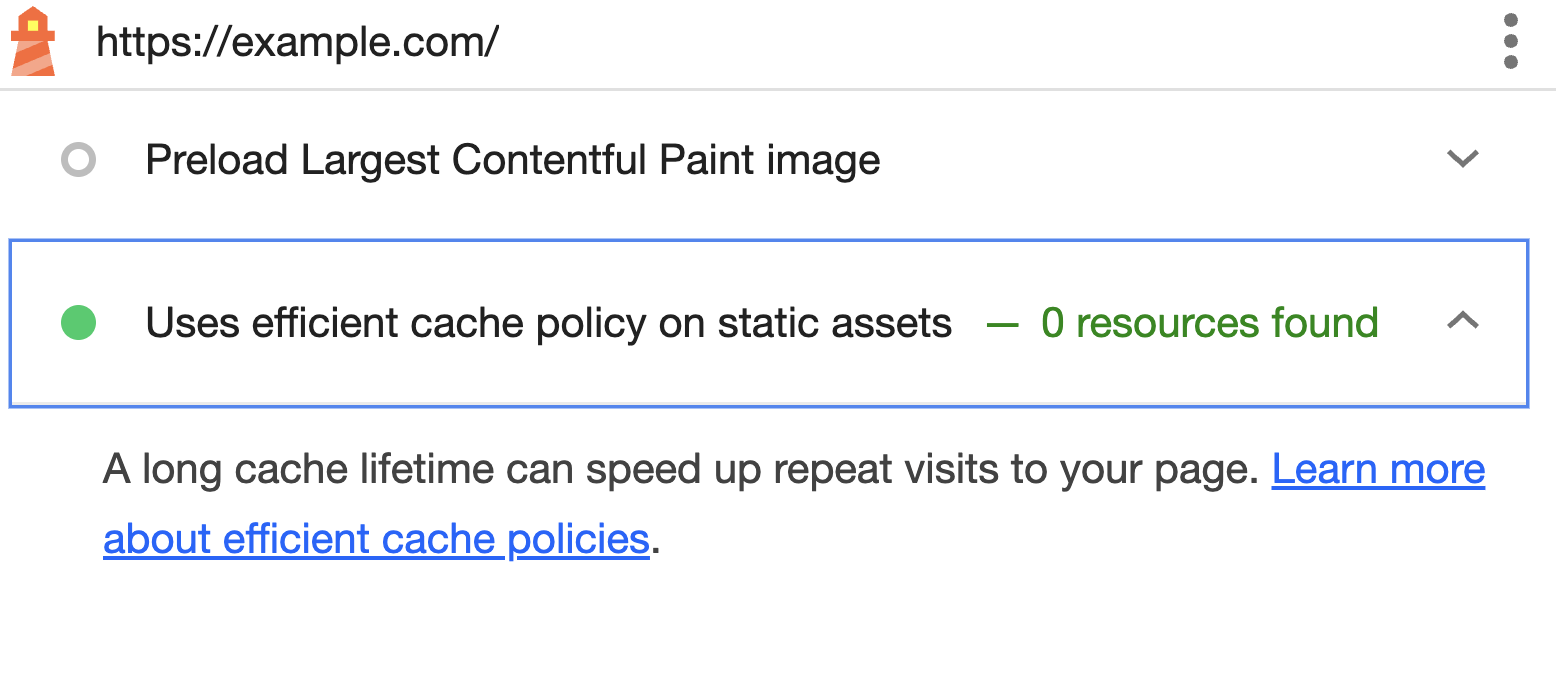
In this insights audits view, the audit 'Use efficient cache lifetimes' checks the cache policies of resources loaded on your website.
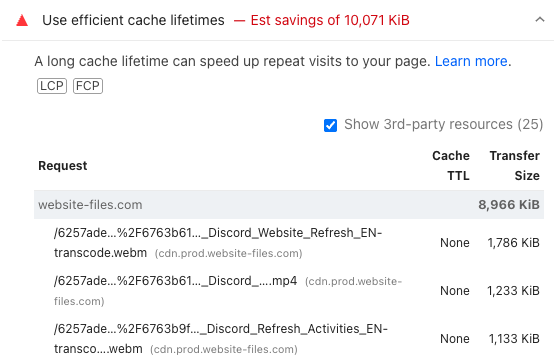
Lighthouse explains the purpose of the audit like this: "A long cache lifetime can speed up repeat visits to your page."
Reading the audit results
When you fail this audit, Lighthouse provides a table with three important columns:
- URL: The location of the resource that needs better caching
- Cache TTL: How long the browser is currently allowed to cache the resource
- Transfer Size: How much data could be saved if the resource was effectively cached
Low scores on this audit directly impact your overall Lighthouse performance score, which can affect both user experience and potentially your search rankings due to Core Web Vitals being a ranking factor.
You can also run Lighthouse on the CLI, which is covered in our Lighthouse guide.
How to implement efficient caching
The good news is that fixing this audit is relatively straightforward once you understand how HTTP caching works.
To enable caching, you need to configure your server to send the appropriate Cache-Control HTTP header with your static assets. This header tells browsers how long they can keep and reuse the resource.
For static versioned assets (for example, https://example.com/main-v1.css), like images, CSS, and JavaScript, start out with:
Cache-Control: public, max-age=31536000, immutable
This assumes that resources are immutable, meaning they never change. If you need to update a resource, you should change the URL, e.g., main-v2.css and update the references in your HTML.
However, in the real world, you shouldn't be manually incrementing version numbers. Instead, you should use a build tool or web framework that automatically generates unique URLs for each version of your assets. This is known as asset fingerprinting.
We cover lots of useful caching strategies in A Guide to HTTP Cache Control Headers.
Static assets should be versioned, and cached for as long as possible.
If you want some more information on how to configure your server to send the appropriate headers, we have examples in our detailed guide to implementing browser caching, which covers Caddy, Nginx, Apache, and more.
Verifying your caching implementation
After implementing your cache policy, you'll want to verify it's working correctly. Here's how:
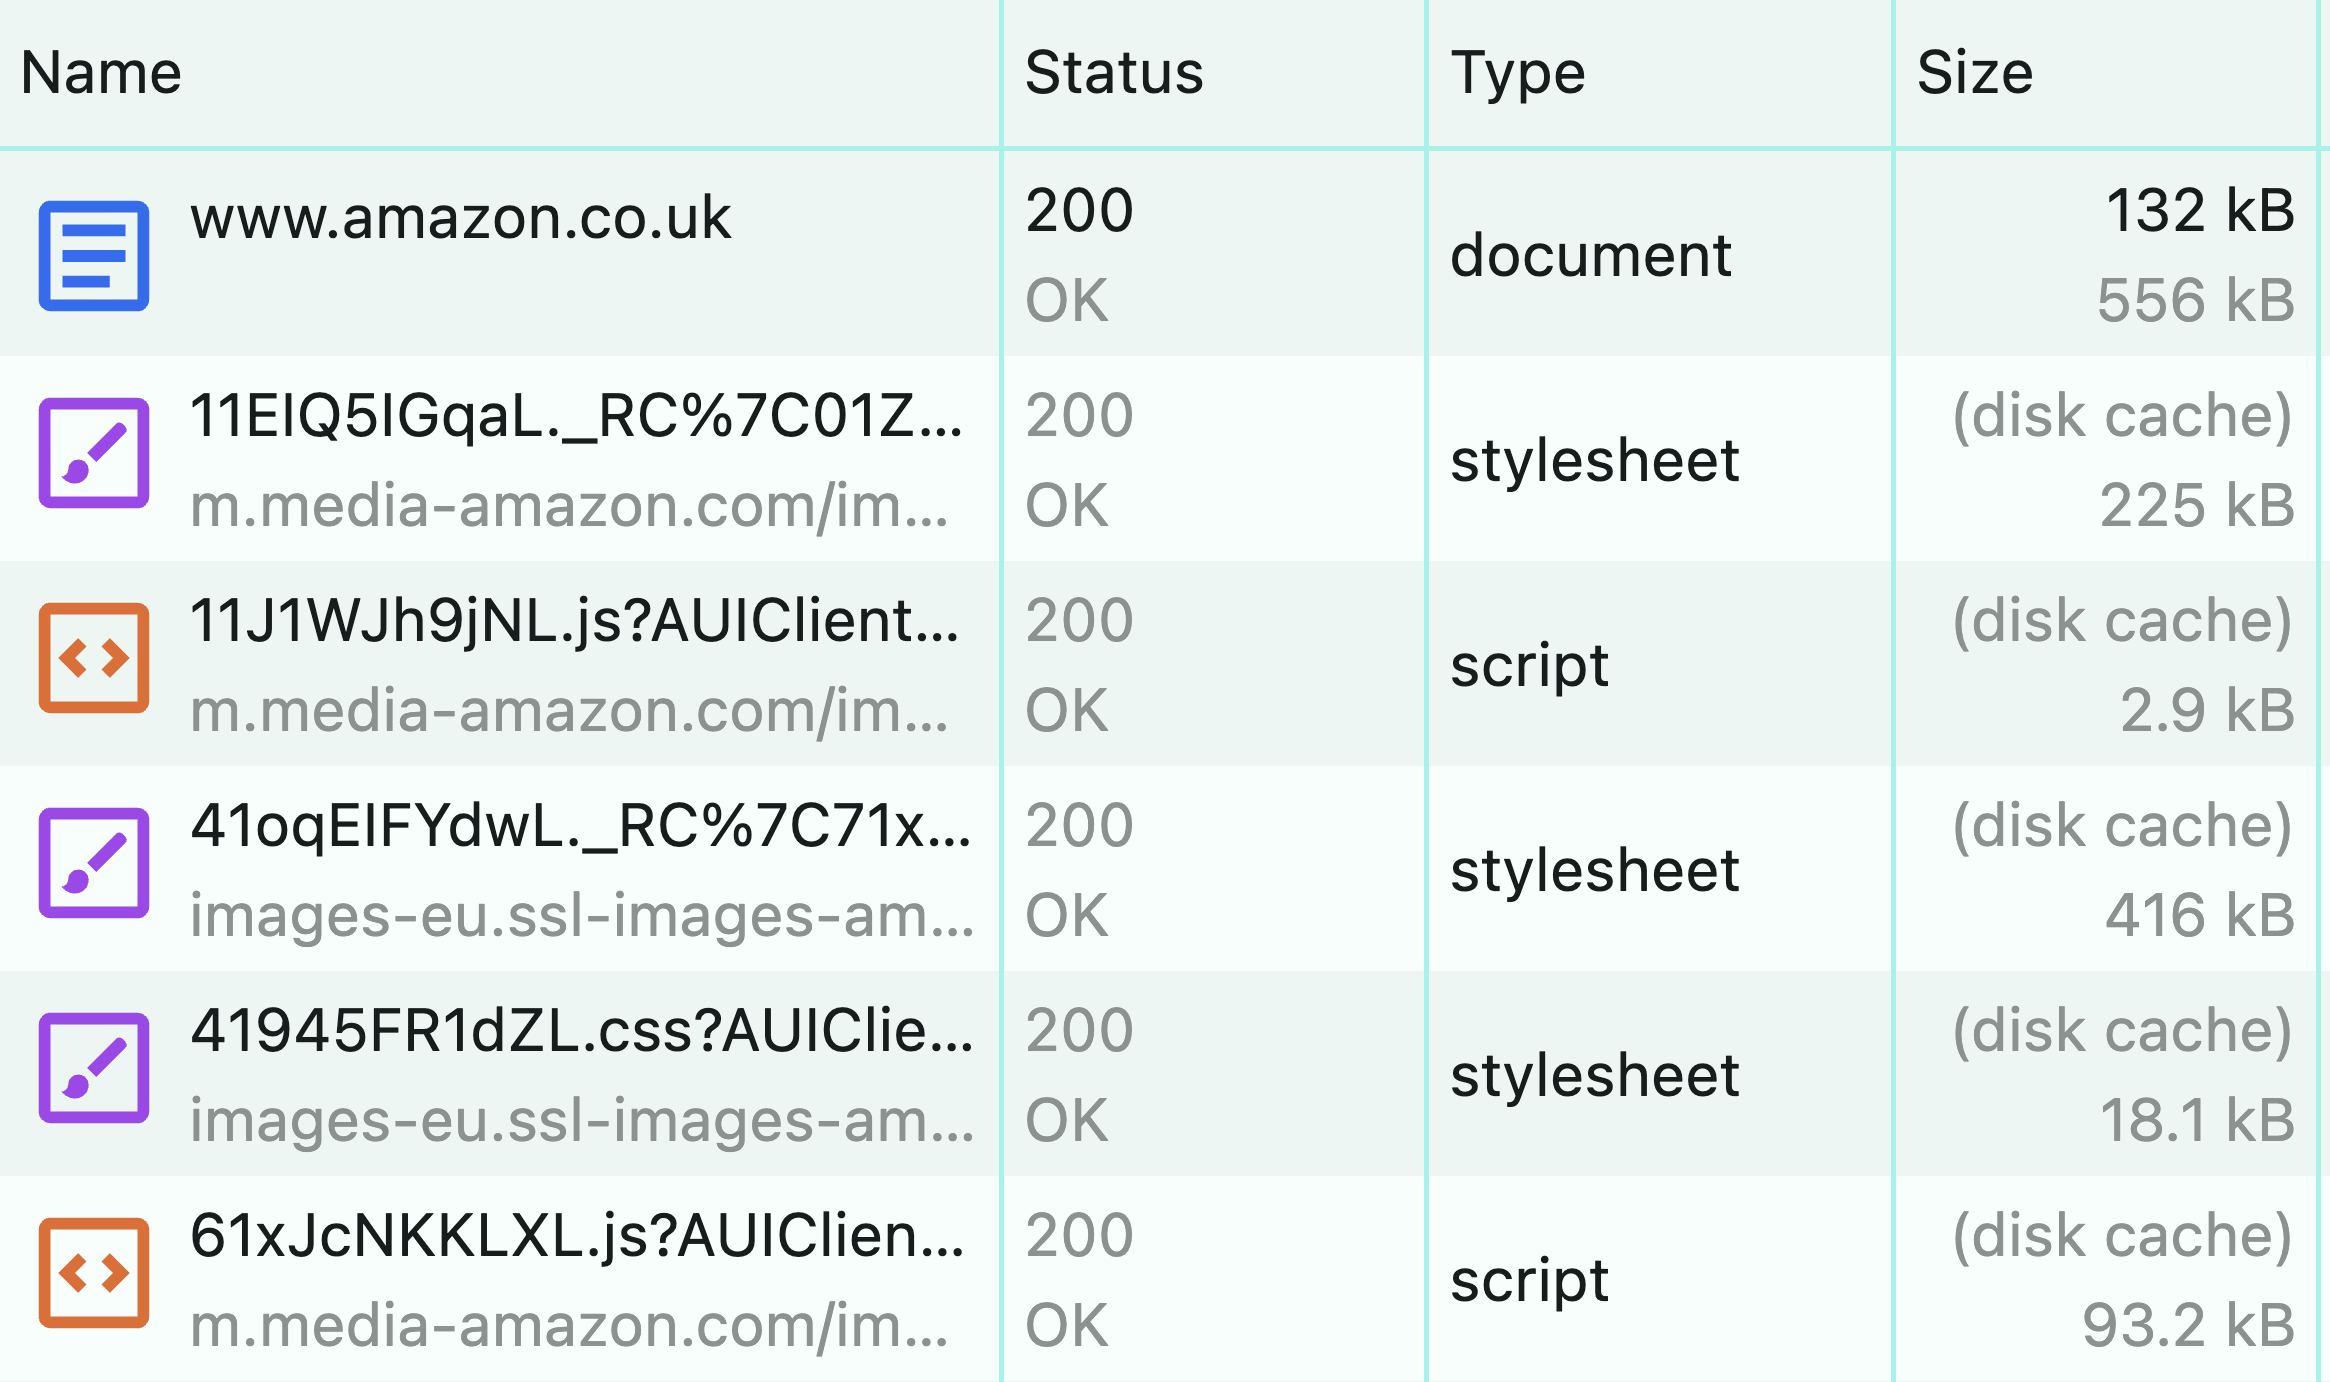
Using Chrome DevTools
- Navigate to the Network tab in Chrome DevTools
- Ensure that "Disable cache" is unchecked, then navigate to your website
- Reload the page with a single click on the reload button
- Check the "Size" column in the Network tab. If you see
(disk cache)or(memory cache), those files are being retrieved from the cache
Run Lighthouse again
After implementing or updating your caching strategy, run Lighthouse again to verify the audit now passes. You should see improvements in both this specific audit and your overall performance score.
If there's nothing to report, you can find the audit in the "Passed audits" section of the Lighthouse report.
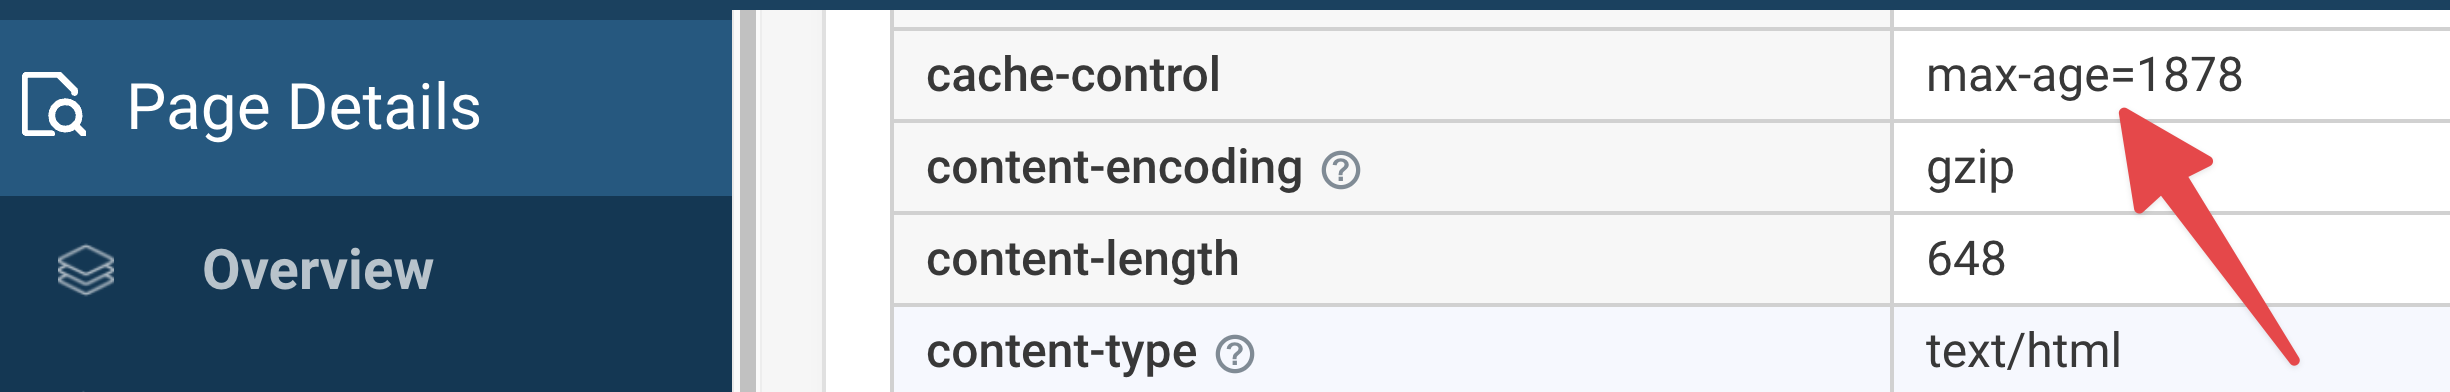
Use DebugBear
In addition to a Lighthouse report with the usual audit results, DebugBear provides a waterfall chart that gives you a request and response header view of your assets. This can help you quickly identify any issues with your cache headers.
In addition, DebugBear also lets you customize your test runs so you can test your site with different cache settings.
How caching fits into your overall performance strategy
While using an efficient cache lifetime for your assets is important, it's just one part of a comprehensive website performance optimization strategy. For the best results, combine it with:
- Reducing JavaScript execution time
- Optimizing the critical rendering path
- Minimizing render-blocking resources
- Reducing initial server response time
- Compressing HTTP responses
And much more that you can find throughout our blog.
Track your performance over time
DebugBear website performance monitoring can help you see how better caching and other page speed optimization impact user experience on your website.
You can run scheduled synthetic tests in controlled test conditions, including warm loads with caching enabled.
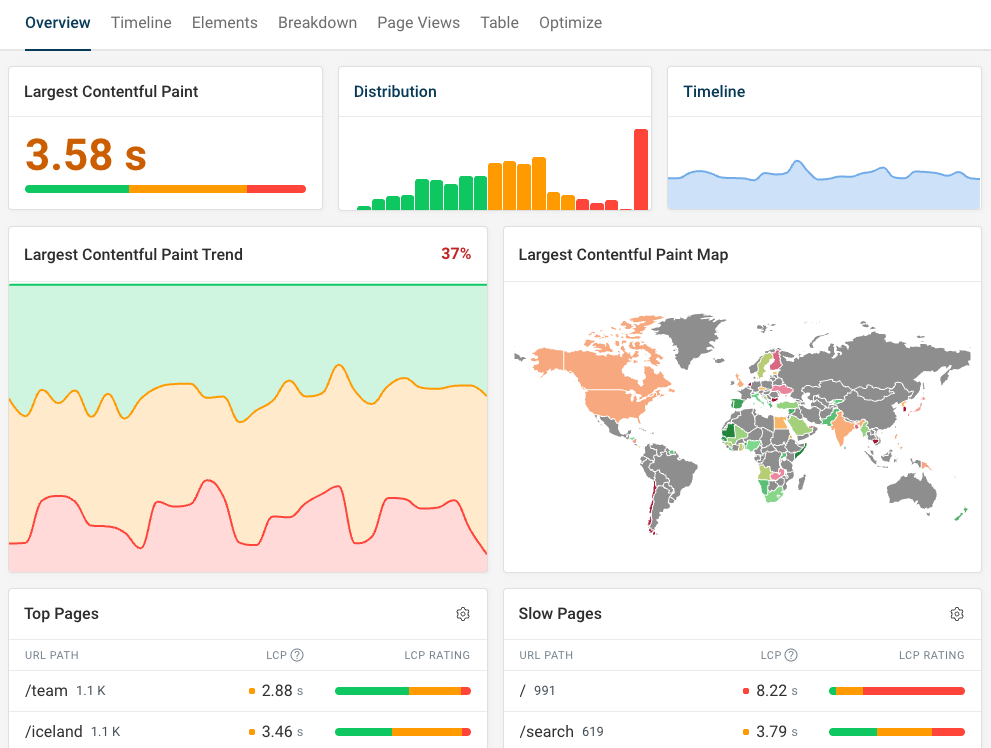
You can also monitor real-user data, including the Largest Contentful Paint metric and hit ratios for the browser cache.


Monitor Page Speed & Core Web Vitals
DebugBear monitoring includes:
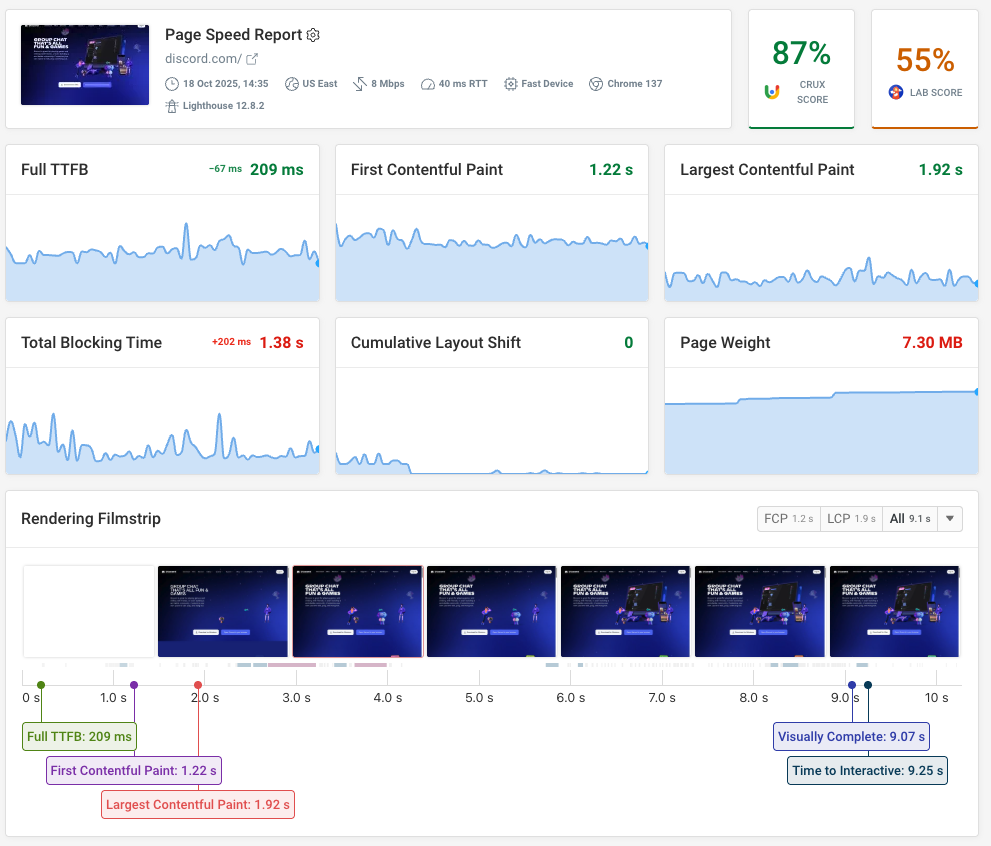
- In-depth Page Speed Reports
- Automated Recommendations
- Real User Analytics Data