
In this article, we'll explore how Element Render Delay might be affecting a page's Largest Contentful Paint score.
What is Element Render Delay?
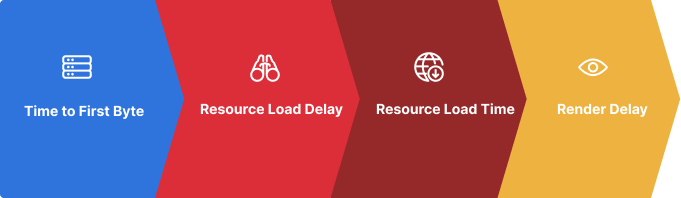
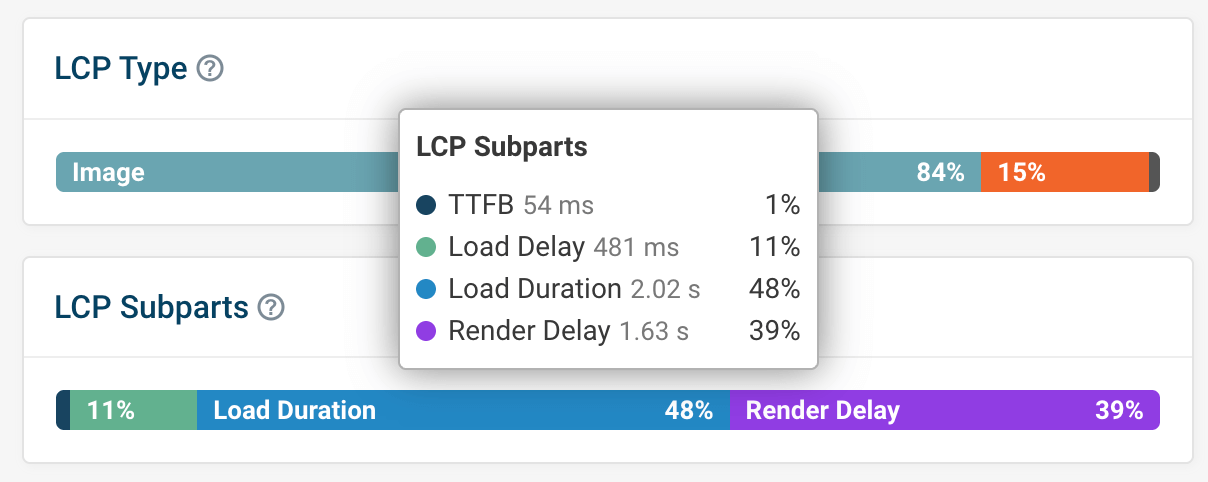
Render Delay is one of the Largest Contentful Paint sub-parts:
- Time to First Byte: time to start loading the HTML document from the website server
- Resource Load Delay: time for the browser to discover the LCP image
- Resource Load Time: time for the browser to download the LCP image
- Render Delay: time for the browser to display the LCP image or other LCP element
These four components provide a more detailed breakdown of the LCP score.
When running a Lighthouse test, the LCP score is divided into specific values for each sub-part. Render Delay measures the time it takes for the LCP element, such as an image or other content, to become visible.
Achieving a good LCP score requires the total load time to be within 2.5 seconds. When analyzing the sub-parts, it's helpful to think of the total time as a budget. By doing so, it's easier to identify which sub-part is consuming the most time and make adjustments to improve performance.
For example, if TTFB is consuming most of the LCP budget, focusing on optimizations such as preloading the LCP image or using modern image formats may not improve the LCP score. In this example, a better approach would be to use a CDN to reduce TTFB.
Google recommends that Render Delay should account for about 10% of the total LCP budget, although this is just a guideline.
What causes render delay?
Now that we understand what Render Delay is, let's look at some common reasons why Render Delay happens.
- DOM is not ready - One of the reasons is when an element has already loaded but is waiting for the DOM to display content and become interactive. This happens when stylesheets are blocking the page from rendering, or when JavaScript needs to be loaded and run.
- Preloaded LCP Image - Another cause of Render Delay can arise when preloading the LCP image. In such cases, part of the delay attributed to resource loading and image loading times may be shifted onto Render Delay. This delay transfer is fine, as ultimately the overall LCP score improvement matters most for user experience and SEO.
- Hidden content via CSS - Hiding page content for the purpose of A/B testing can impact page speed.
- Busy main thread - When the main thread is busy during the page load, blocking content from rendering once the resource has loaded.
- Large re-renders - From reviewing pages that we monitor, we found a direct correlation between content being re-rendered and large render delay for LCP image and video elements.
Let's take a look at three example websites where one of these issues is causing render delay.
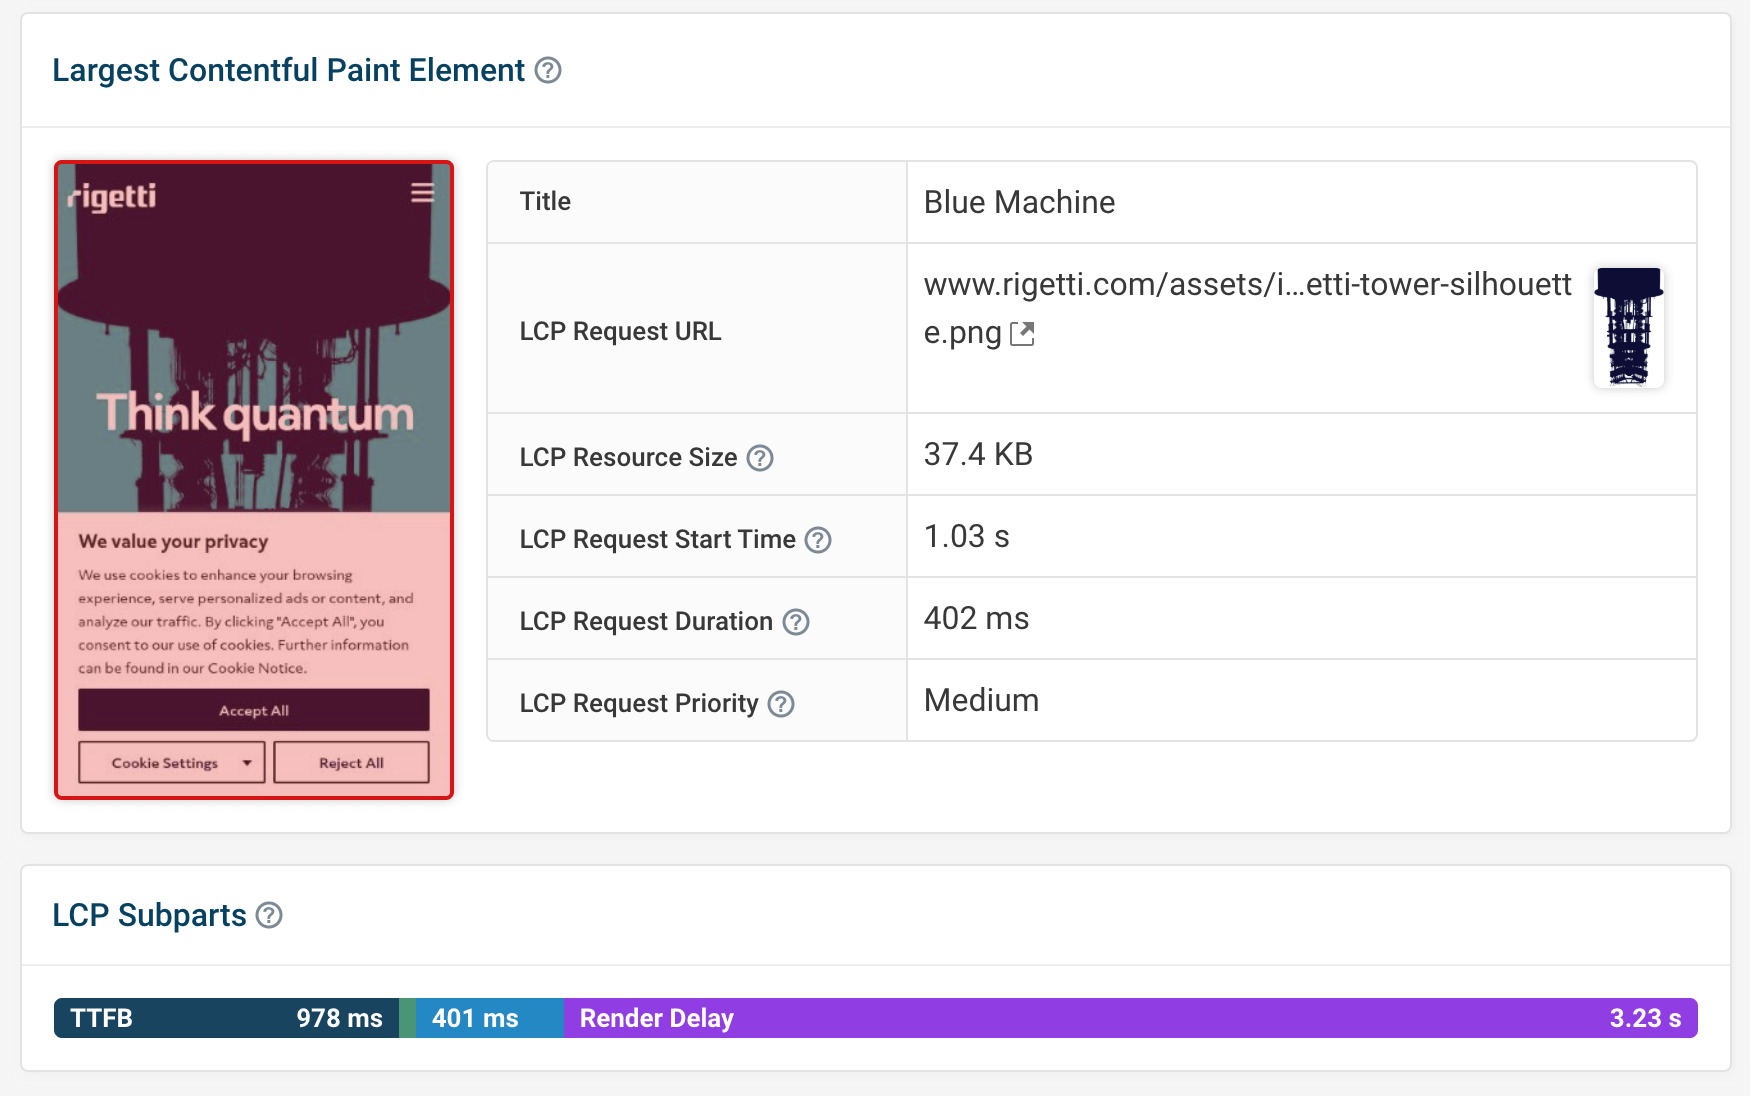
Render Blocking Request
We mentioned that blocking requests are often the most common cause of Render Delay. Let's take a closer look at render blocking in action. In this example, our lab test that replicates a slow mobile connection flags up a slow LCP score of 4.66 seconds. Below, we can see that Render Delay accounts for 3.23 seconds of this—or 69% of the total.
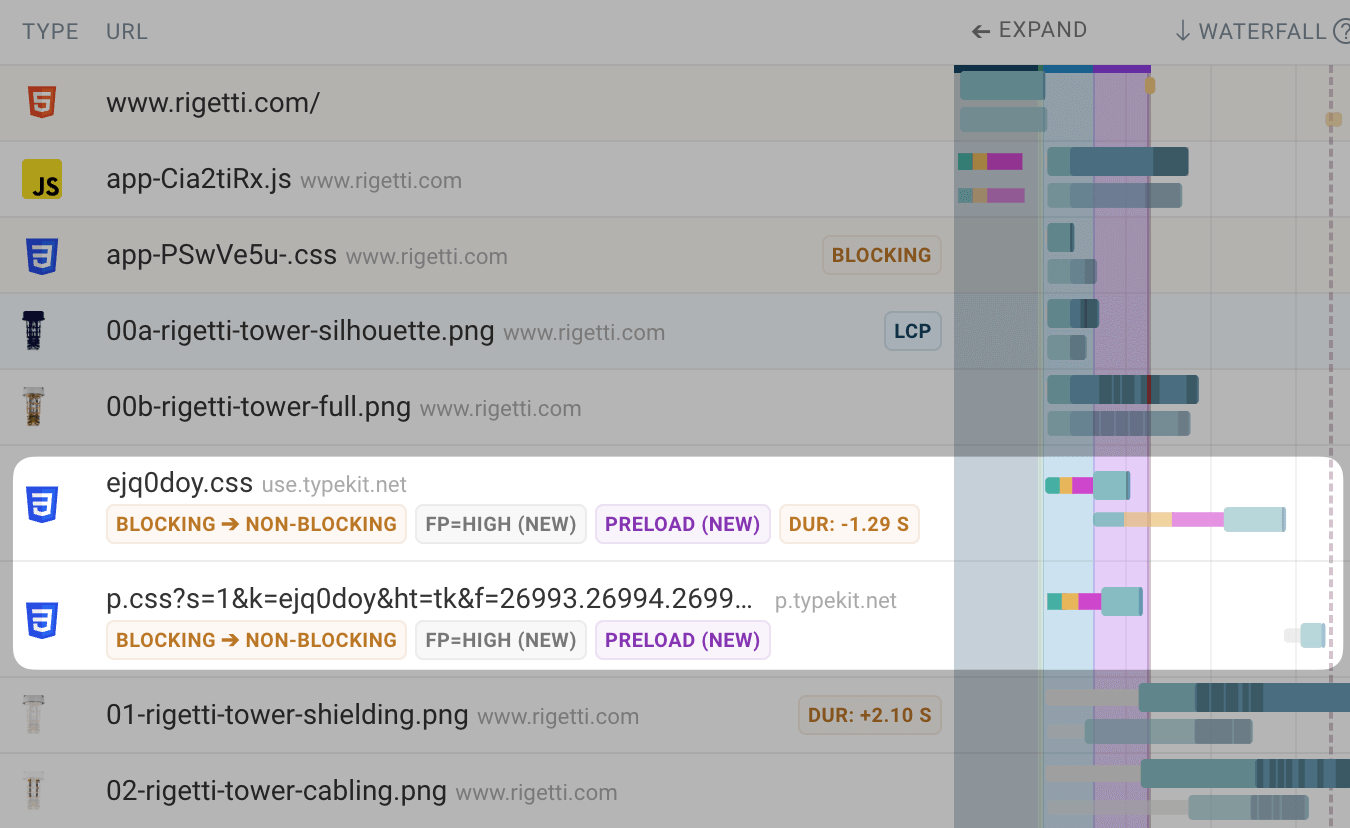
Let's analyze the request waterfall to see what's causing the Render Delay. The vertical marker to the right represents when the FCP and LCP render on the page.
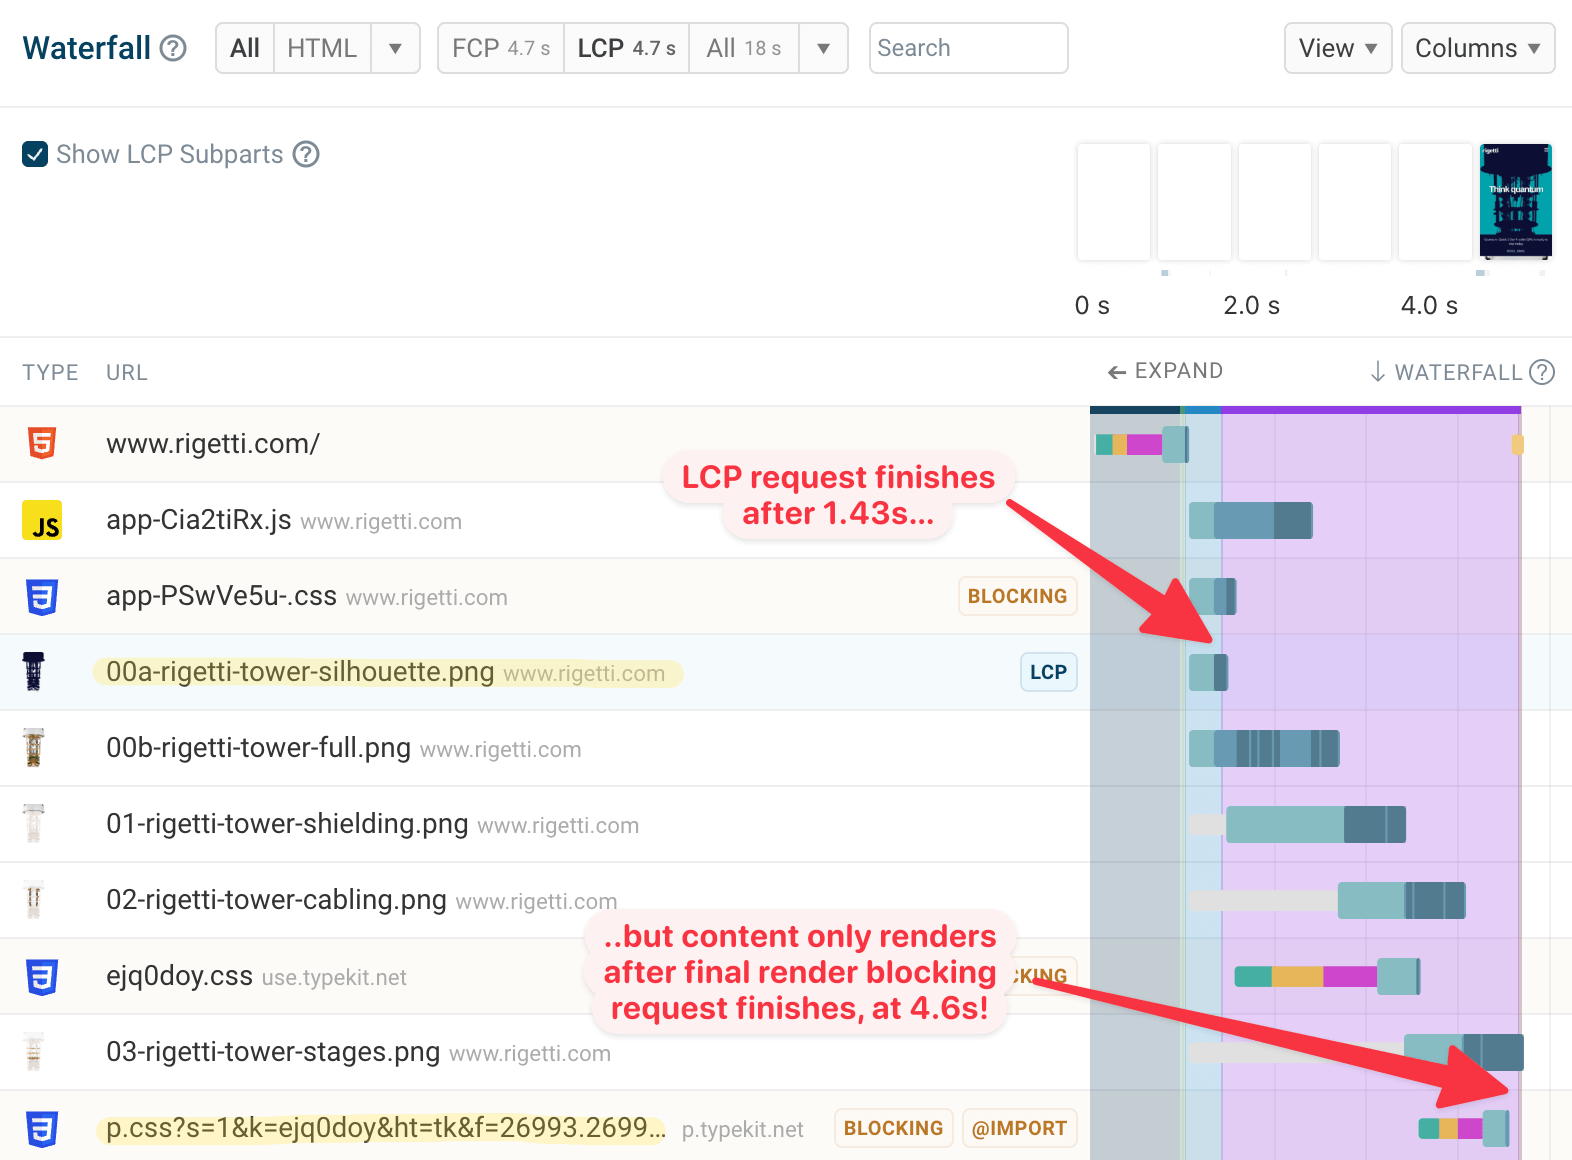
We can see the LCP image request has completed long before any content has rendered on the page. The reason why the LCP image doesn't appear immediately after the request finishes is due to two CSS stylesheets that are blocking the page from rendering. In this case, the stylesheets load slowly because they are part of a CSS @import chain.
After the stylesheet requests are complete, the LCP image is displayed.
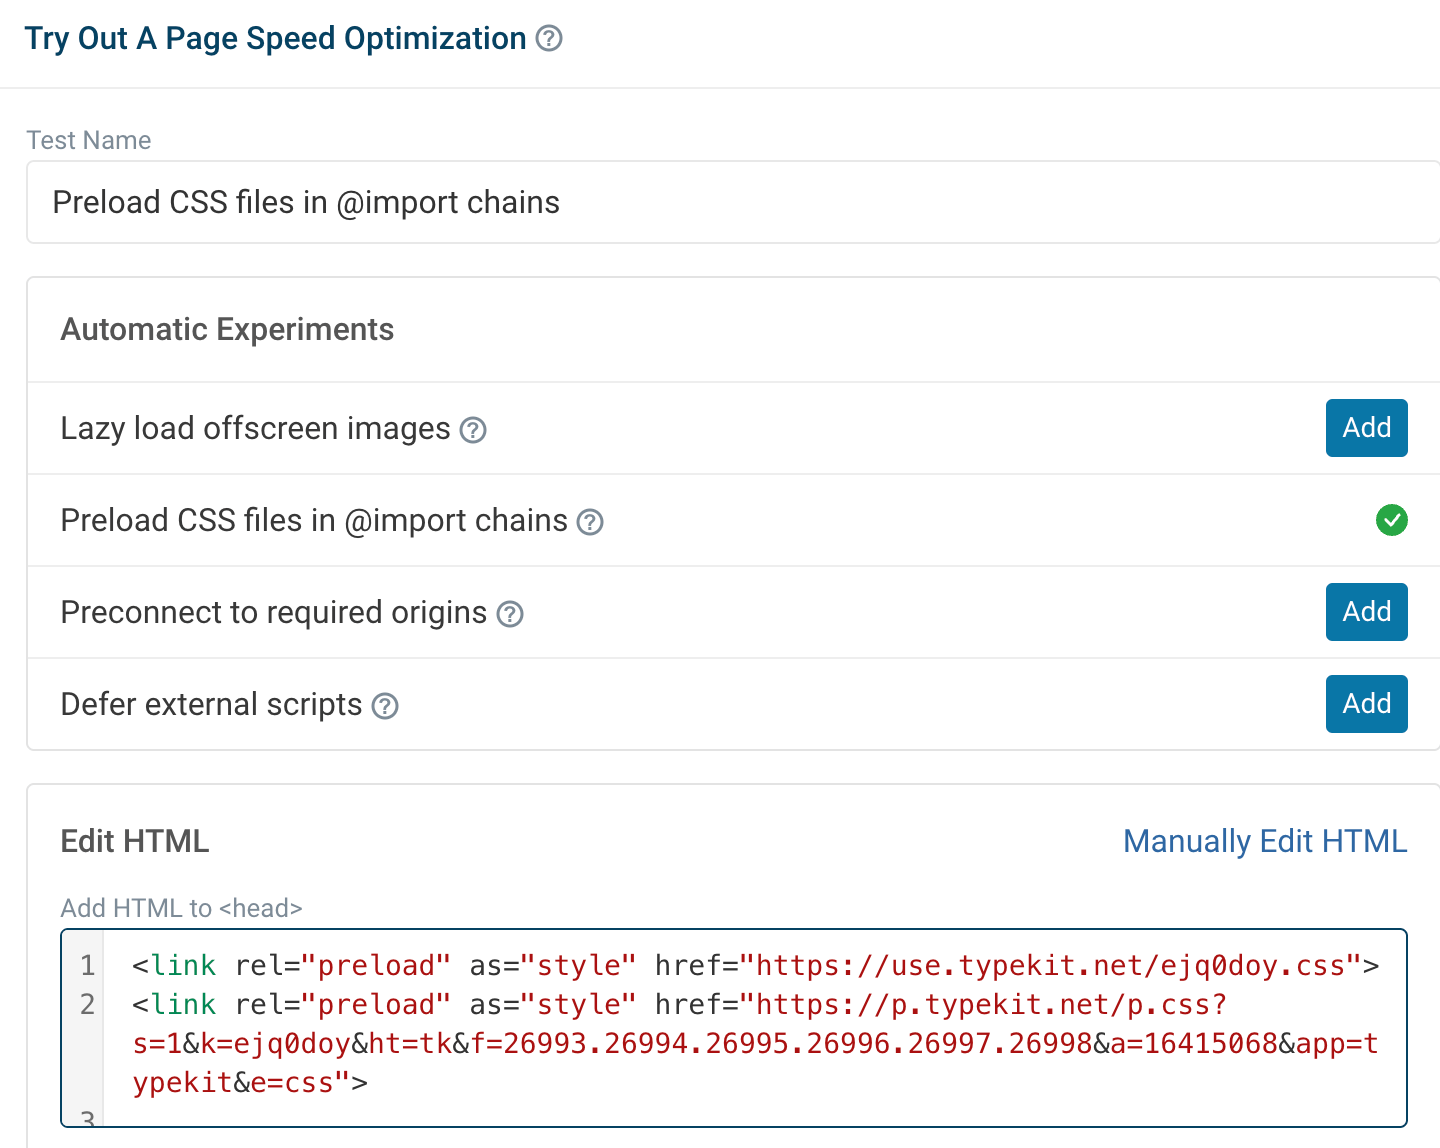
Understanding Render Delay is key to figuring out how we can make content appear sooner. To address this, we should focus on the blocking requests. Let's run a page speed experiment in DebugBear to preload the CSS requests to see if we can reduce the Render Delay.
After running the experiment, we can see we've drastically reduced our FCP and LCP scores by 48%, from 4.4s to 2.3s—that's so much faster. The render delay problem is solved.
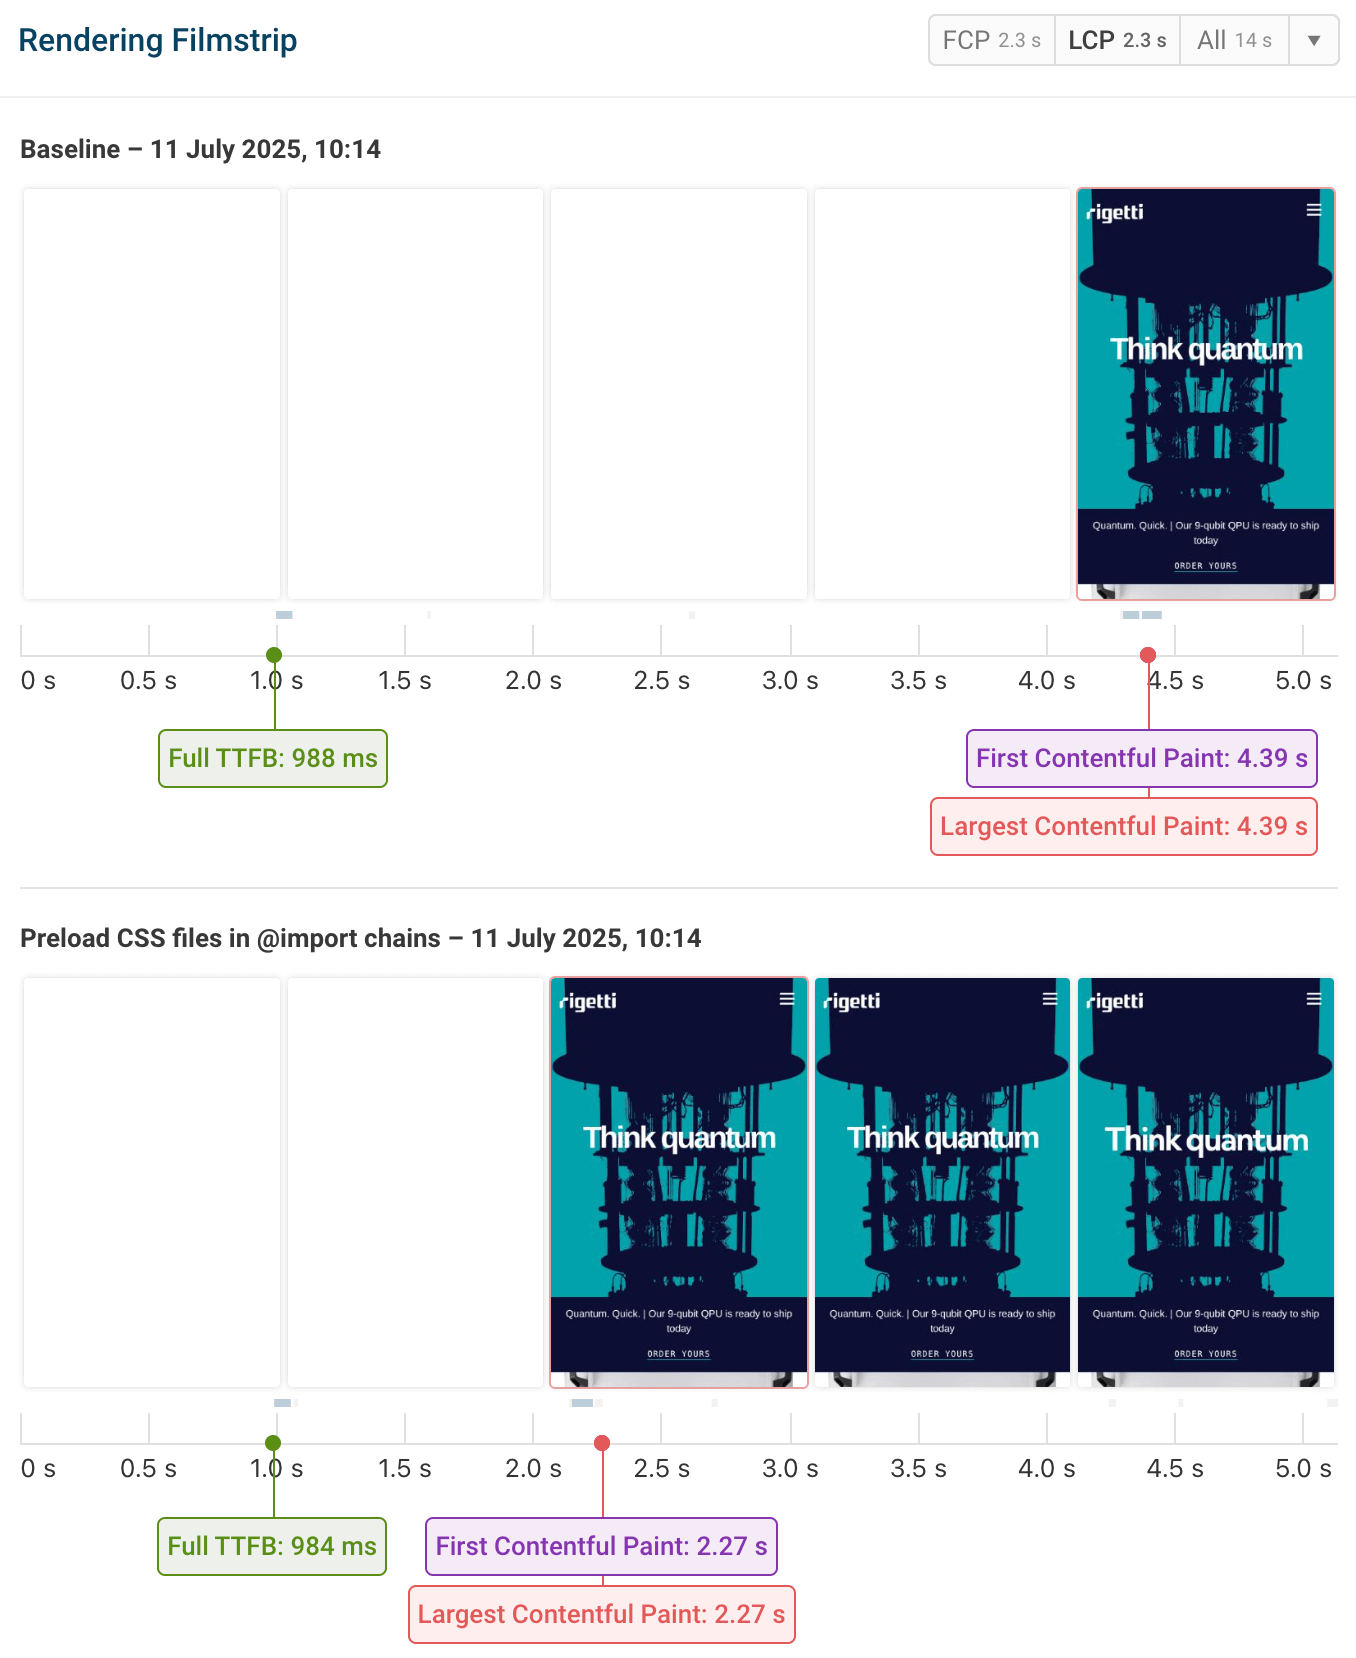
Taking a look at the detailed request waterfall reveals the blocking requests now happen much earlier, and allow the page content to display sooner.
CSS hiding content
Another common cause of Render Delay is content being blocked by CSS properties. On this page, the LCP element is an H1 heading. As a text element, it takes almost no time to download, yet the Google CrUX score for Largest Contentful Paint is poor at 4.2 seconds. Investigating the element, we can see that Render Delay accounts for 96% of the overall Largest Contentful Paint metric. Let's take a look at the page load to see what's happening.
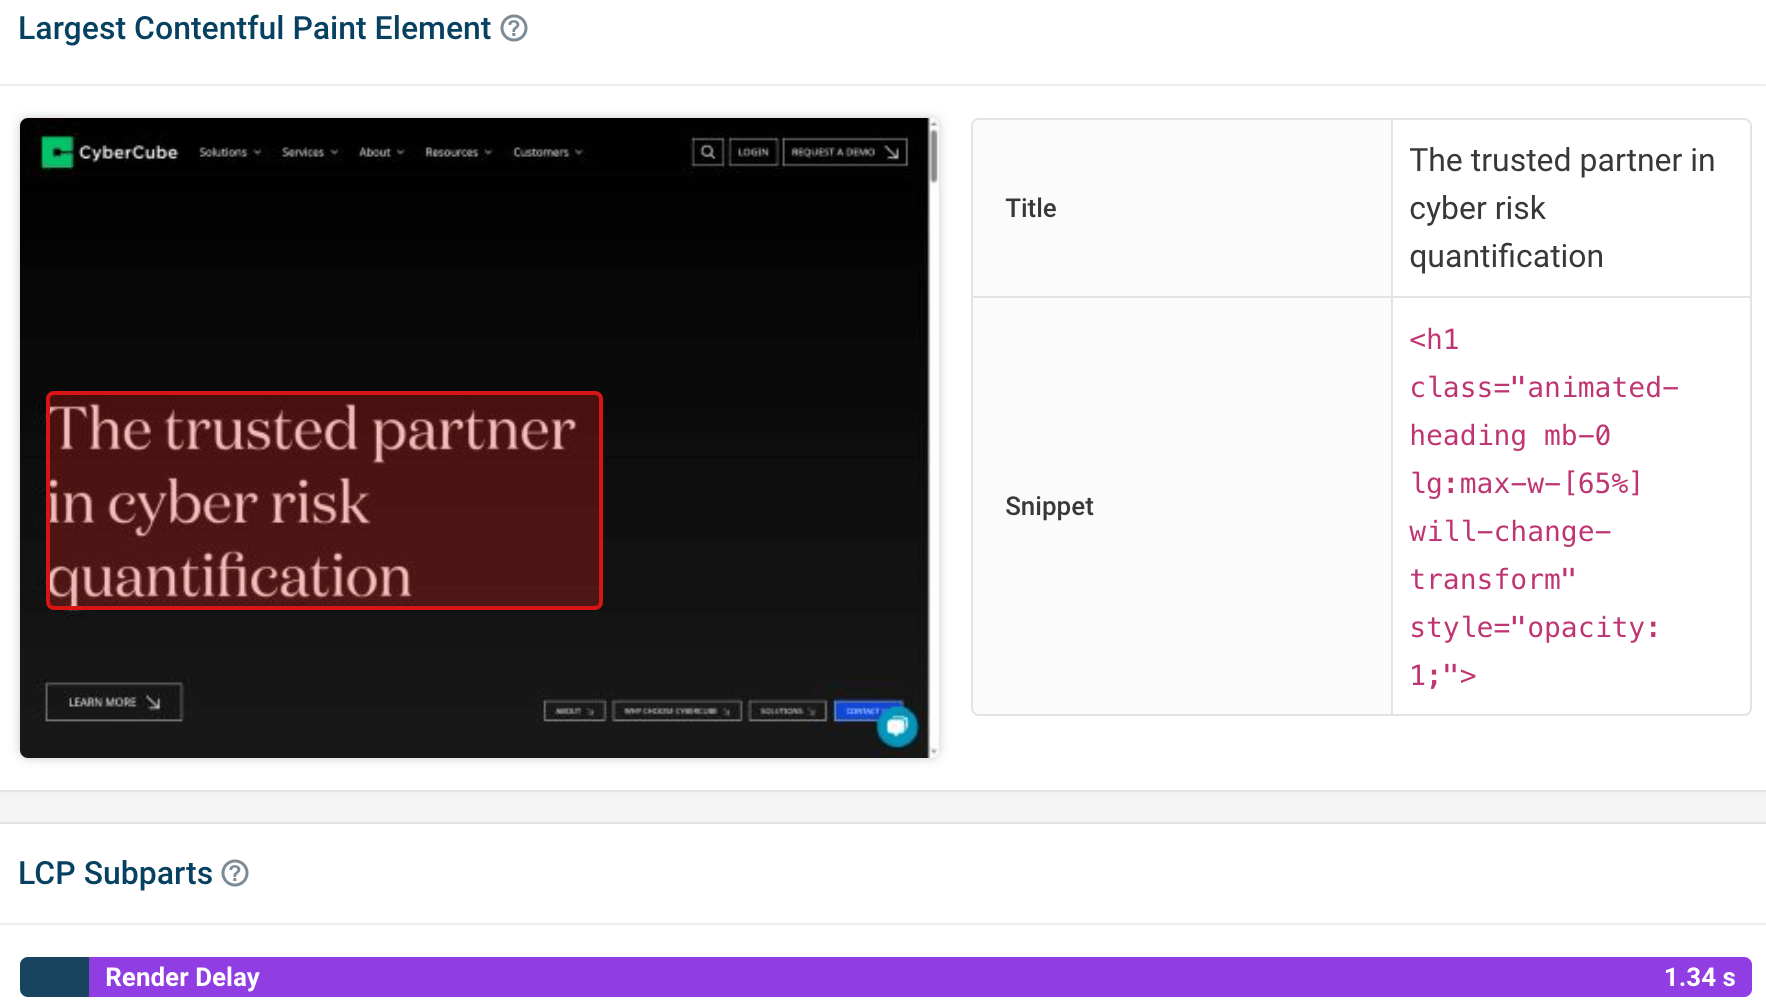
Inspecting the H1 element, the element uses the class animated-heading. This class has an opacity property value of 0. That means it won't be shown, even though it's fully ready to be displayed.
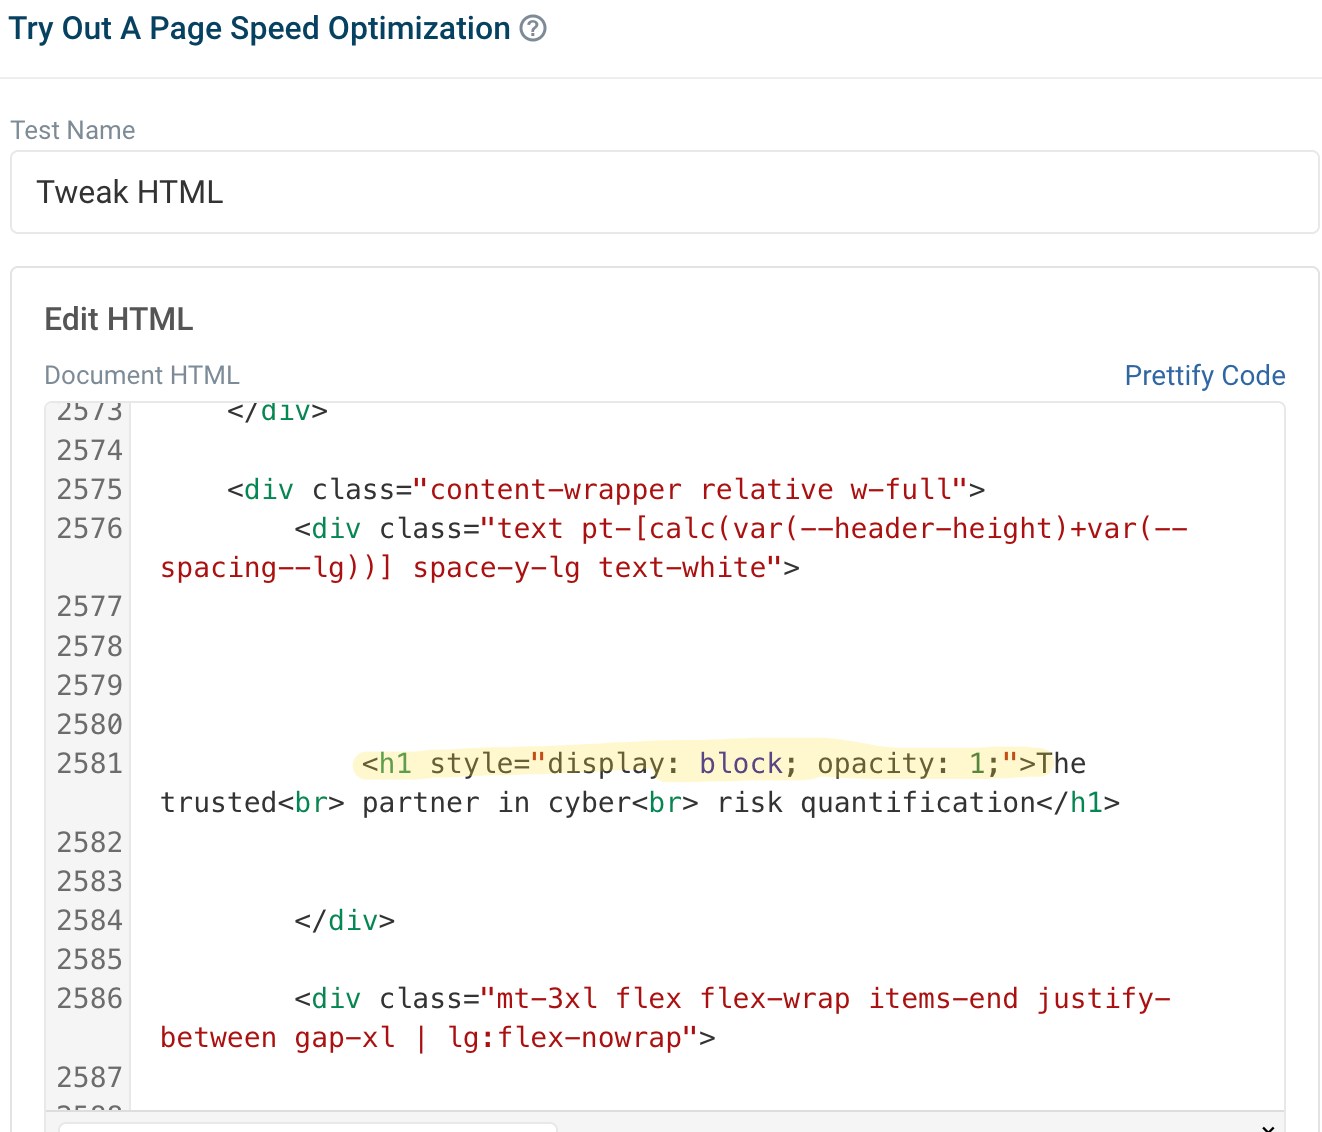
Let’s run an experiment to try and improve performance by reducing the Render Delay. We'll remove the animated-heading class from the element. We can also apply some inline styling to ensure that the element appears sooner.
Comparing the before and after filmstrips, we can see the H1 element appears much sooner. The transition no longer happens, but this is a design compromise to improve page speed.
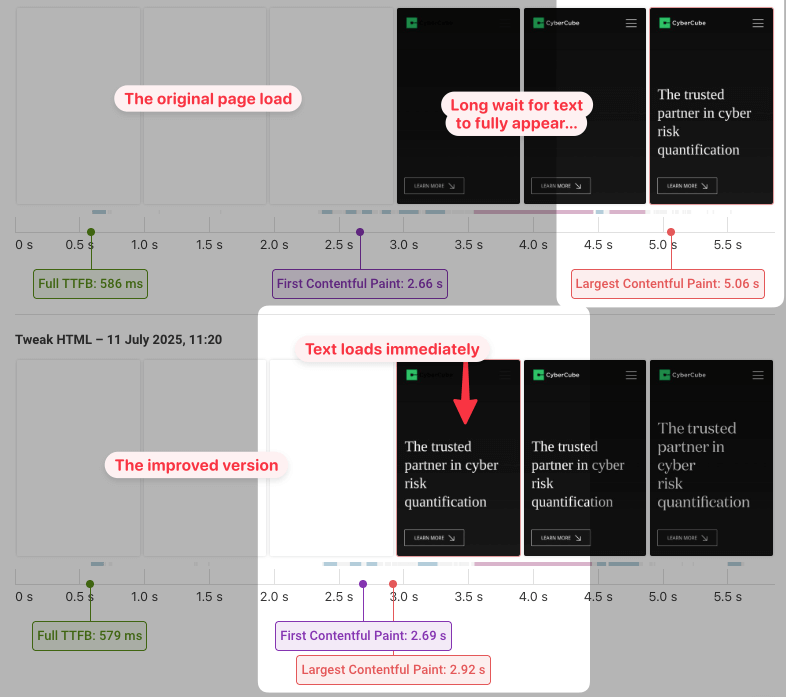
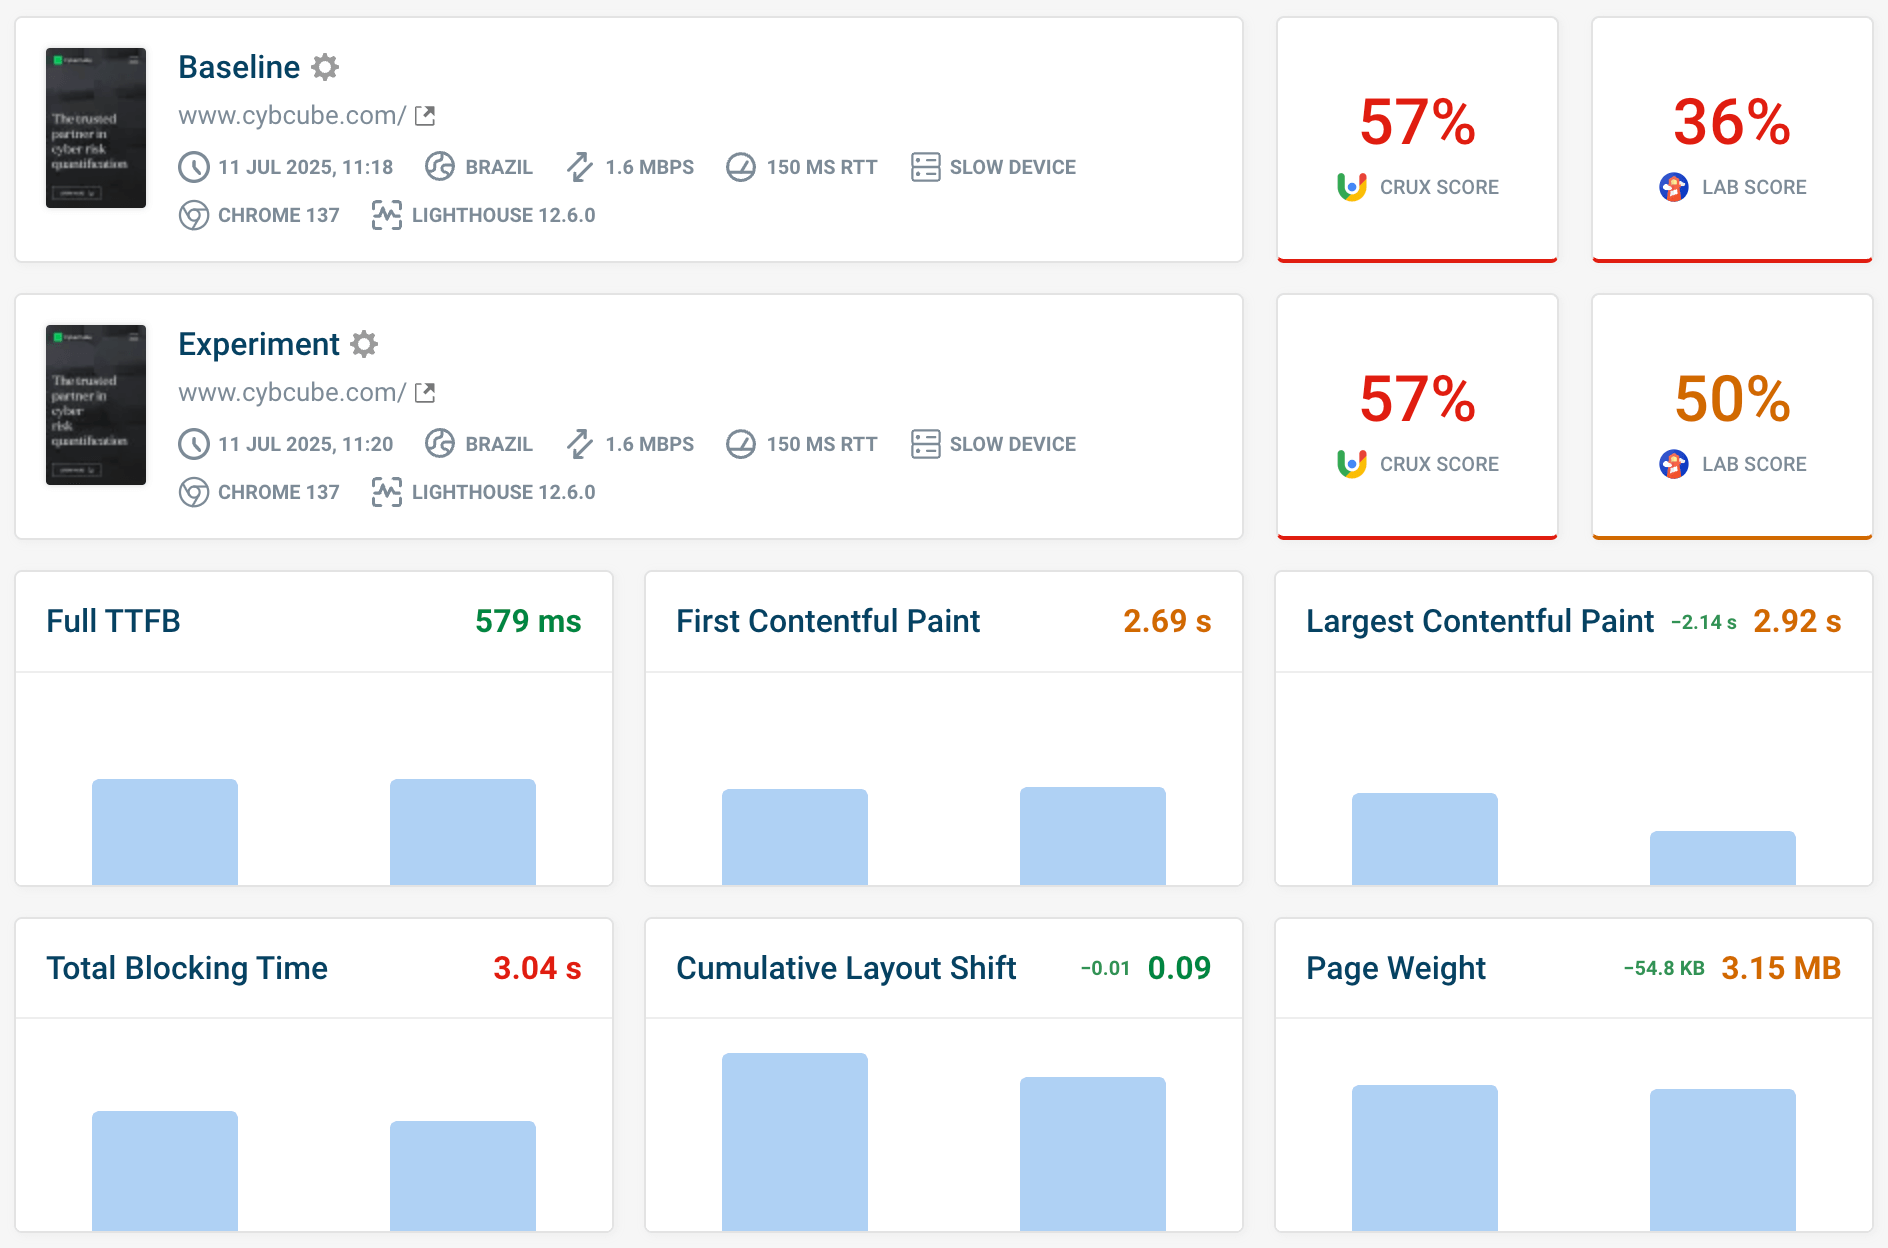
After running the experiment, the lab score has improved to 50%, and LCP has improved by over 2 seconds.
Larger content re-renders
Sometimes page content re-renders after first being shown. If the new element is even one pixel bigger, then this new time will be recorded as the LCP milestone, even if there is only minimal visual change.
A re-render might happen when a slider is initialized or when a single page app is hydrated. The LCP will then have a large render delay component.
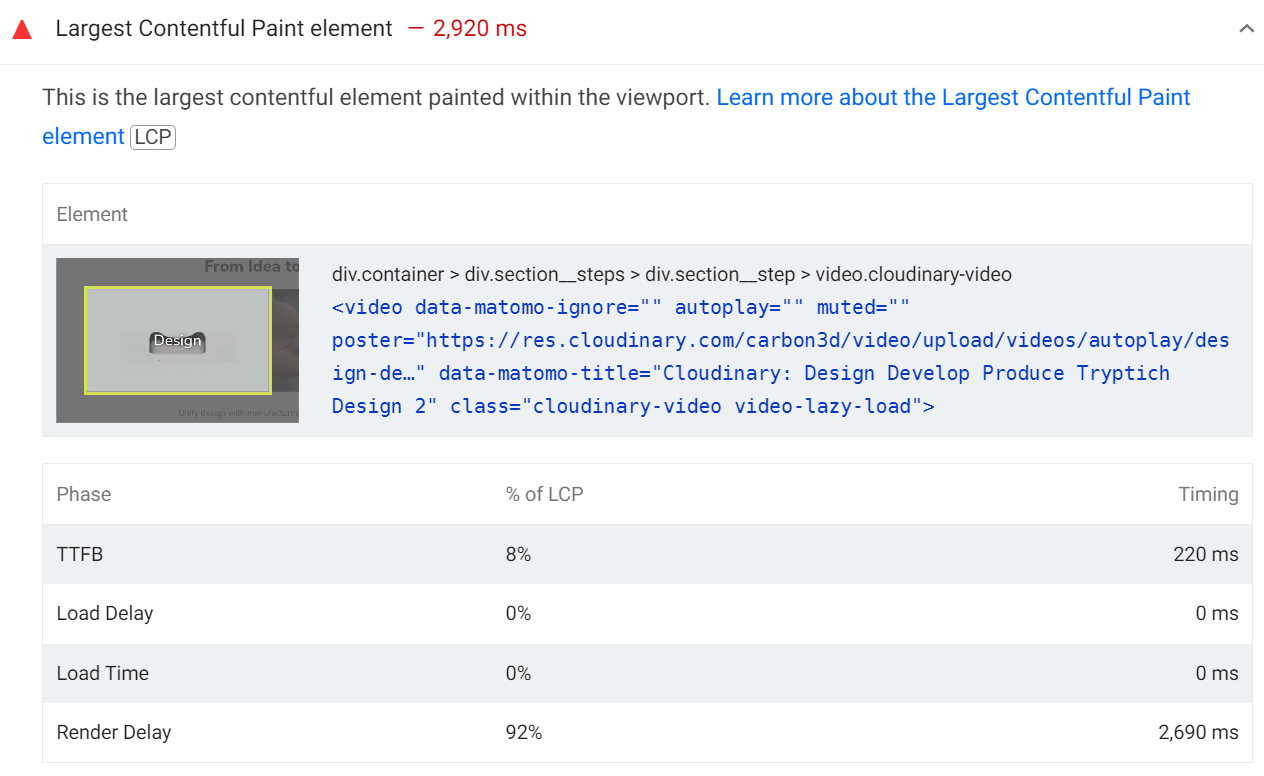
Looking at the LCP development, we can see a poster image is used to improve the LCP score. However, the first video frame is rendered at a larger size later on. In this case the poster image is not working as intended as the LCP development should end with the image.
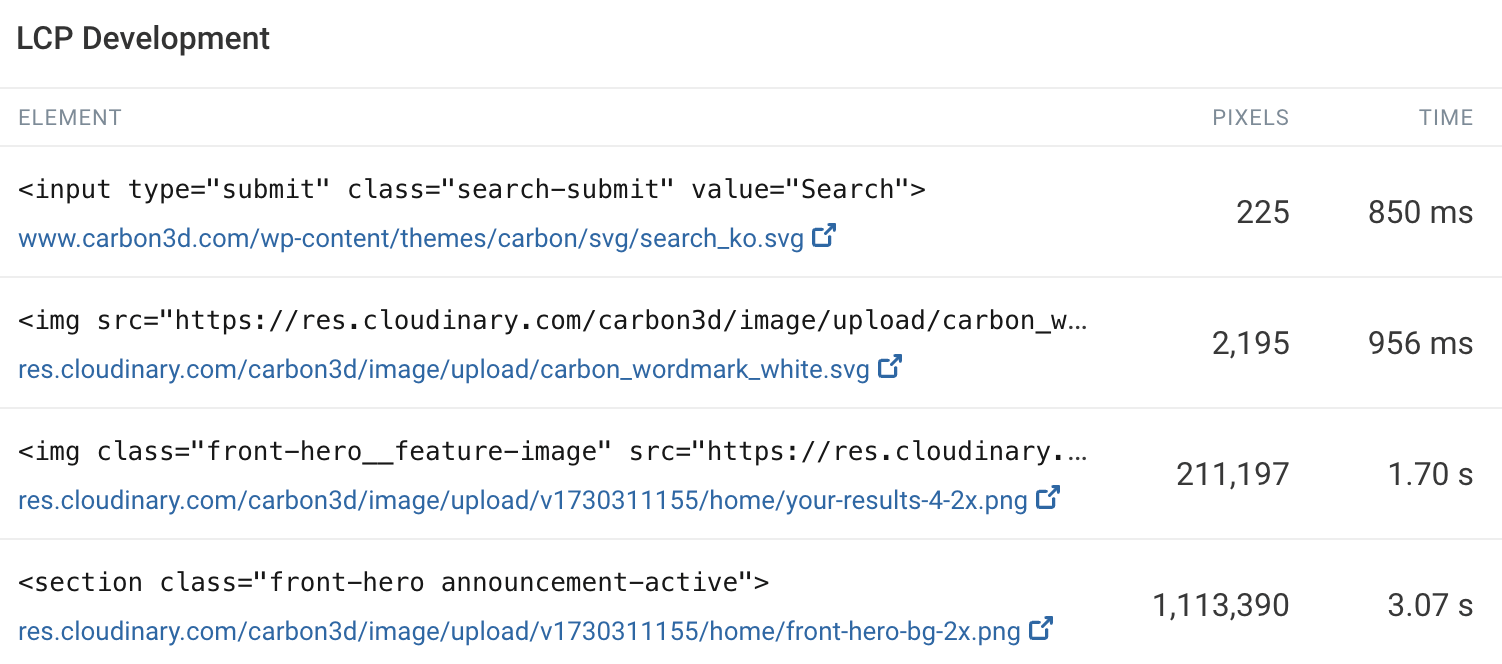
This results in a Render Delay of 92%. Learn more on how to avoid large content re-renders in our blog post.
Improving Render Delay with Real User Monitoring
Lab tests are useful for performance analysis, but they are conducted in a synthetic environment. That means they may not reflect the experiences of real users.
With DebugBear real user monitoring (RUM), LCP sub-part data is available for real visits to your website. RUM allows you to see if Render Delay is affecting LCP scores on your website.
Open the LCP dashboard to see a detailed breakdown of the sub-parts for all user visits.
We also have a dedicated Render Delay dashboard, identifying which pages are affected the most.
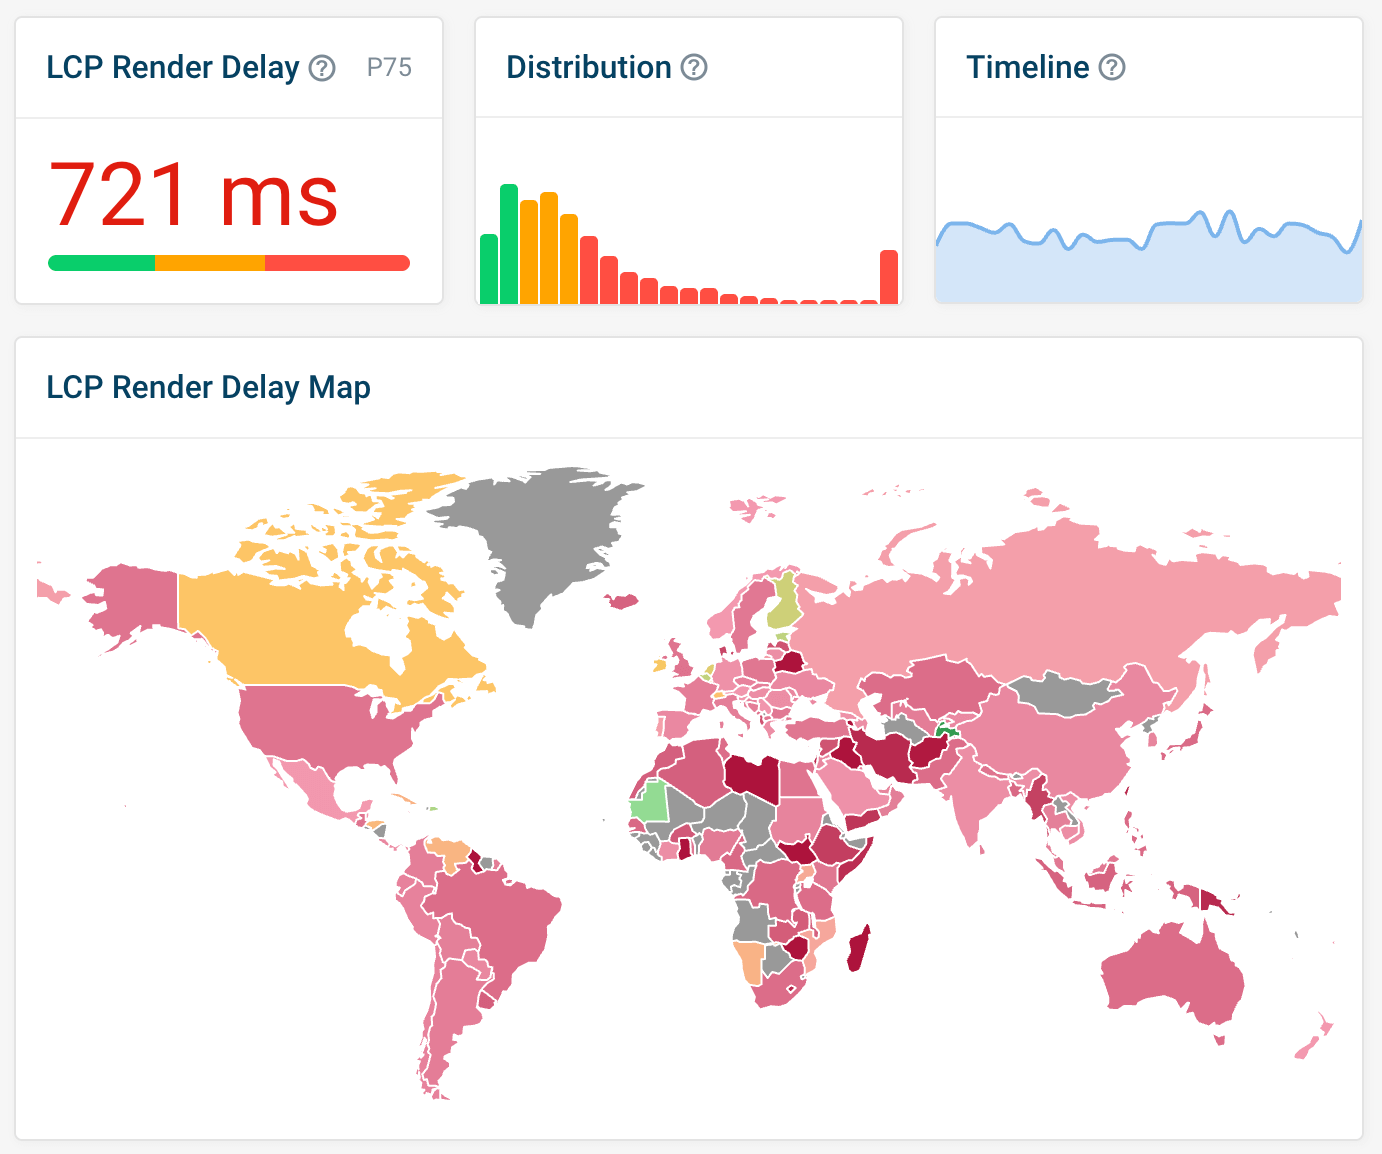
By using filters, you can find which pages and elements have poor LCP scores due to Render Delay.
Any optimizations that you make to your live site will be reflected in the recent data, as unlike with Google CrUX data, there is no delay.
Conclusion
When working to improve LCP, looking at the sub-part breakdown can better inform us on which optimizations to make.
Render delays can occur due to various reasons, like render blocking requests or specific CSS properties that prevent page content from rendering. Identifying the exact cause is vital to correcting the delay.
Try DebugBear RUM to get insight into Render Delay on your website and track your Core Web Vitals data over time.


Monitor Page Speed & Core Web Vitals
DebugBear monitoring includes:
- In-depth Page Speed Reports
- Automated Recommendations
- Real User Analytics Data