
The Largest Contentful Paint is the Core Web Vitals metric that websites most often fail.
To make optimizing LCP easier Google has started to recommend breaking the metric down into individual components called subparts. By breaking LCP down into separate load stages you can more easily identify suitable optimizations.
What are the LCP subparts?
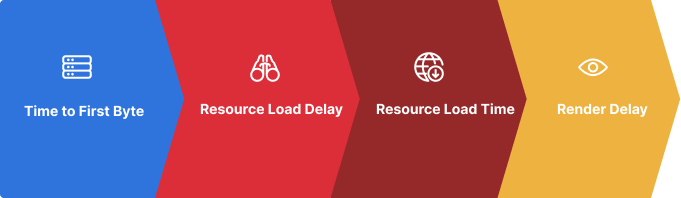
The Largest Contentful Paint metric measures how long after navigating to a page the biggest page element appears. The metric can be divided into four components:
- Time to First Byte: time to start loading the HTML document from the website server
- Resource Load Delay: time for the browser to discover the LCP image
- Resource Load Duration: time for the browser to download the LCP image
- Render Delay: time for the browser to display the LCP image or other LCP element
If the LCP element is not an image then the Resource Load Delay and the Resource Load Duration will be 0 milliseconds.
Time to First Byte (TTFB)
Time to First Byte measures how quickly a website server responds to the request for the HTML document. It includes time spent establishing a server connection, but not download time.
To reduce TTFB you can:
- Optimize database queries and rendering in your server code
- Improve server-side caching
- Use a global CDN
Resource Load Delay
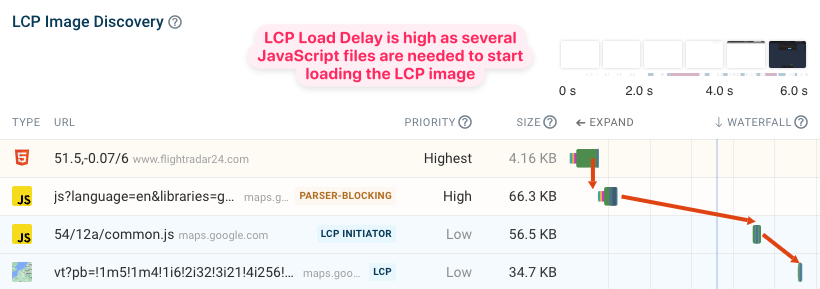
In a lot of cases, the Largest Contentful Paint is triggered by an image element on the page. The Resource Load Delay measures how soon after receiving the server response the browser discovers the image resource and can start downloading it.
Resource Load Delay will be low if you just use a simple <img> tag in your HTML code. However, if you use libraries for lazy loading or if your website is a single-page JavaScript application then it may take longer before the browser finds the LCP image.
A request waterfall visualization can help you identify when a request is only made late on the page load process.
To improve LCP Resource Load Delay you can:
- Reference the image directly in the page HTML
- Use the
fetchpriority="high"attribute to make sure it gets prioritized
Resource Load Duration
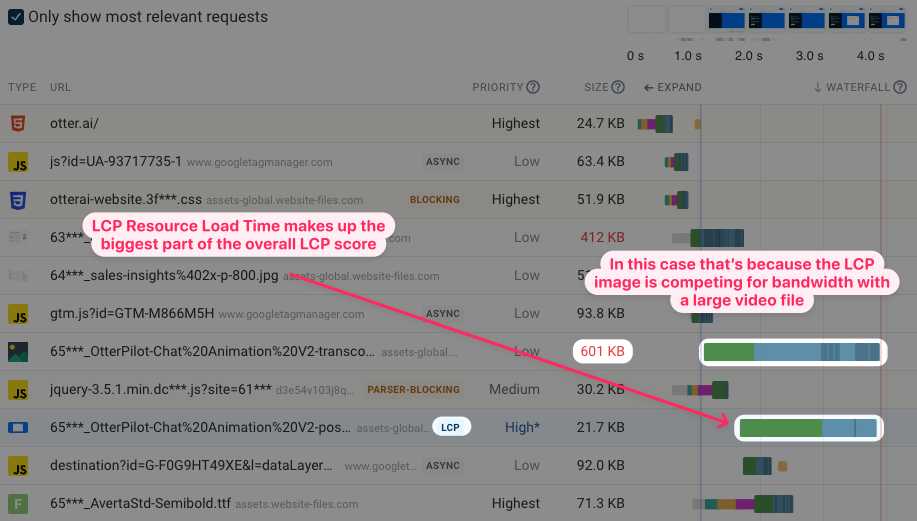
If the LCP element is an image then the resource load time measures how long it takes to download this image. The larger the image the longer it will take to download.
The size of the image is not the only factor impacting Resource Load Duration. If the page is also loading other resources at the same time this can cause bandwidth competition on the network. Here you can see that a large MP4 video file is delaying the LCP image.
Resource Load Duration is sometimes also called Resource Load Time.
To improve LCP Resource Load Duration you can:
- Use modern image formats that provide better compression
- Use responsive images to download image files at an appropriate resolution for the user device
- Consider lazy-loading less important images on the page to reduce bandwidth competition
Render Delay
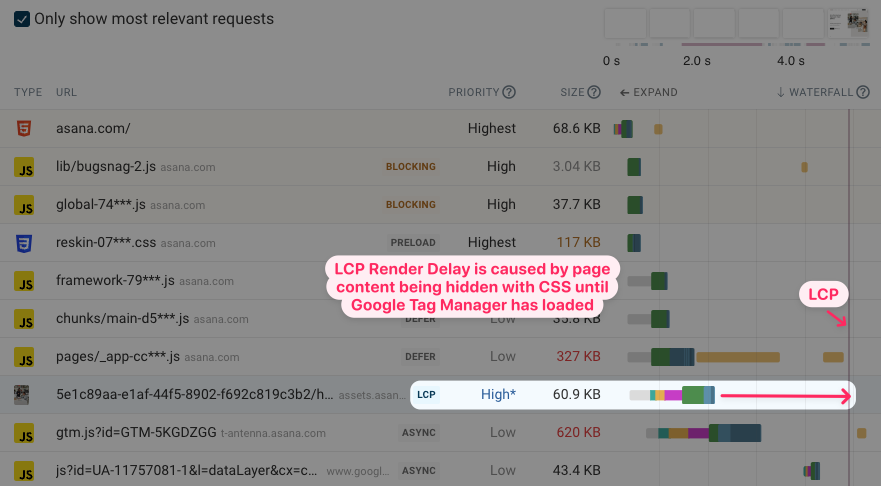
The Render Delay LCP subpart measures how long it takes for the LCP element to become visible. It applies to both LCP images and other types of LCP elements.
For LCP images, render delay may be caused when preloading the image resource. The image may be downloaded while there are still render-blocking resources being loaded or while content is hidden using CSS.
For other types of LCP elements Render Delay will generally be higher as no time is allocated to Load Delay and Load Duration. Render-blocking resources and JavaScript-generated content will have an especially high impact here.
To improve LCP Render Delay you can:
- Reduce render-blocking resources
- Use server-side rendering
- Avoid anti-flicker snippets
How to view LCP subparts in DebugBear
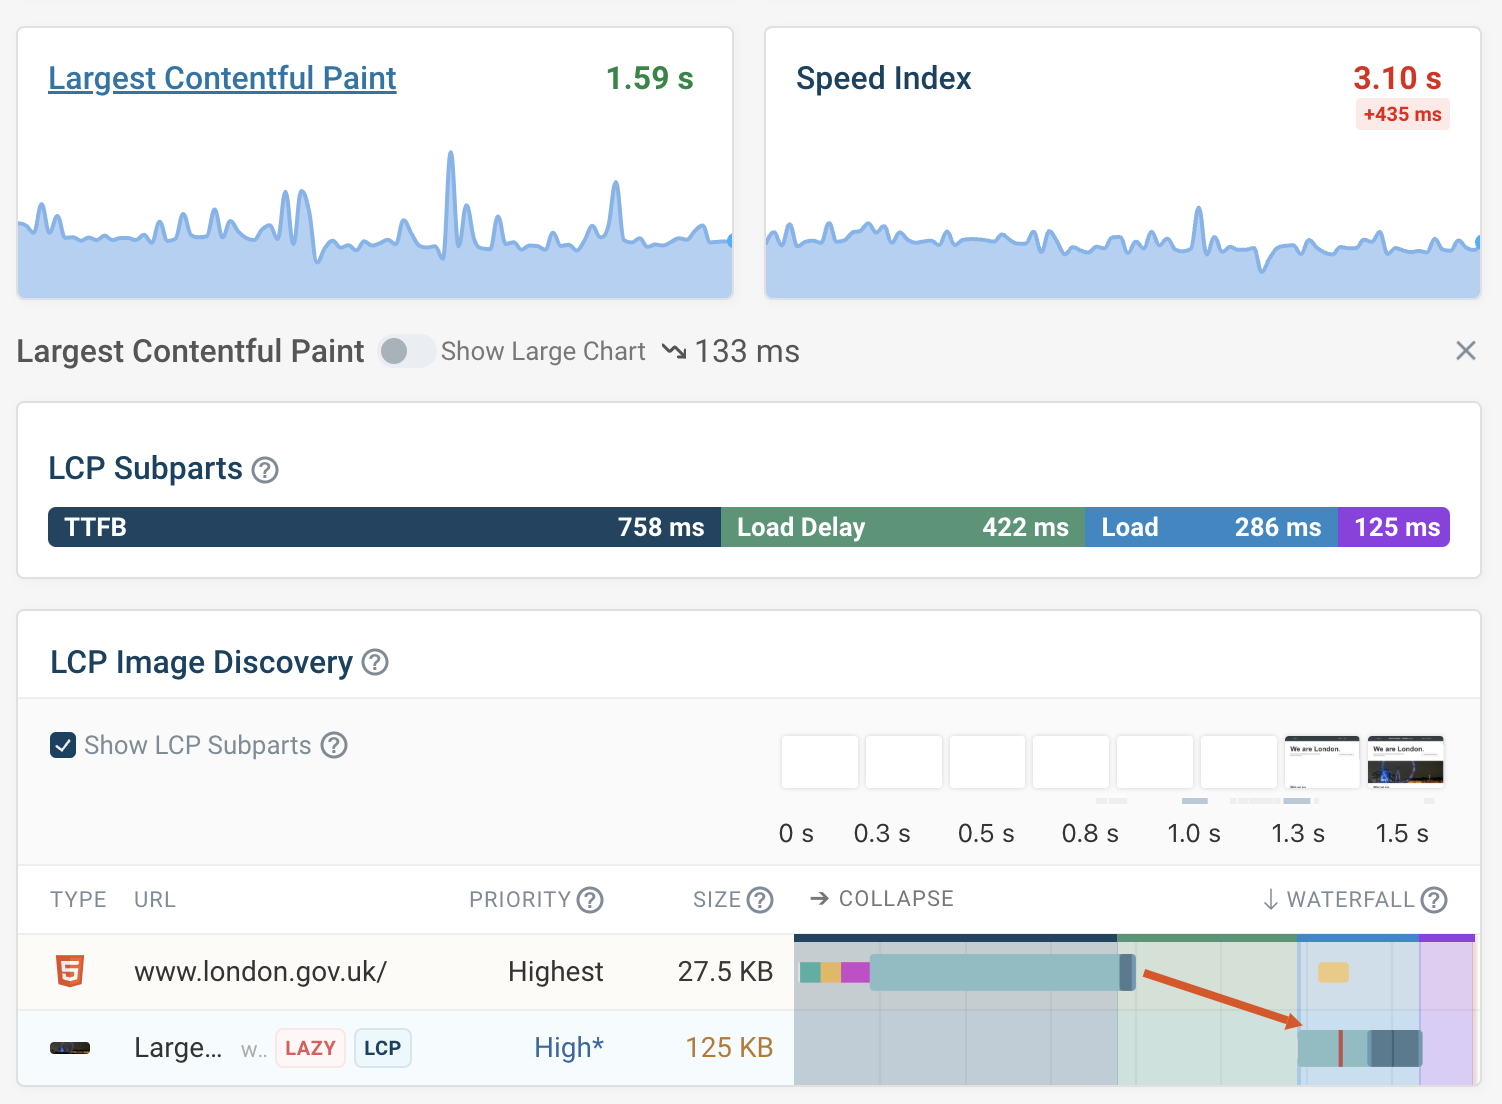
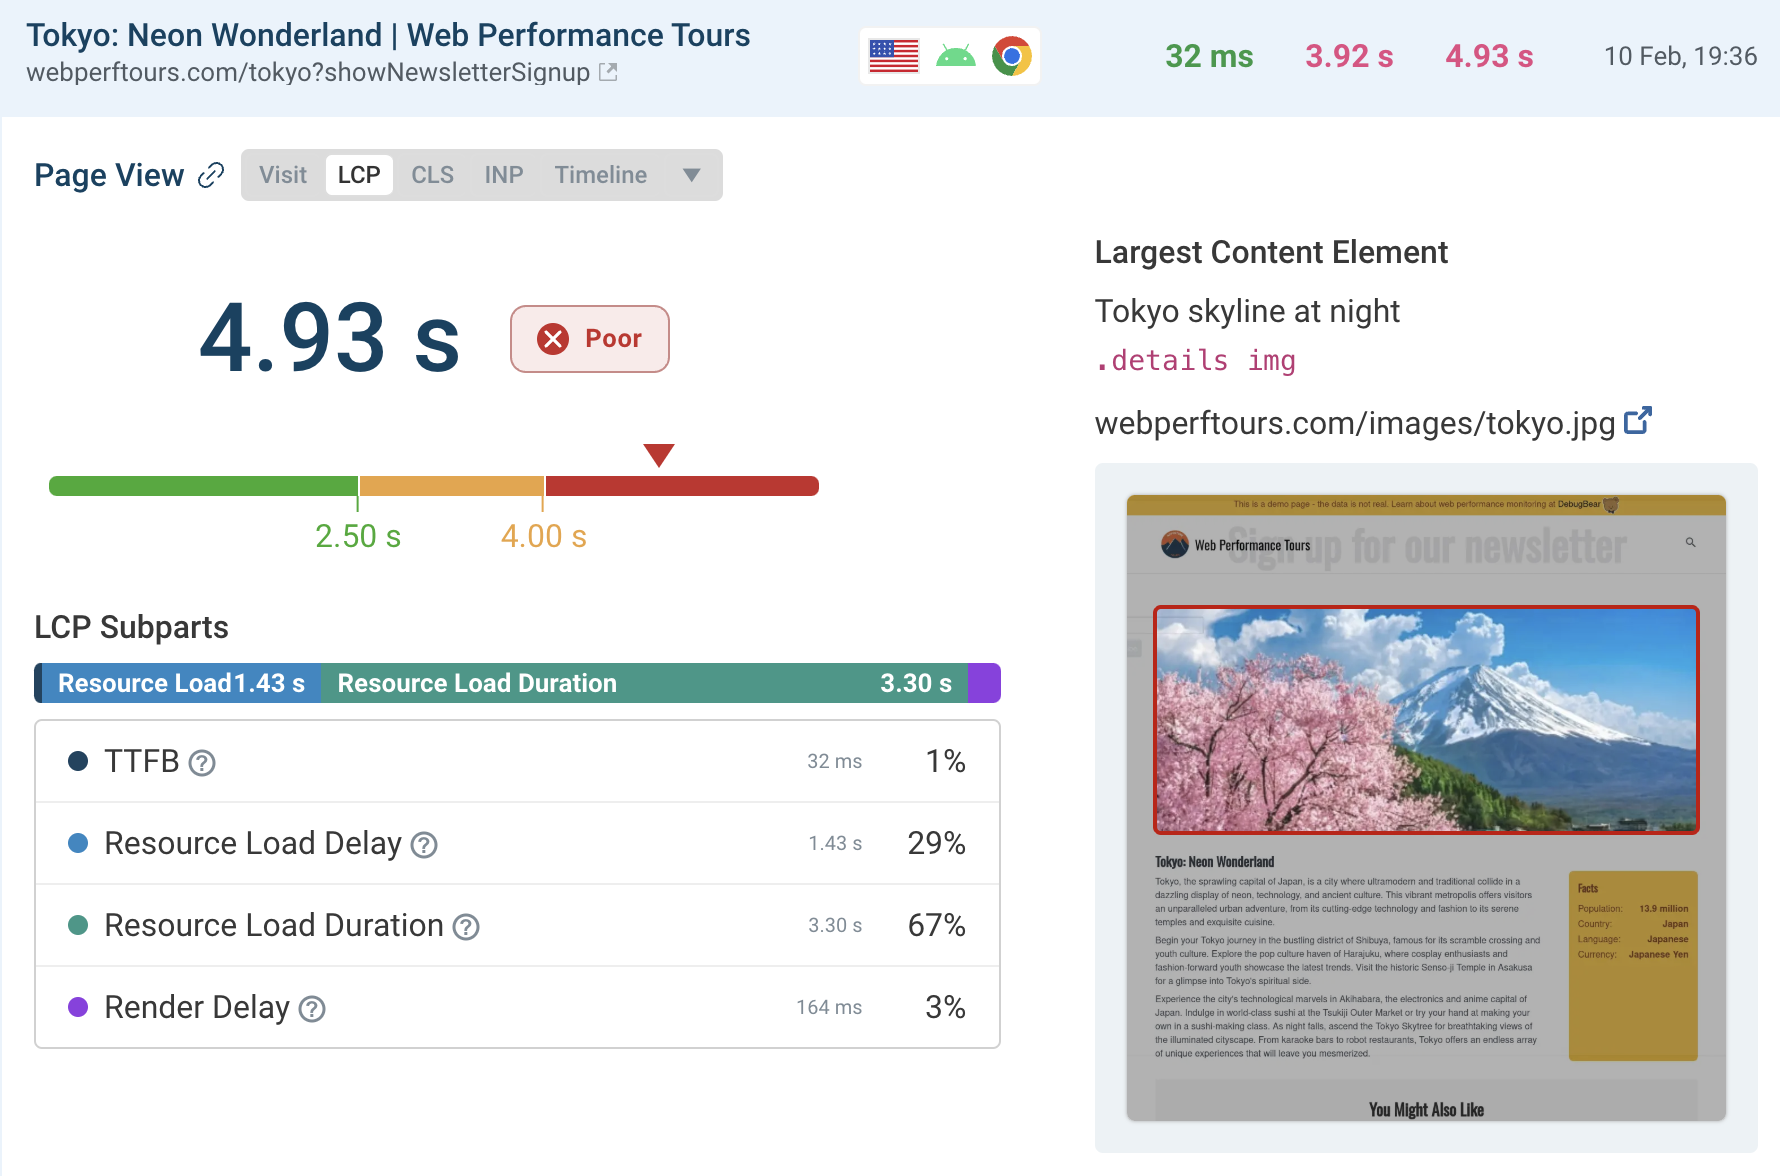
If you use DebugBear synthetic website monitoring or the free website speed test, you can view the subpart breakdown when inspecting the Largest Contentful Paint metric.
Click on the LCP metric title to view the duration for each subpart as well as a request waterfall that's annotated with the subpart timings.
How to measure LCP subparts with Lighthouse
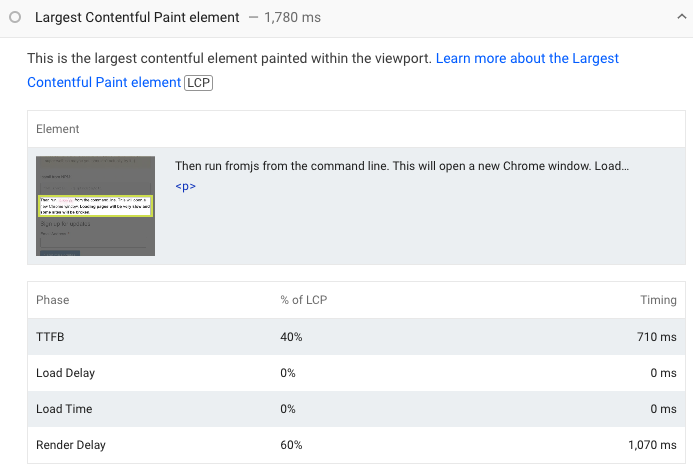
To see the LCP breakdown in Lighthouse, find the Diagnostics section of the Performance score and look for the Largest Contentful Paint Element audit.
This won't just show the LCP element but also the subpart breakdown (although Lighthouse calls them phases).
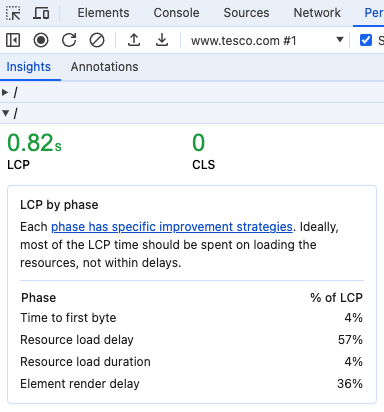
Viewing LCP by phase in Chrome DevTools
Google has been rolling out a number of improvements to Chrome's developer tools. That includes a new LCP by phase breakdown as part of the Performance tab.
To view the phase breakdown:
- Open DevTools
- Select the Performance tab
- Record a performance profile
- Expand the sidebar on the right
- Click LCP by phase
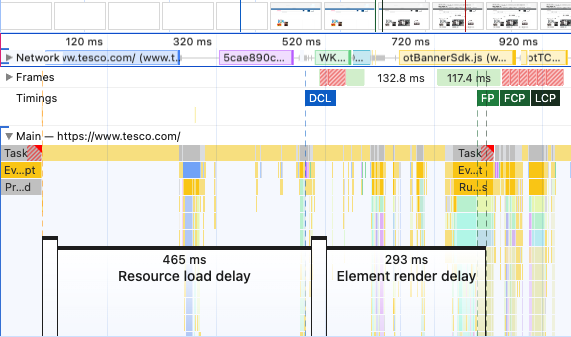
DevTools then also highlights the different LCP phases as part of the profiling data.
How to monitor real user LCP subparts
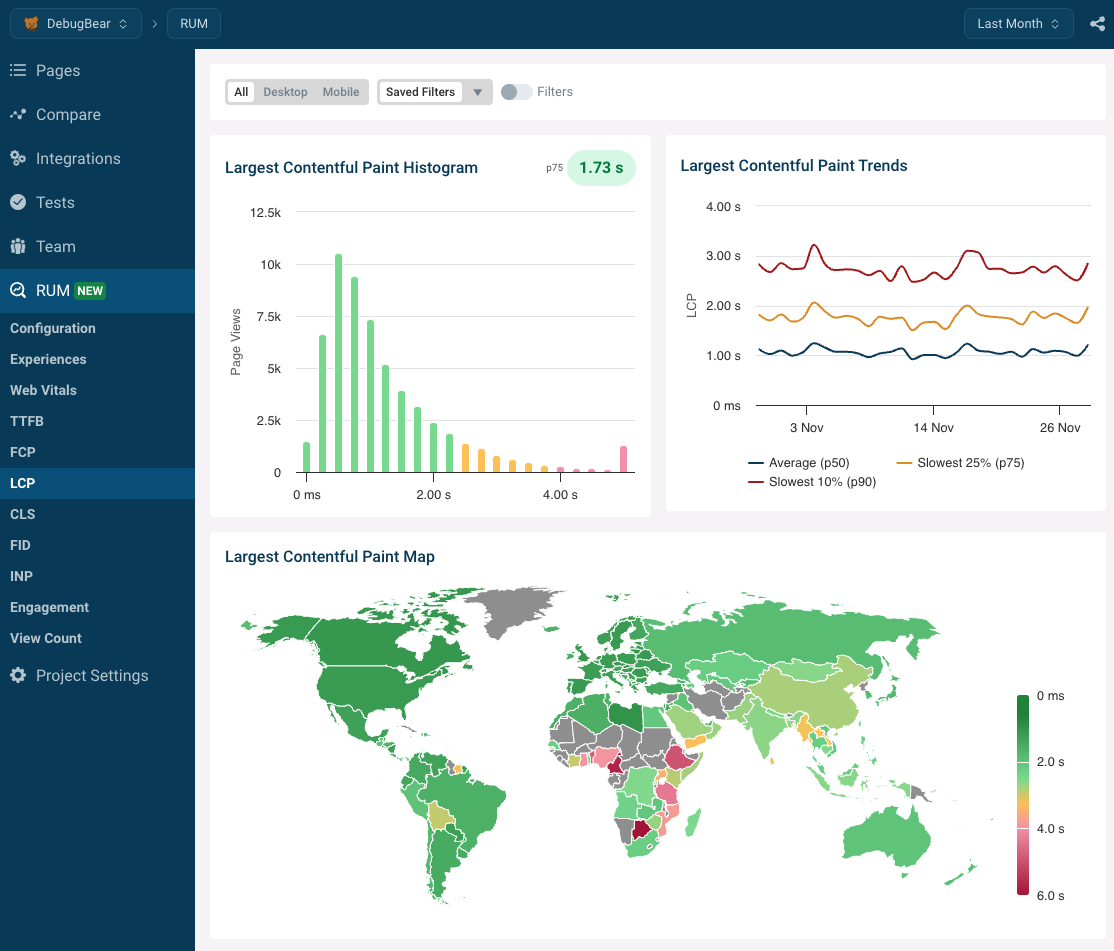
DebugBear real-user monitoring (RUM) can report LCP subpart timings for visitors on your website. The LCP metric dashboard provides a breakdown of the LCP metric.
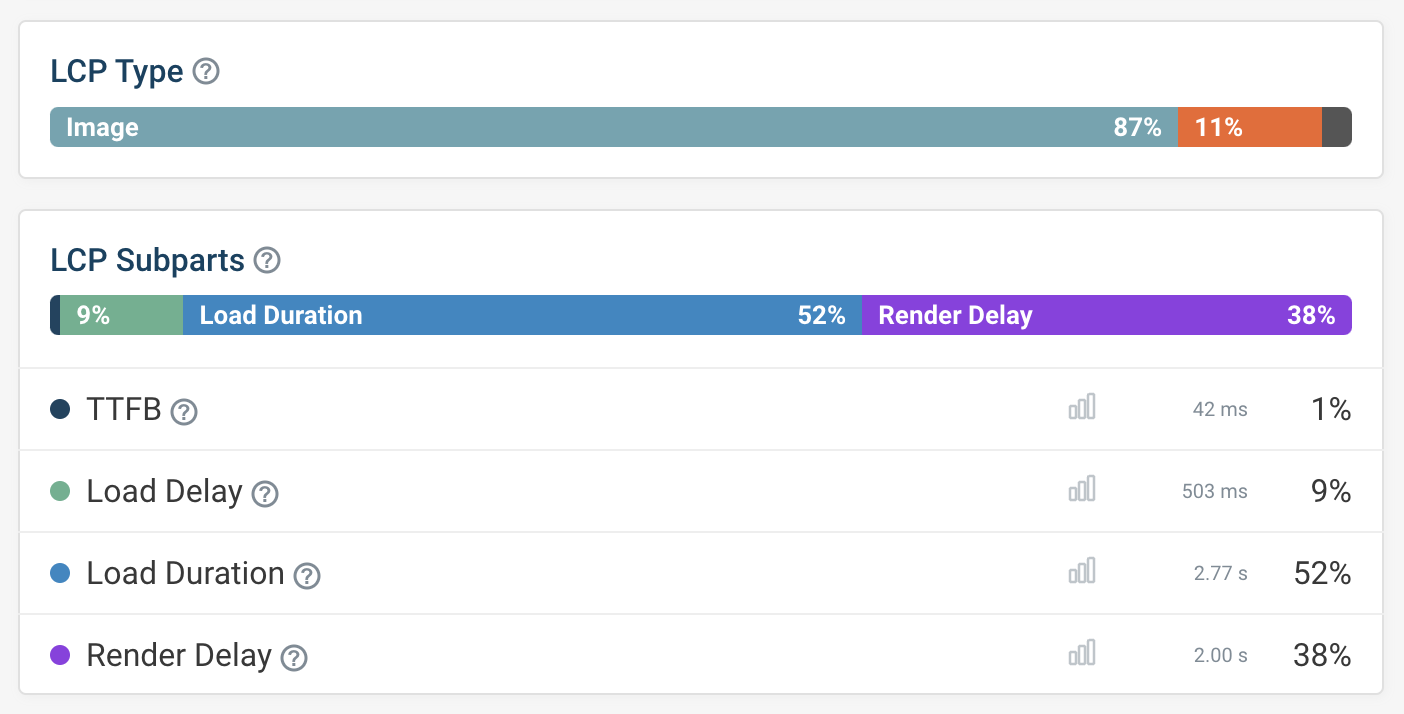
You can also look at individual user experiences to see what LCP component slowed down their page load time.
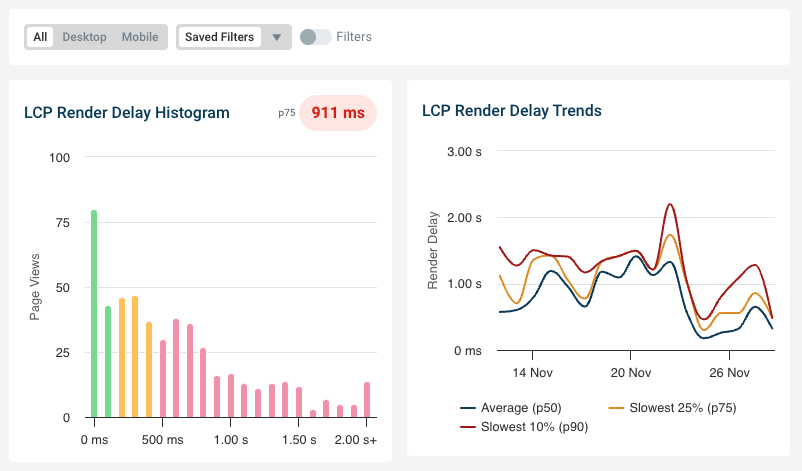
DebugBear RUM provides detailed dashboards for each LCP subpart. See how scores are distributed across your visitors, how scores are trending over time, and if specific pages are doing especially poorly.
What LCP subpart breakdown should you aim for?
If the LCP element is an image you want to keep the Resource Load Delay and Render Delay as short as possible. Google suggests that these two components together should not account for more than 20% of your overall LCP score.
That leaves 40% each for the TTFB and LCP Resource Load Duration. Unlike the delay subparts these two components are almost unavoidable when an image is the largest content element.
What does the LCP breakdown look like for real users?
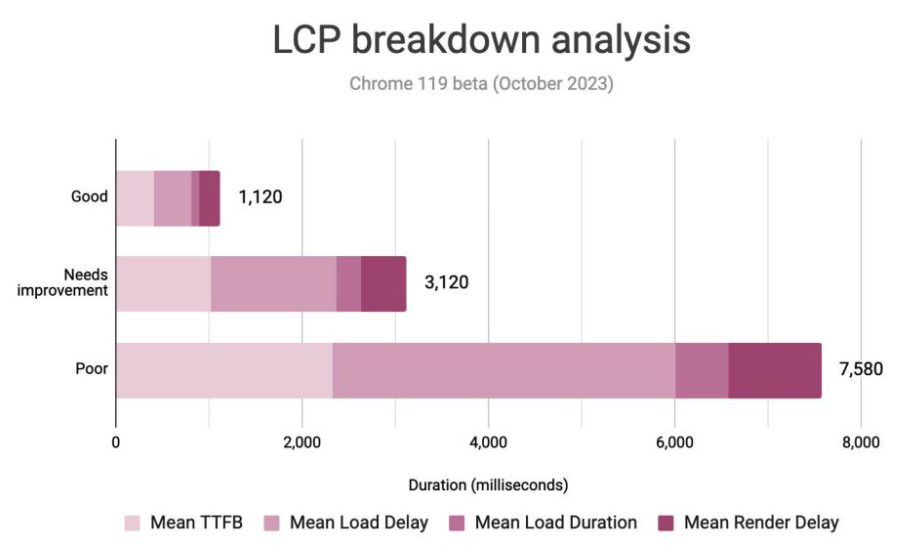
Google has provided LCP subpart data for real users based on the Chrome User Experience Report (CrUX) dataset. You can find the data in this talk by Estela Franco.
This shows that for slow pages the Load Delay component, where the browser doesn't know about the LCP image yet, significantly contributes to the overall LCP.
For fast pages loading the image is rarely a significant LCP contributor.
Monitor your Core Web Vitals
DebugBear helps you test your website speed and monitor web performance over time. Start a free trial to find out how to speed up your website.


Monitor Page Speed & Core Web Vitals
DebugBear monitoring includes:
- In-depth Page Speed Reports
- Automated Recommendations
- Real User Analytics Data