This article compares two approaches to monitoring website performance: lab-based monitoring and collecting field data from real users.
Lab-based monitoring is done by a server regularly loading your page and analyzing its performance. Another common name for this is synthetic monitoring. This is what tools like PageSpeed Insights, WebPageTest, or DebugBear do.
Field data is collected in the browser every time a user loads one of your pages. Code on your website captures performance metrics and sends this data to your server. This is also called real-user monitoring (RUM).
How fast is my site for users?
Real user field data lets you accurately determine how fast your site loads. You can say things like "The site fully loads within 4s for 95% of users", or see a distribution of page load experiences.
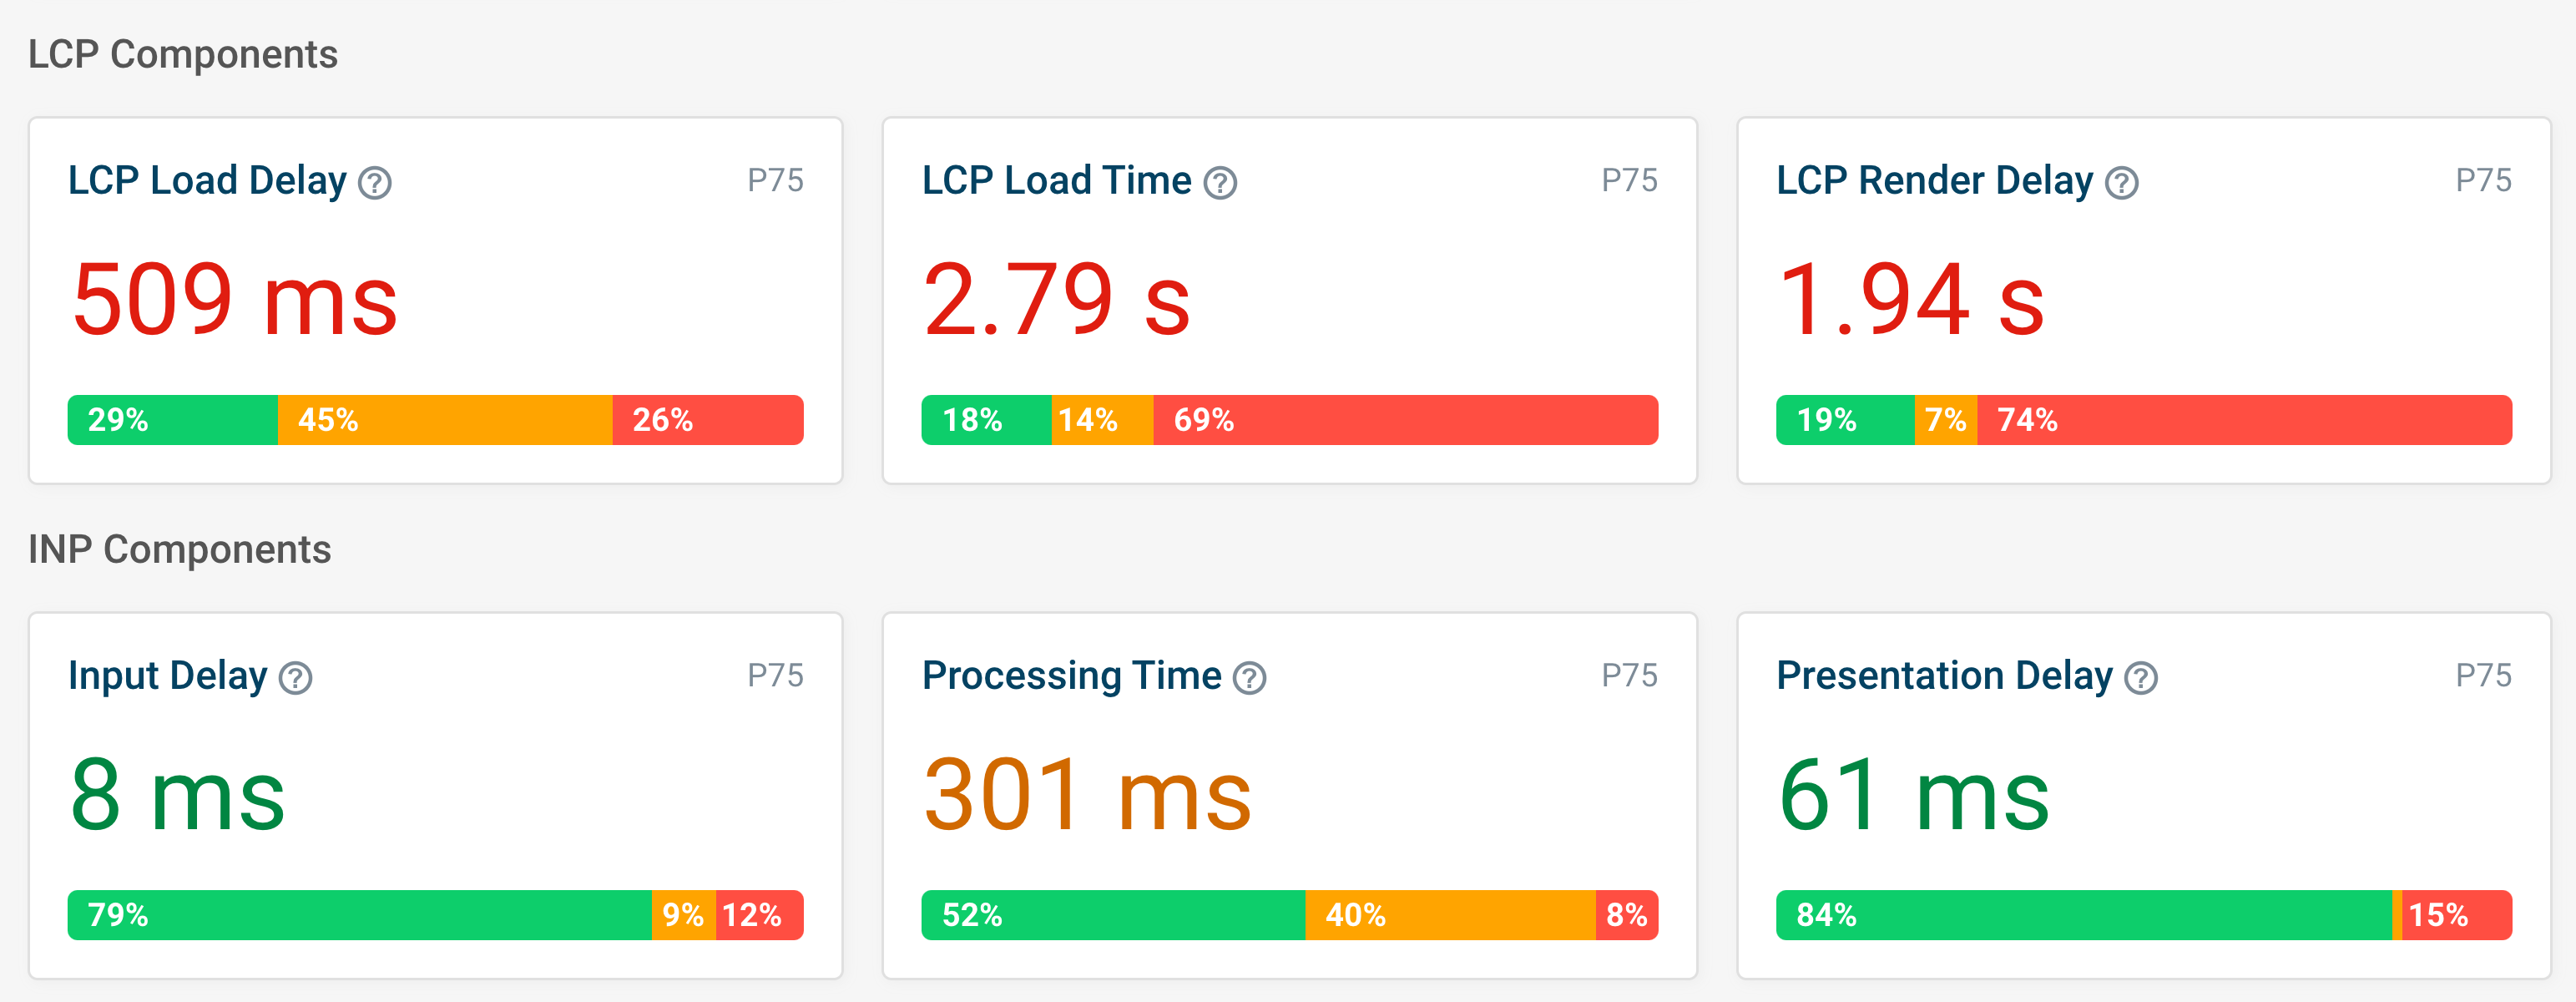
For example, this DebugBear screenshot shows a breakdown of the Largest Contentful Paint metric for a large number of users on a website.
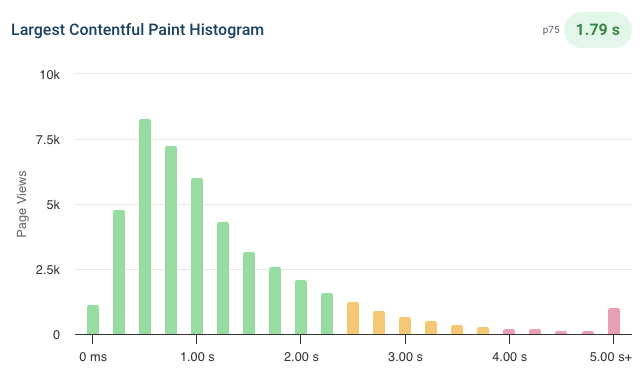
Lab-based testing on the other hand captures data in a set of fixed test environments. There's a risk that these environments are very different from what real users experience.
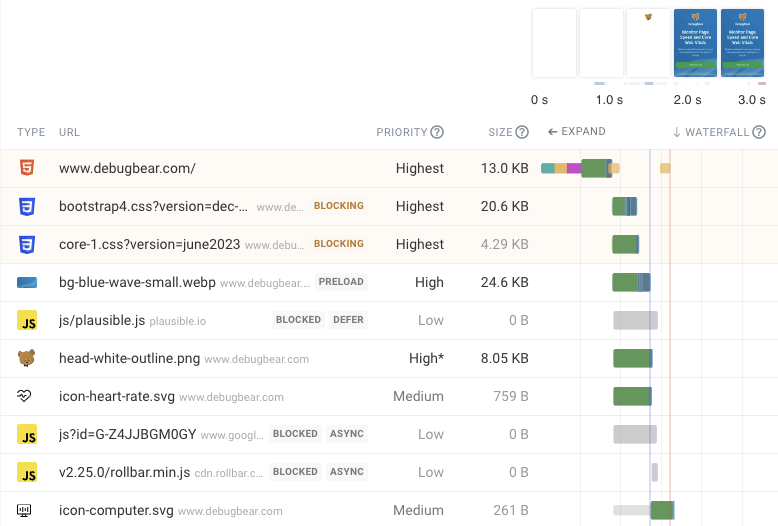
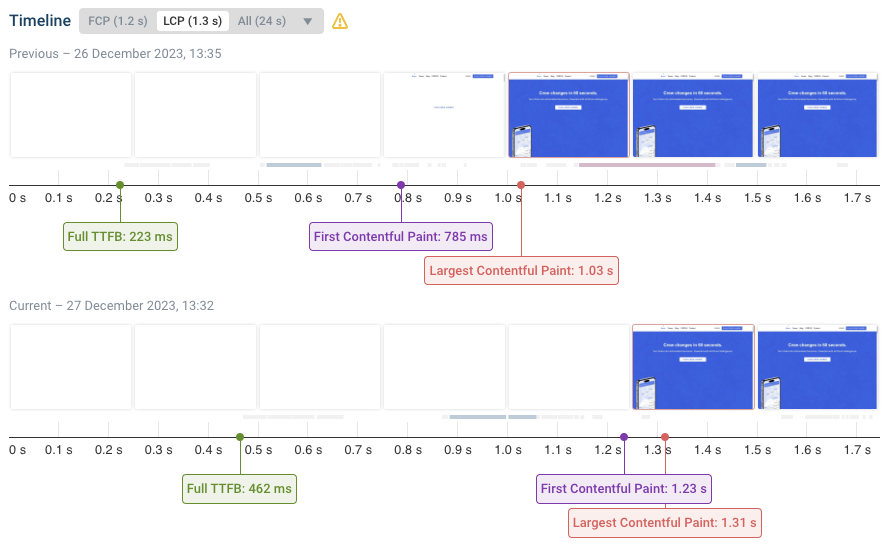
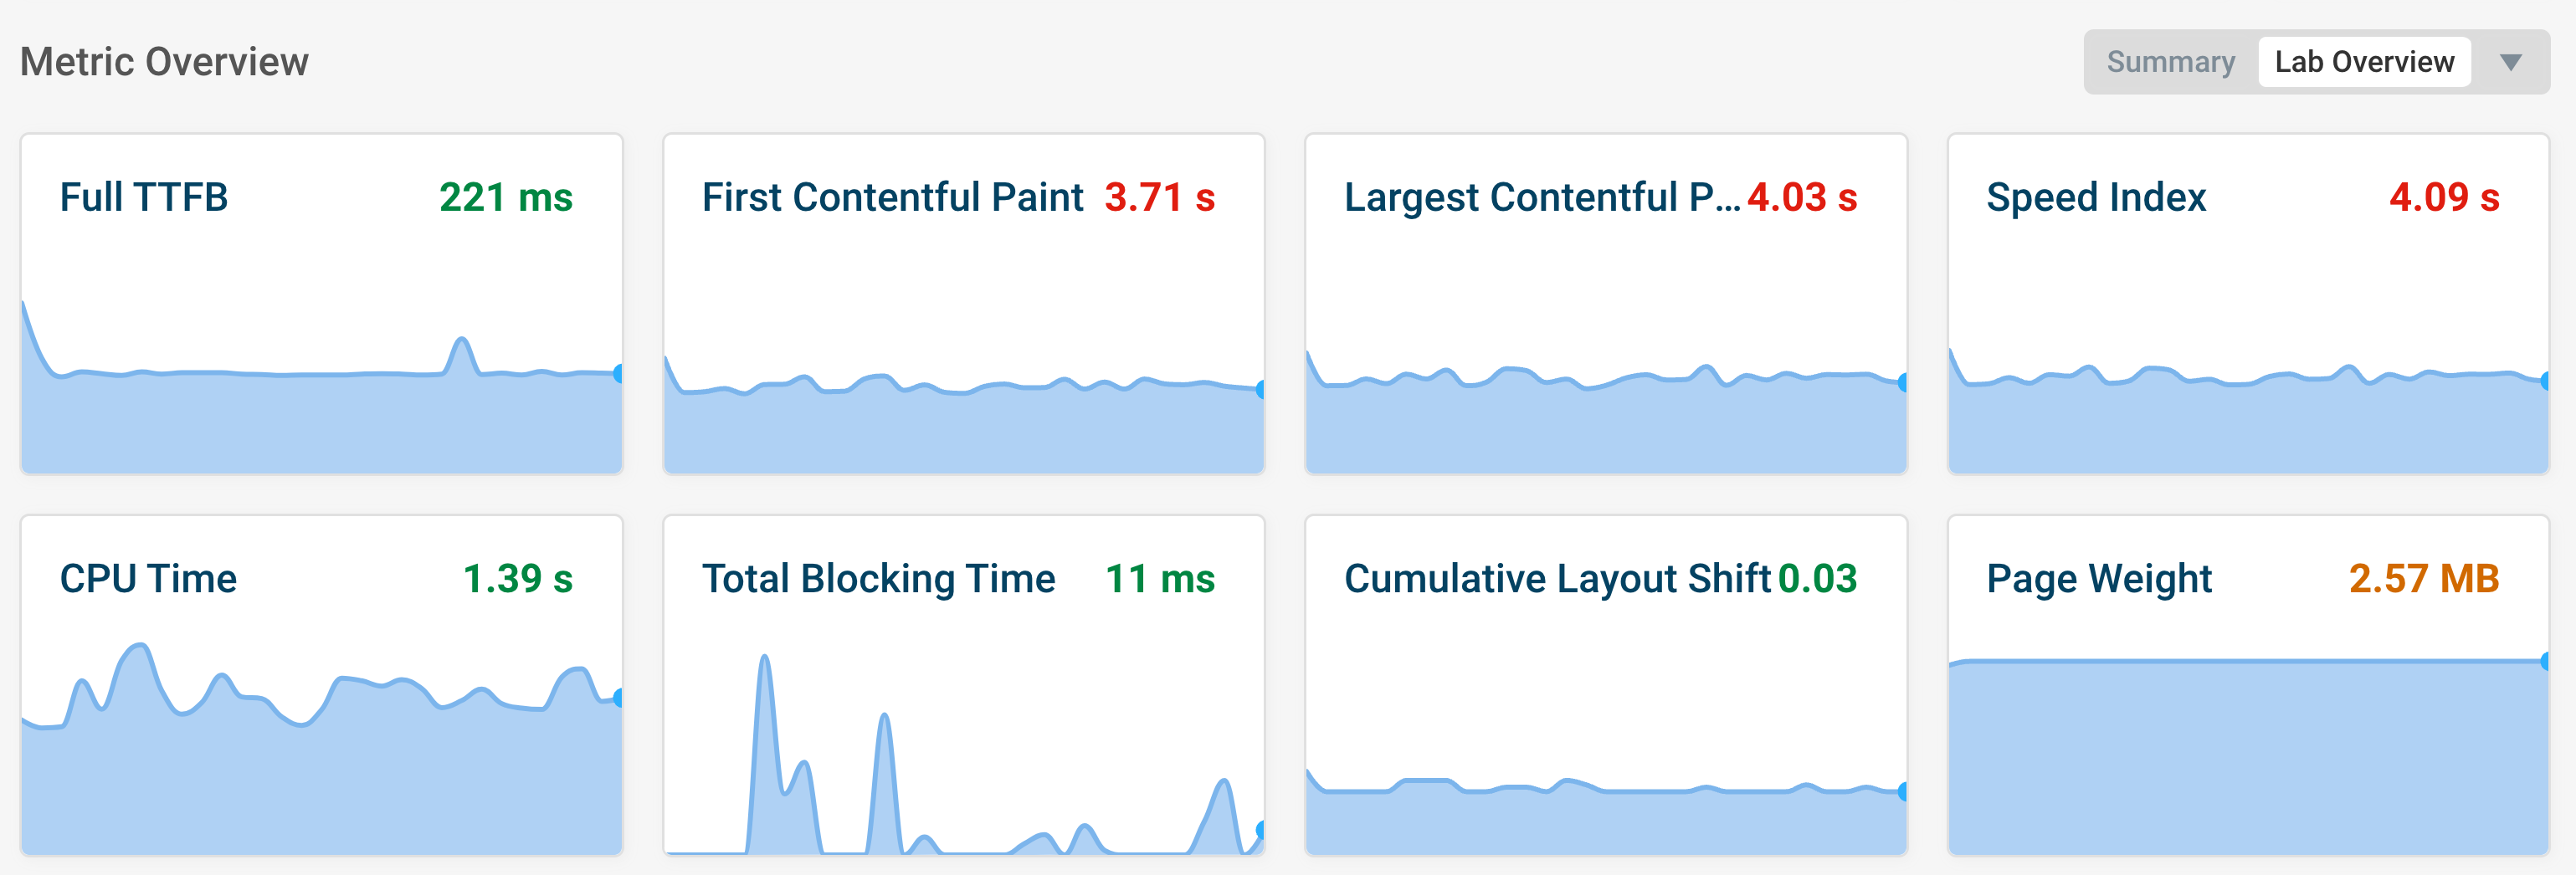
The advantage of lab data is that it provides much more detailed reports that you can use to optimize your website. For example, you can get automated recommendations, view a video recording of the loading process, or analyze network activity in depth with request waterfall visualizations.
To get the most realistic results in lab data you need to know what type of device and network connection your users are likely to use, so you can configure the test environments accordingly. Essentially, you measure the experience of a few hypothetical users, masking the complex reality.
Did my site get faster?
So why bother with lab-based testing if it can't tell you how fast your site is? The big advantage is that tests are run in a controlled environment.
Did your load times go down in a lab-based test? Congratulations, you've made your site faster! (Assuming your change didn't hurt performance in different device conditions.)
What about real-user metrics? Did your site get faster, or did your users come back from holiday and now have fast wifi again? Did you lose a big customer that happened to use slow devices, bringing up average performance?
Likewise, if you speed up your website you might attract more users on slower connections, who'd otherwise have bounced. These new users who now stick around will drag down your RUM metrics.
With real-user monitoring you need to dig into your metrics and figure out what happened. Here are just a few factors that affect performance:
- Device and browser
- Network connection
- User location
- Content that varies based on account data or ad targeting
- Resource competition between your page and other software on the device
In a lab environment these can be kept constant. However, the fact that lab tests only look at one experiences in one set of conditions also means that you might end up optimizing only for these conditions. You need to check your lab data to verify that the optimizations were broadly applicable.
Why did my site get slower?
Here's another aspect where lab-based testing can shine. The test server can capture information about every request, record a filmstrip with screenshots, or collect console messages. There's no need to worry that collecting lots of data will impact page performance for real users. This makes it easier to identify what caused a performance regression.
With RUM metrics this will be much more limited, to reduce data usage and because the page doesn't have access to all the information the browser has for security reasons. If you detect a problem you'll need to investigate what caused it.
Ability to break down the collected data
Real user monitoring can be run on every page that's viewed by your users. You can then break the data down to see what pages are particularly slow. It's also possible to break down the data by country or by device.
With synthetic monitoring you won't collect any data unless you've explicitly set up a monitoring scenario for that page, device, and client location.
If a page is particularly slow in China you'll be able to see that in the broad range of data collected by your real-world data. But synthetic tests will only detect an issue if you're testing with a China-based test client.
What can be monitored?
To collect real user metrics you need to be able to run code on the page, which means you can only do it for your own sites.
If you want to compare your website against the competition you need to use a lab-based tool, or check the public Google CrUX data by running a Core Web Vitals test.
Lab and field data in PageSpeed Insights
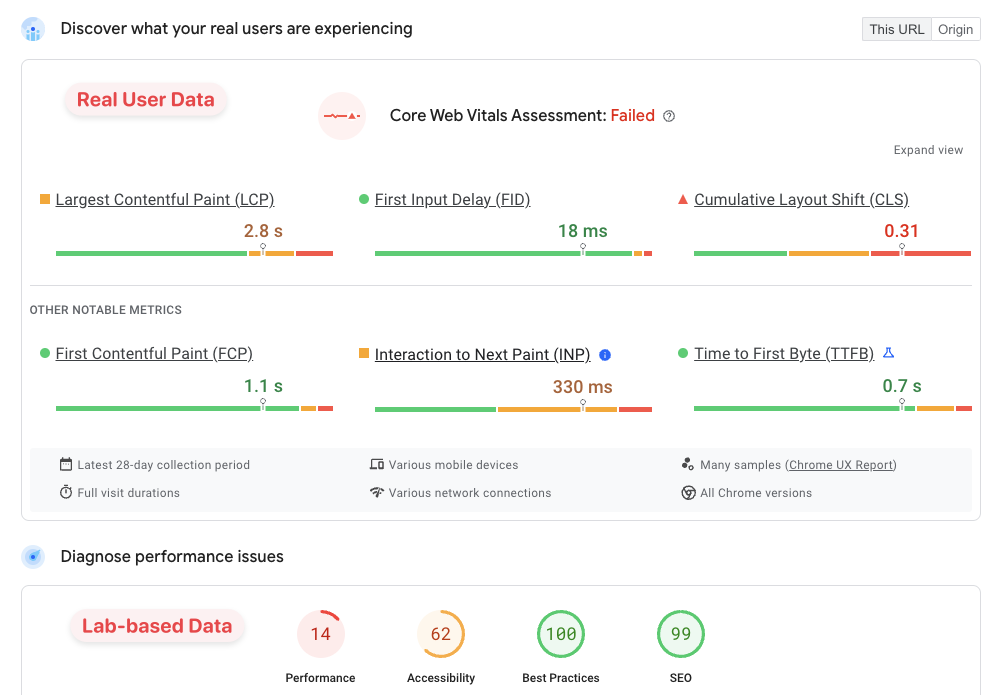
Google's PageSpeed Insights tool reports both data from real Chrome users and runs a synthetic Lighthouse test.
The real user data is what Google uses as a search result ranking signal.
How to monitor lab and RUM data with DebugBear
DebugBear supports both lab-based monitoring and real user monitoring. Both offer a rich set of metrics and visualizations to help you understand your website's performance, whether it's from a controlled lab environment or from your real users.
Observing for trends in lab data can help you understand if your website is getting faster or slower over time.
Collecting real user data can highlight how your website performs in different conditions which you otherwise wouldn't be able to test in a lab environment.
Conclusion
Real-user data allows you to see how many of your users experience slow or fast performance. You can see how urgent performance optimization are, track how different user cohorts are impacted, and monitor real user performance over the long term.
Synthetic testing in the lab limits the impact of external factors on your measurements, helping you isolate how the changes you make affect performance.


Monitor Page Speed & Core Web Vitals
DebugBear monitoring includes:
- In-depth Page Speed Reports
- Automated Recommendations
- Real User Analytics Data