
The WebPageTest tool by Catchpoint is a great tool for testing website performance. Find out how to test your websites and how to interpret the reporting data.
How to test your website on webpagetest.org
To run a website speed test with WebPageTest all you need to do is enter your website URL and click Start Test.
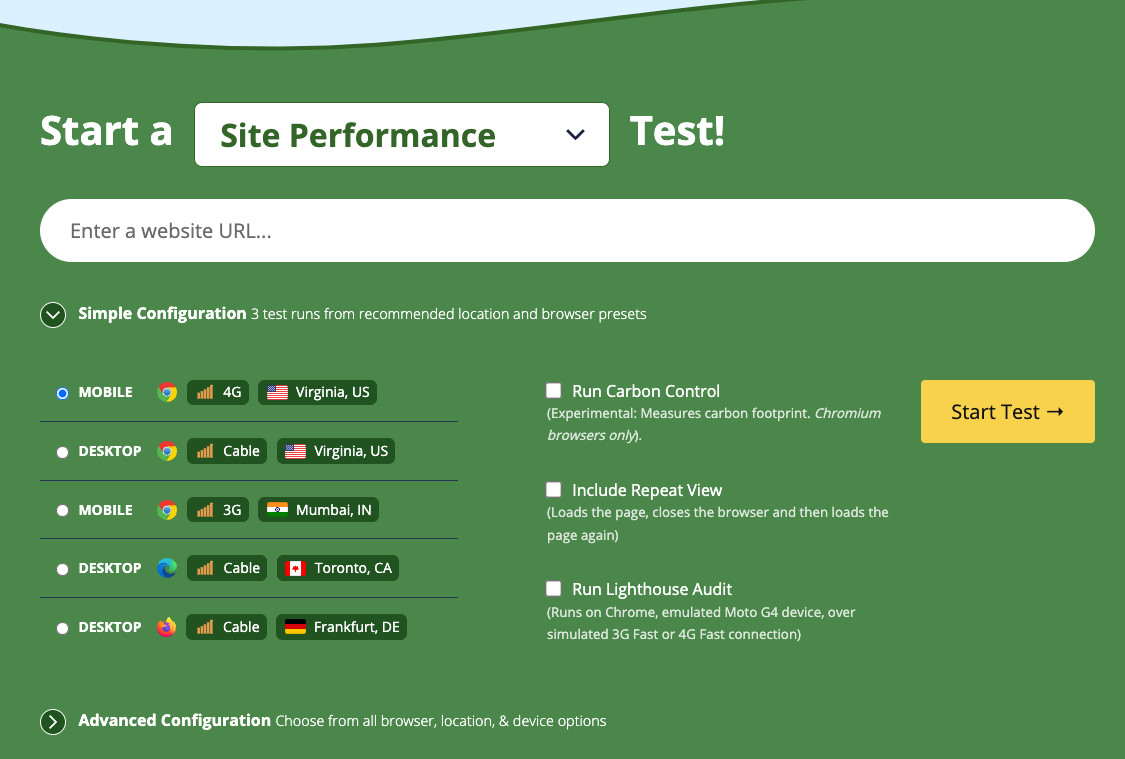
One of the outstanding features of WebPageTest is its configurability. You can select from many different browsers and test locations.
What is a test run?
Performance varies across test results, even when testing the same page. Because of that, WebPageTest triggers multiple runs when you trigger a test.
Each test run opens your web page in the browser and collects result data for that run.
Other ways to test your website
WebPageTest is a very useful tool, but can sometimes be very technical. If you're looking for something slightly easier to use, try out the DebugBear page speed test.
An overview of your website test result
After running a Site Performance test, WebPageTest shows 4 initial sections summarizing your test result:
- Performance Summary
- Page Performance Metrics
- Real-World Usage Metrics
- Individual Runs
Let's take a look at each of these sections in the test result.
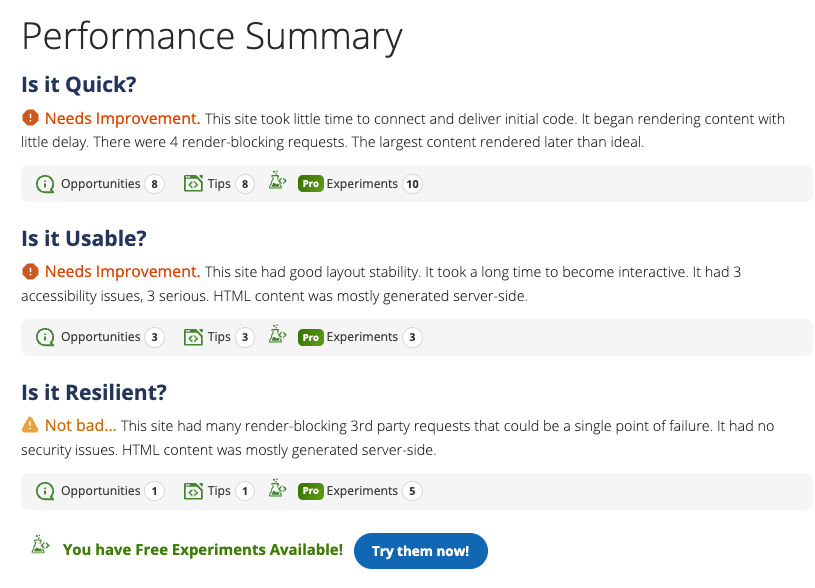
Performance Summary
The summary section checks three aspects of your website:
- Is it quick? – How fast does the website load?
- Is it usable? – Does content shift around after loading, and are there accessibility issues?
- Is it resilient? – Does the website depend on third-party code, are there security issues, and does the site support server-side rendering?
WebPageTest also offers experiments to try out potential optimizations to address these issues.
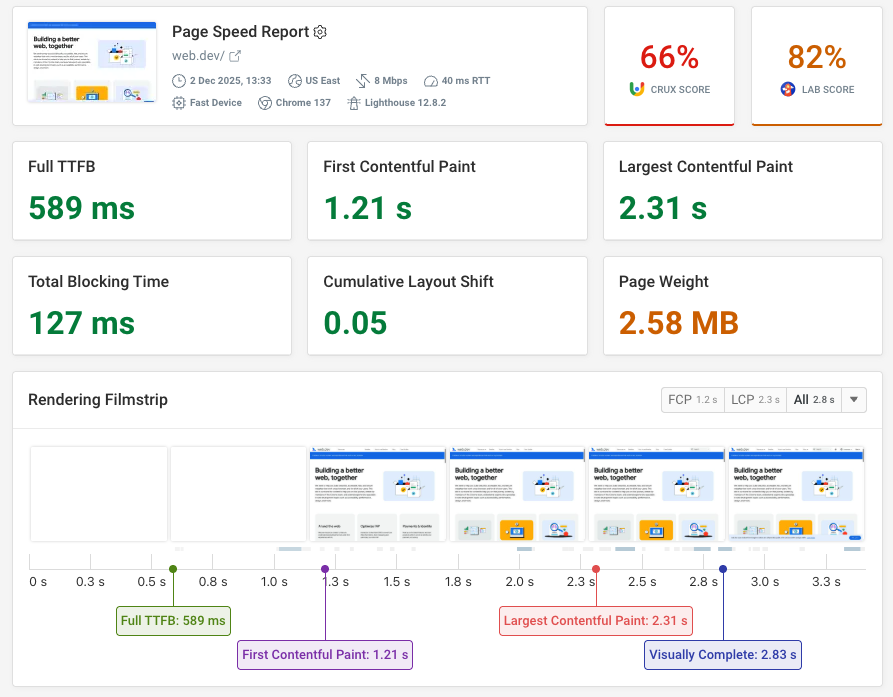
Page Performance Metrics
This section highlights important page load and rendering milestones:
- Time to First Byte: how quickly does the server respond with the document HTML?
- Start Render: how quickly does the page start painting?
- First Contentful Paint: when does text or an image become visible?
- Speed Index: how quickly is the website mostly rendered?
- Largest Contentful Paint: when does the main page content appear?
You can also see a visual filmstrip that shows how your website renders frame by frame.
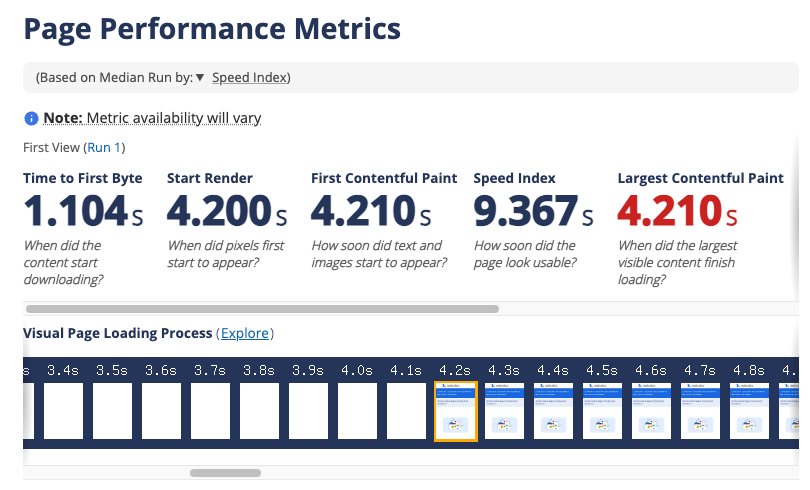
The data here is reported for the median run by Speed Index.
If you scroll to the right you also see three additional metrics that are not page milestone timings:
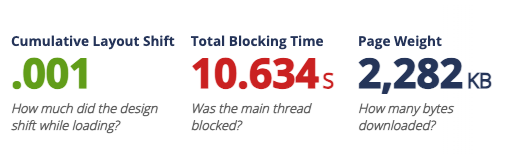
- Cumulative Layout Shift: to what extent does content move around after rendering?
- Total Blocking Time: how often was the main thread blocked by CPU processing work?
- Page Weight: how much data needs to be downloaded when loading the website?
Real-World Usage Metrics
So far the data we've looked at is based on a synthetic website speed test run by WebPageTest.
The data in the real-world section instead comes from the Chrome User Experience Report data that Google collects from real Chrome users. It tells you how visitors actually experience your website!
Since this is real-user data, it also includes the Interaction to Next Paint (INP) metric. It measures how long it takes for a website to respond when a user clicks on a page element or presses a key on their keyboard.
Every visitor will have a different experience with different performance metric values. The data reported by CrUX shows the 75th percentile of experiences.
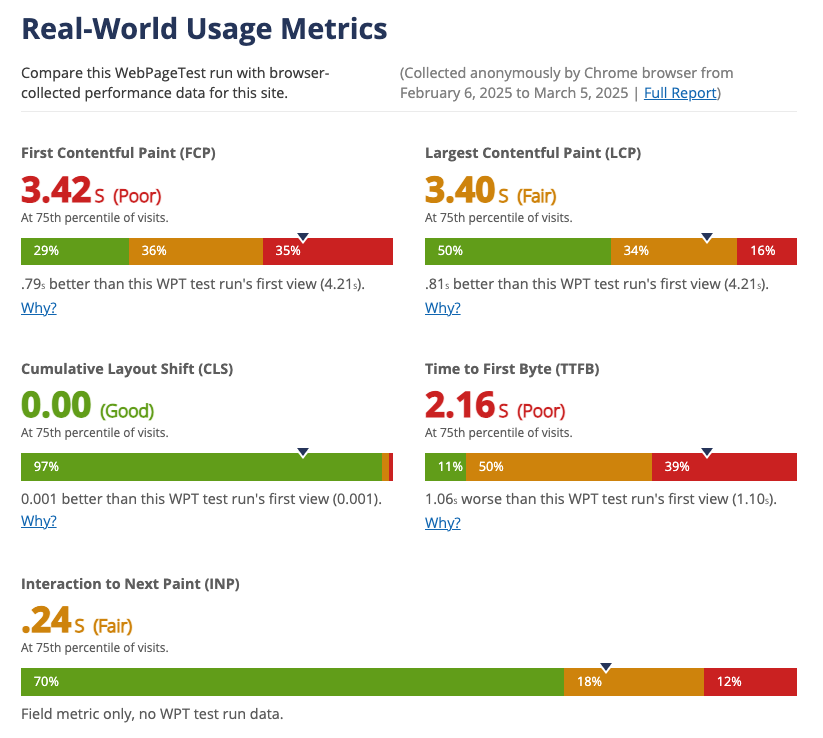
Google now also supports additional real-user metrics:
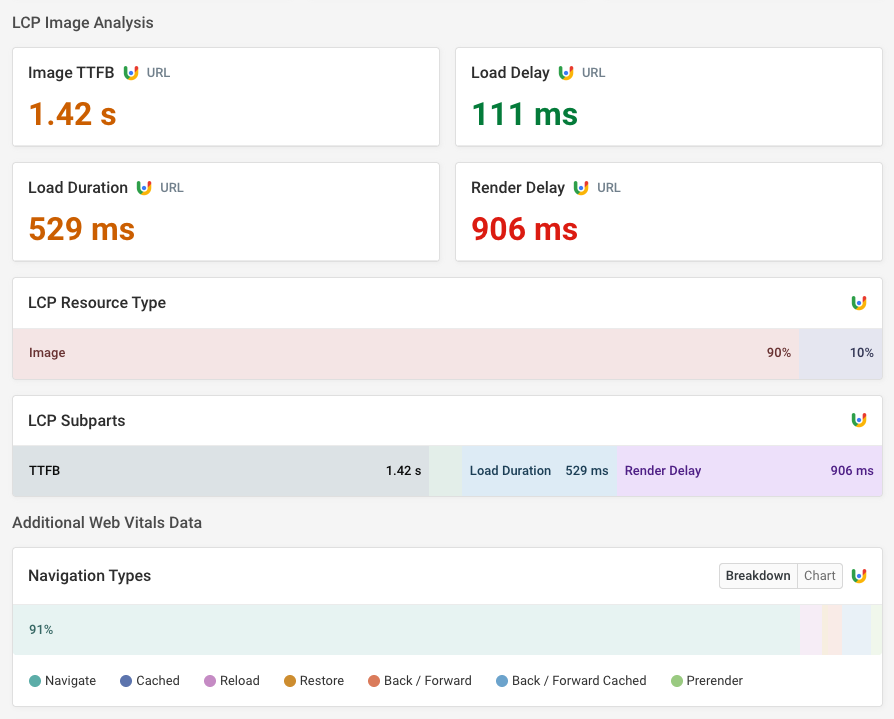
- LCP subparts: what is delaying the Largest Contentful Paint?
- Navigation types: could your website benefit from better caching?
- Network latency: how fast is the network of your visitors?
WebPageTest doesn't support this data yet, but it's included in the Web Vitals section of the DebugBear website speed test.
Individual Runs
This section shows each individual test run and lets you deep-dive into the test result data. Instead of just checking how your website renders, this data allows you to understand why.
We'll take a detailed look at the request waterfall visualization next. Click on the waterfall image and scroll to the Waterfall View.
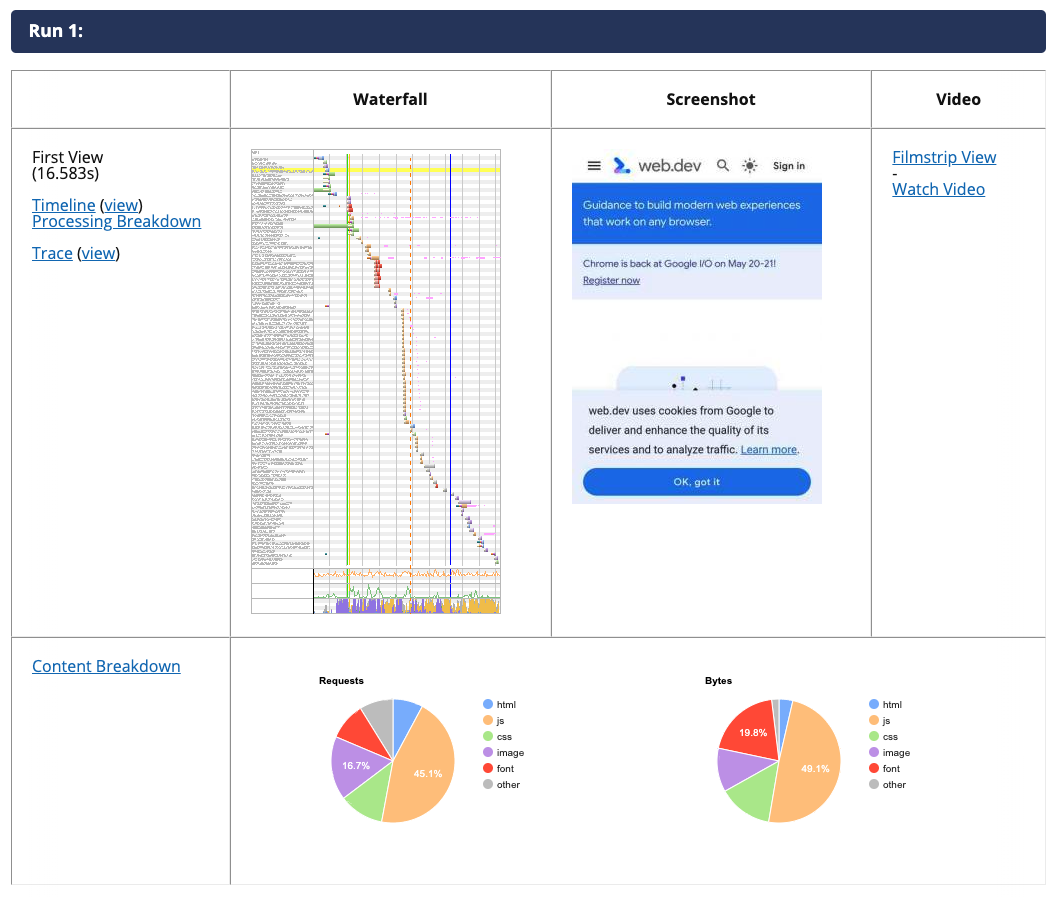
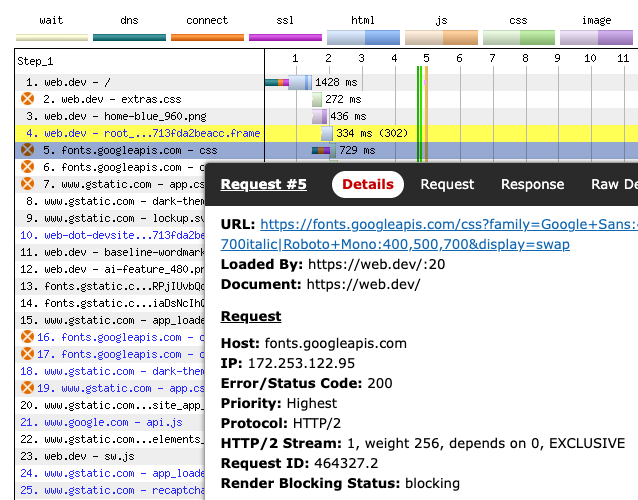
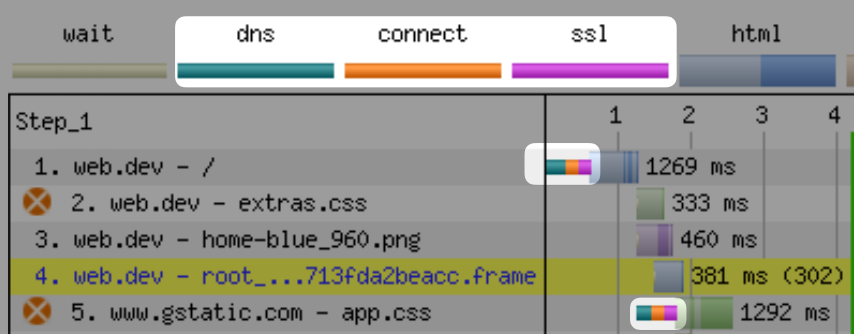
How to interpret the WebPageTest request waterfall
A request waterfall shows when the browser loads different resources over the network and how long they take to load. Each row represents one network request for a resource at a specific URL.
Certain resources are especially important for the page rendering process, for example render-blocking requests. Browsers won't display any page content before these resources are loaded. WebPageTest marks these resources using an orange circle with a white cross.
We can see that this request waterfall shows the page loading several render-blocking resources.
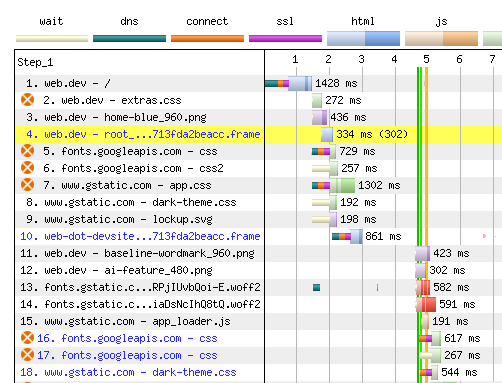
Once these are loaded the page can render, as indicated by the green line that marks the First Contentful Paint milestone.
A great strength of WebPageTest is the level of detail it provides for each request. If you click on a row in the waterfall you can see the full request URL, the server IP address, as well as information on HTTP/2 stream priorities.
Matt Hobbs has published an ultimate guide on how to read the WebPageTest request waterfall.
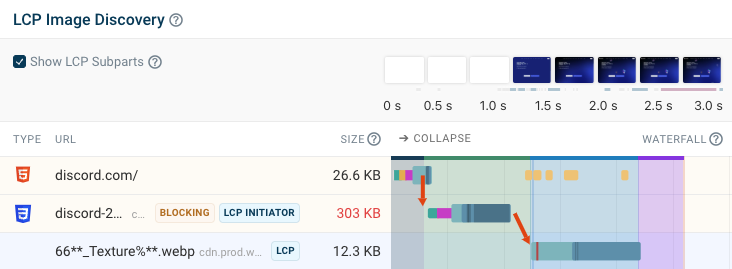
An easier alternative to the WebPageTest waterfall
If the WebPageTest waterfall is a bit hard to read, try DebugBear synthetic testing instead.
You get a lot of the high-level information you need for performance testing in a simpler more interactive way.
The integrated filmstrip view also helps you see how rendering is related to network activity.
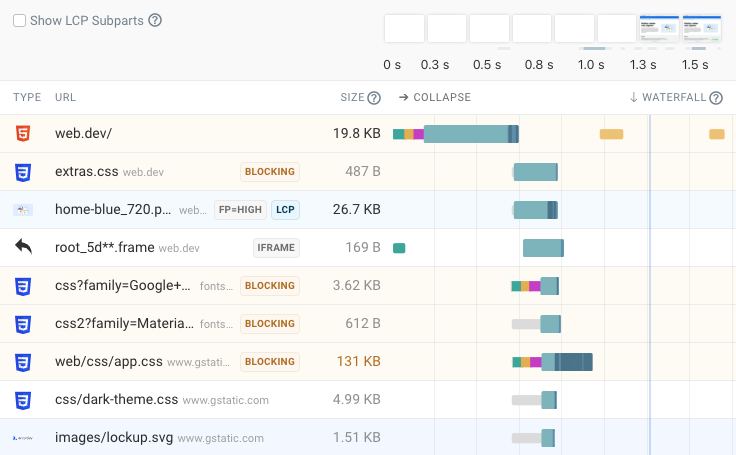
When debugging a specific performance metric there are also specialized filtered views available to highlight the most important requests.
For example, here you can see a Largest Contentful Paint background image that loads only after a CSS stylesheet has finished loading first.
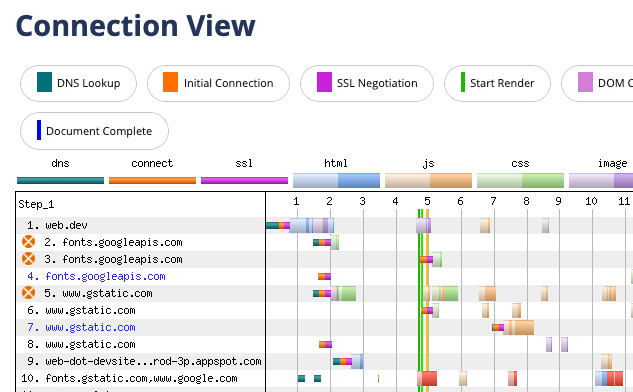
Using the Connection View
Before browsers can load a resource from a server, they first need to establish a server connection. You can see these steps in front of some requests:
- DNS
- TCP (connect)
- SSL
Once a connection has been established it can be used to load different resources. The Connection View shows all server connections established by the browser and when they are active during the page load process.
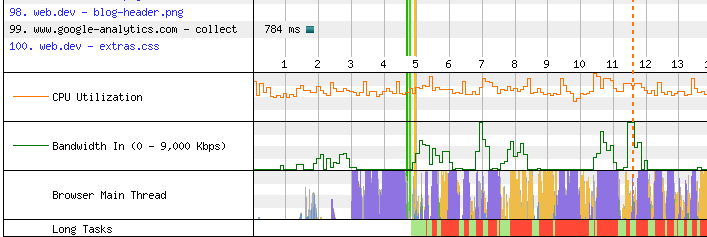
CPU utilization, bandwidth, and main thread tasks
Resource loading isn't the only factor slowing down website speed. Main thread tasks like CPU rendering tasks or JavaScript execution also impact performance.
At the bottom of the WebPageTest waterfall view you can see when the CPU and network are busy, and when processing on the main thread is especially active.
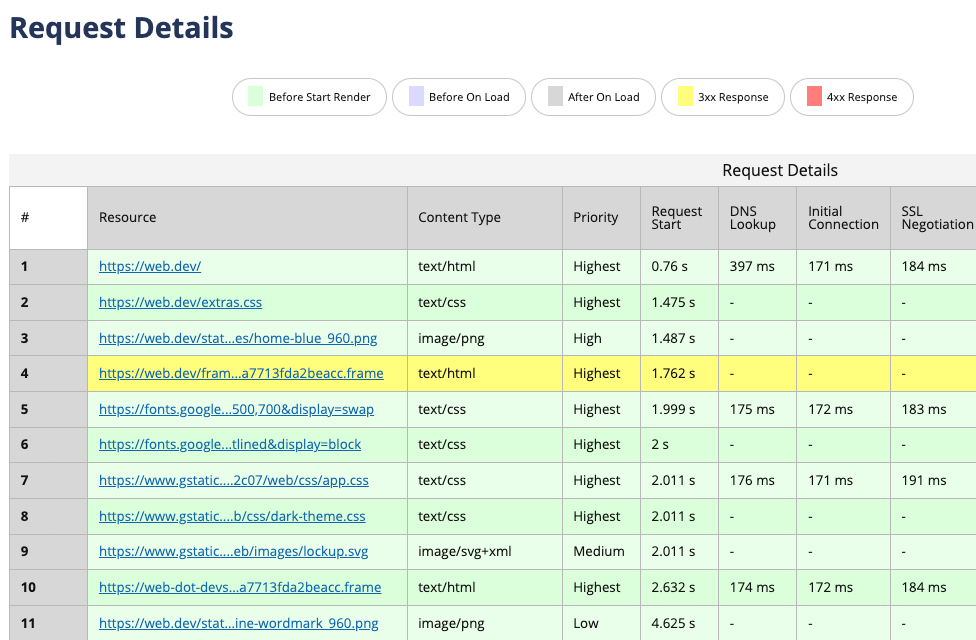
Request Details
Finally, the detailed test run view on WebPageTest shows you a list of all requests, their content type, request priority, as well as timing details.
Advanced configuration options
It's easy to run a quick test with WebPageTest, but where it really shines is in the advanced settings it provides. Click on Advanced Configuration to select a specific network speed and browser.
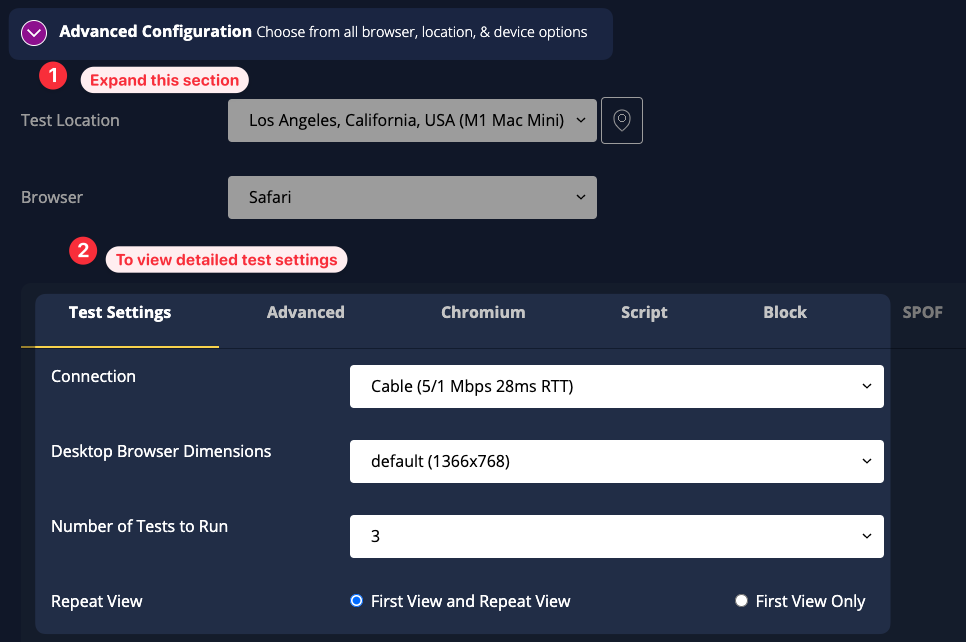
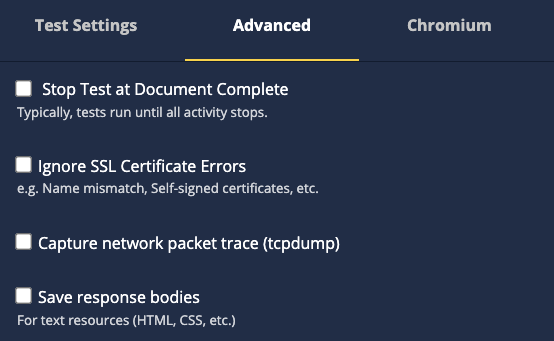
What if you open the advanced settings within the advanced settings? You can do a wide variety of things:
- Collect a tcpdump showing what network packets are transferred when loading the page
- Set a custom user agent
- Disable support for image formats like AVIF and WebP
- Run code after the document has started loading
WebPageTest Scripting
You can also configure user flows in the Script tab of the advanced settings. For example, you can set up an account login or add a product to the shopping cart before viewing the checkout page.
// Don't collect data yet...
logData 0
// Open product page and add to cart
navigate https://example.com/product
click innerText=Add to cart

logData 1
// Open the checkout page
navigate https://example.com/checkout
WebPageTest Carbon Control
WebPageTest also provides a Carbon Control feature that aims to measure the CO2 footprint of the web page.
However, the CO2 emission estimate that WebPageTest reports is not reliable.
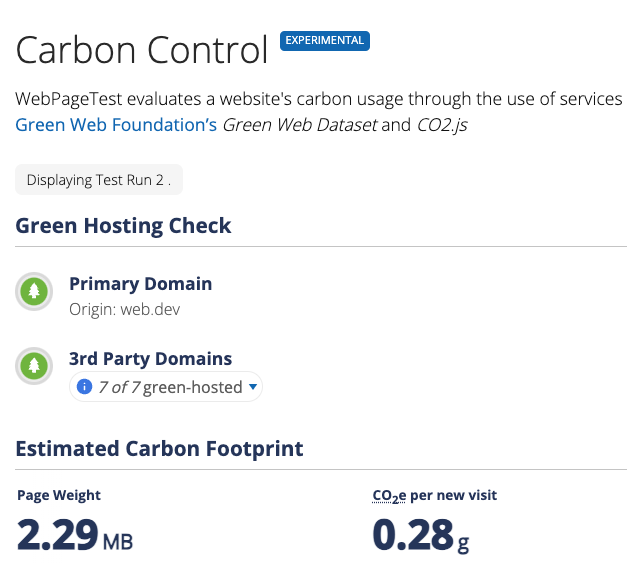
Due to poor data quality, we recommend against using the CO2 emissions reported by the WebPageTest Carbon Control feature to assess your website's carbon footprint.
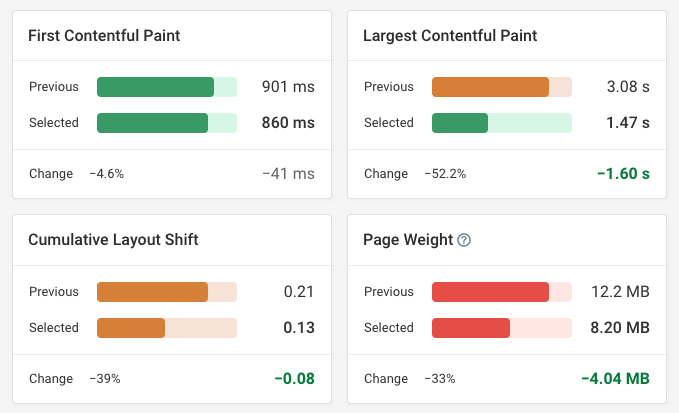
Running web performance experiments
WebPageTest and DebugBear both support trying out changes to your website without deploying any code to production. For example, this performance recommendation includes a "Run Experiment" button that lets you lazy load off-screen images to reduce resource competition with more important resources.
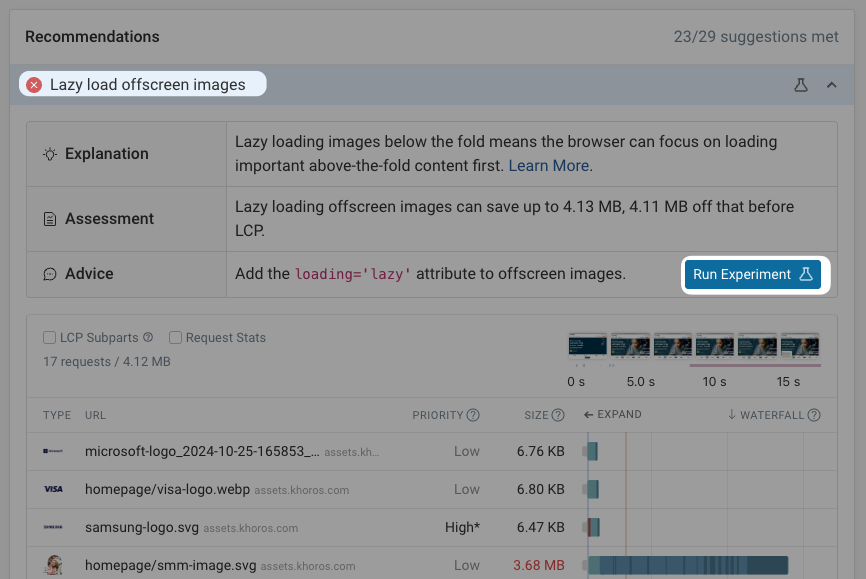
If you run this experiment you can see how page load time and page weight would be impacted.
Here we can see that the Largest Contentful Paint metric goes down by half, showing that this would be a high-impact optimization.
Run continuous website tests
Check out DebugBear website performance monitoring if you want to run synthetic page speed tests on a schedule.
Track lab test metrics and Google CrUX over time and get alerted to any regressions.
On top of that, DebugBear also offers real user monitoring (RUM) for Core Web Vitals and other performance metrics.
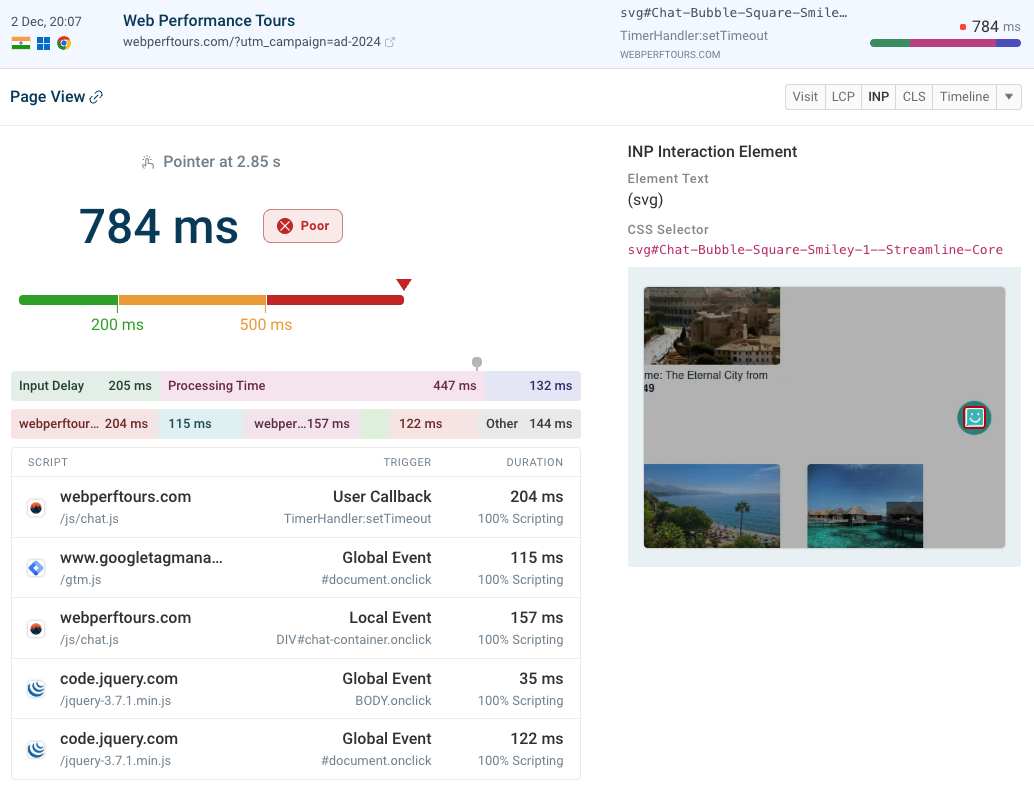
DebugBear RUM also provides detailed reporting data for slow INP interactions:
- What pages have poor INP scores?
- What UI elements cause slow interactions?
- What scripts are slowing down those interactions?
You can review detailed page view data to understand why a specific user had a poor experience and what you can do to optimize your website.


Monitor Page Speed & Core Web Vitals
DebugBear monitoring includes:
- In-depth Page Speed Reports
- Automated Recommendations
- Real User Analytics Data