
When running page speed tests using different tools, you'll often find that the metrics they report don't match up exactly or may even show significant discrepancies.
This article explains why you might see score and metric differences between PageSpeed Insights (PSI), Lighthouse, and other tools.
Why Are Lighthouse And PageSpeed Insights Scores Different?
There are a few differences between PageSpeed Insights and Lighthouse tests:
- PageSpeed Insights reports both real user data and Lighthouse lab test scores
- Tests are run from different locations
- Tests are run on different hardware (CPU speed)
- PSI always reports simulated metrics, while Lighthouse also supports other data types
- Lighthouse and Chrome versions can impact scores
- Chrome extensions can impact metrics when testing locally
In this article we'll investigate the causes of these discrepancies in depth and explain how to interpret the data from different tools.
Lab data versus field data
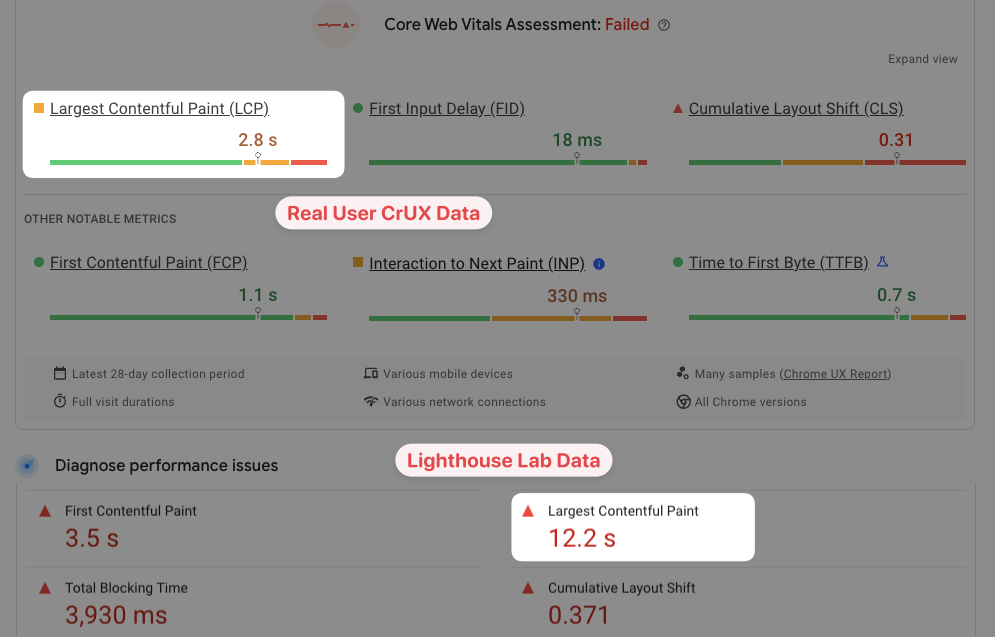
First of all, note that PageSpeed Insights doesn't only report lab data.
Lighthouse is a lab-based page speed testing tool. That means you can run it on demand to analyze a website.
However, PageSpeed Insights also reports data from real Chrome users based on the Chrome User Experience Report (CrUX). This data is also called field data.
Lab data and field data are different types of data that don't usually match, unless you took a lot of care to set up your lab environment to match your typical user.
Generally you should expect the field data on PageSpeed Insights to be better than the lab data. The field data looks at the worst 25% of user experiences on the website, but the Lighthouse data is often more similar to the worst 5-10% of experiences.
Differences in accuracy due to how network throttling is implemented
Even if you only look at the lab metrics and Lighthouse scores across different tools you will still find significant score differences.
To achieve realistic and consistent results, Lighthouse uses a throttled network connection to test pages. For mobile devices this connection uses a bandwidth of 1.6 Mbps and 150 ms server round-trip time.
However, there are multiple different ways to throttle the network connection and this can cause discrepancies between tools:
- PageSpeed Insights loads the page on a fast connection without any throttling, and then simulates how the page might have loaded on a slower connection. This is the default setting for Lighthouse.
- In Chrome DevTools you can use both simulated throttling and DevTools throttling to collect Lighthouse metrics
- More advanced tools like the free DebugBear website speed test and WebPageTest use packet-level throttling
Tests run with packet-level throttling take longer to complete, but produce more accurate metrics. The data you see in the PageSpeed Insights diagnostics section can sometimes be misleading.
PageSpeed Insights uses simulated throttling to determine its performance metrics, which can be unreliable.
How to check what throttling method was used
If you see differences between two Lighthouse reports, hover over the "Slow 4G Throttling" label in the Lighthouse test config section. This will tell you whether simulated or real throttling was used to collect the data.
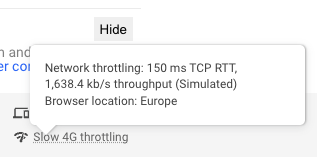
Generally you should trust tools that throttle the network directly over those that run a simulation.
When looking at simulated data it can sometimes be useful to look at the raw collected metrics. You can do that using the Site Speed Chrome extension.
With this extension installed you can run a PageSpeed Insights test and see how fast the page loaded without throttling applied. In some cases you'll notice that the throttled metrics are faster than the unthrottled metrics. If that's the case you can disregard the data as inaccurate.
Getting a poor Lighthouse score doesn't always mean you have a web performance problem.
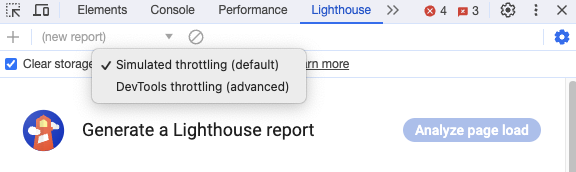
Running tests with DevTools throttling
If you run Lighthouse in Chrome DevTools you can choose between simulated throttling and browser-level "applied" throttling. Here the browser introduces a delay to each network response and measures the result.
How to get reliable page speed data
But both simulated throttling and DevTools throttling don't accurately represent how the network really works. To get reliable high-quality data you need to use packet-level throttling, where the network is actually slowed down at the system level. Many commercial tools like the DebugBear page speed test do this.
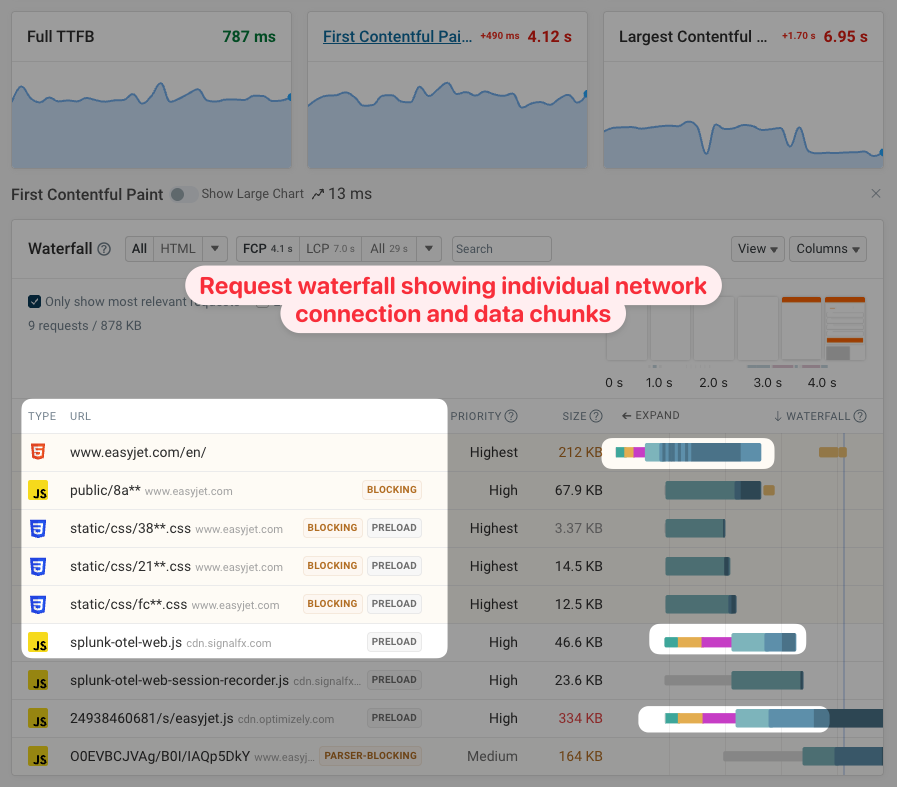
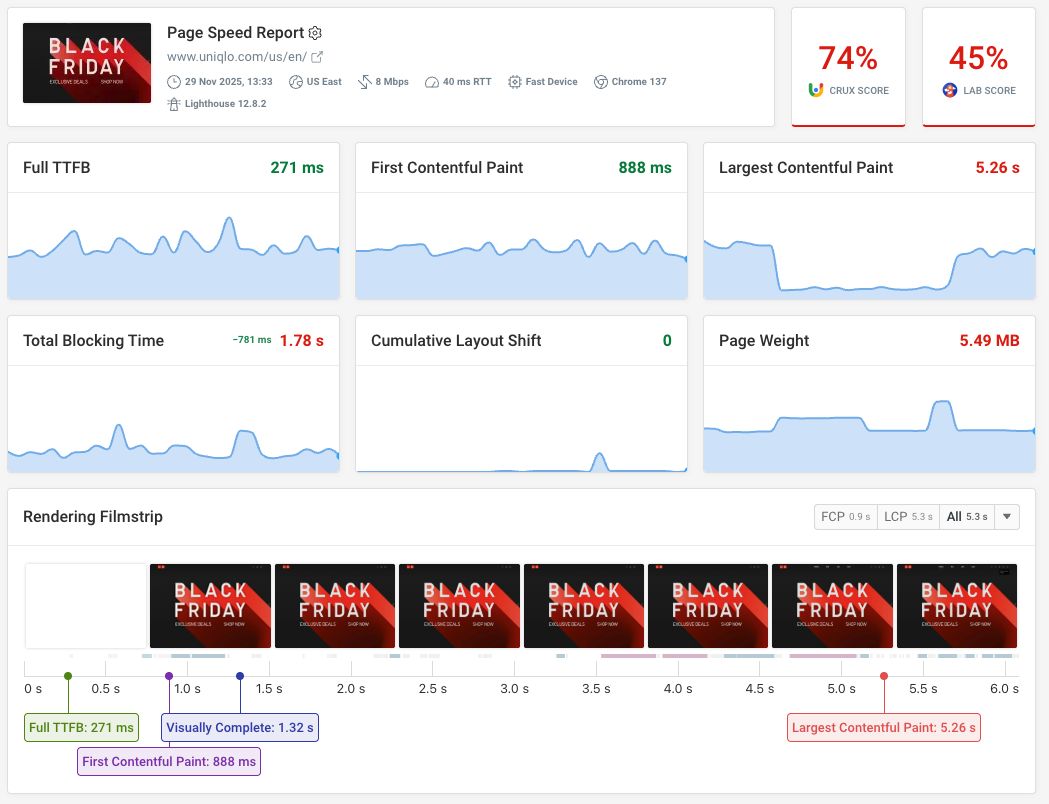
Reliable tools often provide a detailed network request waterfall that show each request, individual server connections, as well as individual data chunks. The screenshot below is taken from our synthetic monitoring product.
Differences in the test environment
Synthetic Lighthouse tests are always run in a specific test environment. Depending on factors like the CPU speed, test location, or Chrome version you'll see different scores in your test results.
Differences in CPU speed
If a site runs a lot of JavaScript code or requires complex layout computations, a faster CPU will make the page load faster. The CPU speed will be different on the server running PageSpeed Insights, on your local computer, or on a monitoring service.
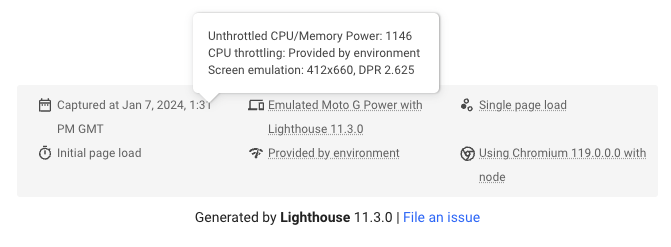
Every time Lighthouse tests a page it runs a very simple CPU benchmark. If a test is run on a faster CPU you'll get higher performance scores.
You can see the CPU benchmark at the bottom of the Lighthouse report.
There's no one "right" CPU speed to use when running a Lighthouse test. Different users on different devices will also experience differences in loading speed.
Different test locations
Page load time is also impacted by where a website speed test is run from. If you live in the UK, opening a website that's hosted on a server in London will be faster than opening one that's hosted in New York.
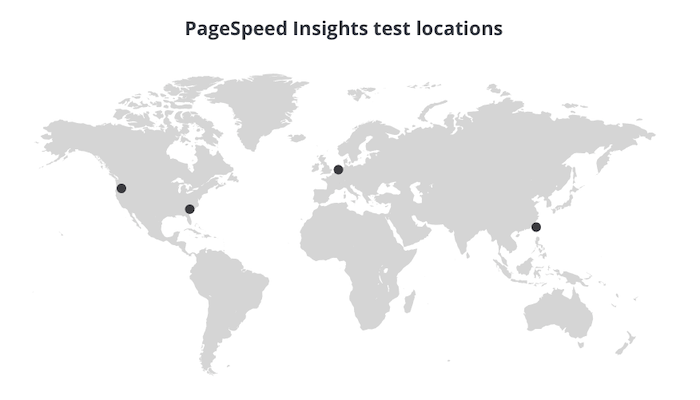
PageSpeed Insights picks the server to run the test from based on your current location. It uses one of four locations:
- Northwestern US (Oregon)
- Southeastern US (South Carolina)
- Northwestern Europe (Netherlands)
- Asia (Taiwan)
DebugBear tests pages from a server in South Carolina by default, but can run tests from 30+ locations.
If you run Lighthouse on your own computer, then the test results will always show how a user in your location would experience the website.
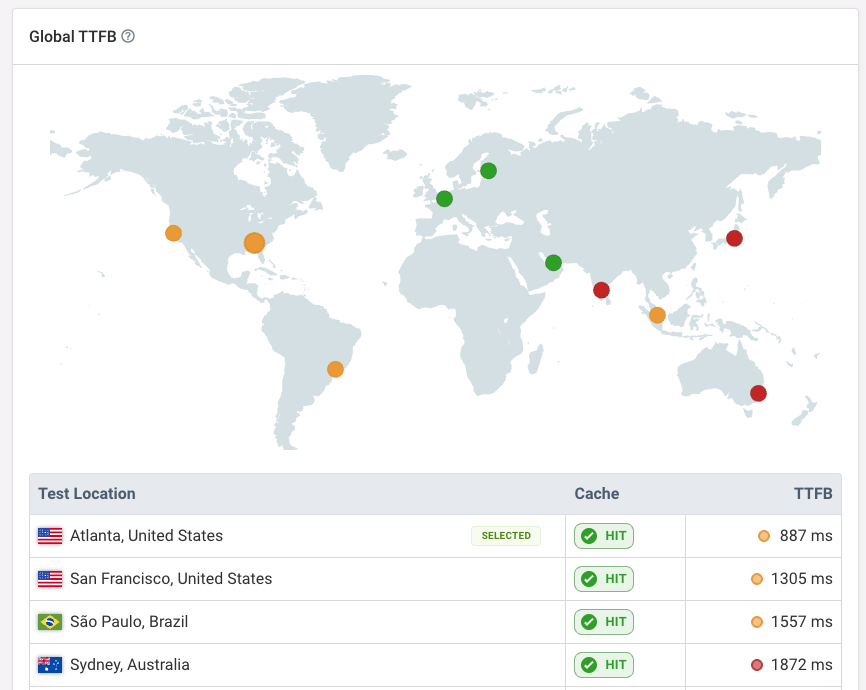
Try a global TTFB testing tool to see how the speed of your website varies across the world.
Chrome version
The Chrome version used to run the test can affect performance as well. For example, newer versions may have performance improvements that make them faster.
The way performance metrics are measured by browsers also changes over time. Chrome provides a changelog showing how the definition of the Core Web Vitals and other metrics have changed.
Lighthouse version
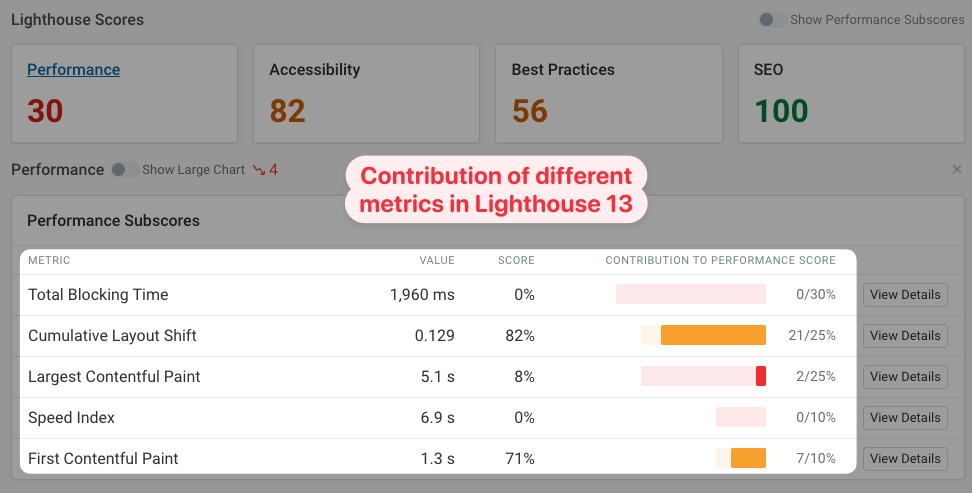
Over time, Lighthouse changes how tests are run, and the extent to which different metrics contribute to the overall Performance score changes as well.
For example, the Cumulative Layout Shift metric currently accounts for 25% of the overall Lighthouse score, but it used to only account for 15% and 5% in earlier versions of Lighthouse.
Different settings
Lighthouse provides a number of configuration options that can impact metrics. For example, you can control when Lighthouse ends a test by controlling timeout settings.
If the page doesn't render or finish loading after a certain amount of time Lighthouse gives up and finishes the page analysis. In some cases, this might be before the page actually finished loading. In other cases the page might finish loading quickly, but Lighthouse doesn't always correctly detect this, for example if there's regular CPU activity.
PageSpeed Insights and DebugBear use different timeout settings. Because PSI uses simulated throttling it can generally get away with lower timeouts than a tool like DebugBear that actually slows down the page load.
| Waiting for... | PageSpeed Insights | DebugBear |
|---|---|---|
| First Contentful Paint | 15 s | 30 s |
| Load | 35 s | 60 s |
Chrome extensions
If you run Lighthouse in Chrome DevTools, Chrome extensions can impact your Performance scores. Use Incognito mode or a new Chrome profile to run tests with extensions disabled.
What are the correct values?
What tool takes the best measurements, PageSpeed Insights, running Lighthouse locally, or using a hosted tool like DebugBear?
Lab-based testing can only ever generate a snapshot of how your page behaves in a certain environment. How well that snapshot reflects user experience depends on what the network and device of your users look like.
Generally, more advanced tools like DebugBear use more reliable and expensive ways to collect the data.
If you want to find out how fast your site is for real users you need to capture performance data for real users.
Score variation between different results from the same tool
Even when using the same tool to run multiple tests you still often see some variability.
There can be many reasons for this, for example:
- Differences in server response time
- Different CDN or server cache hits and misses
- Variation in the load order of different resources
- Slight differences in page content
Debugging Lighthouse score discrepancies
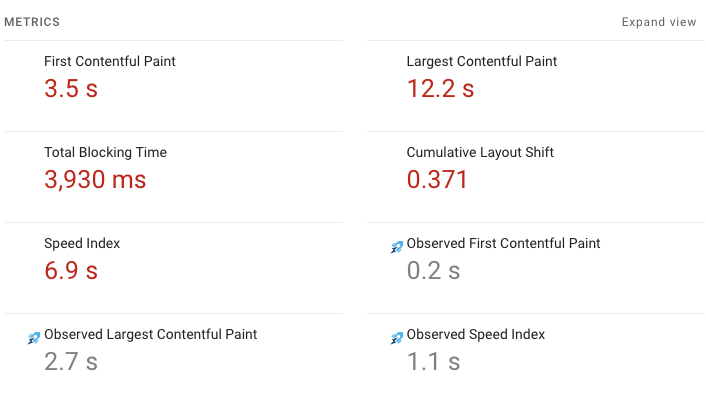
As mentioned earlier, Lighthouse calculates simulated performance metrics by default. If you see discrepancies between tools, it can be useful to look at the raw metric values Lighthouse collected from Chrome. Lighthouse refers to these as observed metrics.
- Open the Lighthouse HTML report (you'll have to click View Report on web.dev)
- Open the DevTools console
- Run
__LIGHTHOUSE_JSON__.audits.metrics.details["items"][0]
The result will look something like this:
{
  "observedFirstContentfulPaint": 1835,
  "largestContentfulPaint": 10035,
  "firstContentfulPaint": 1755,
  "observedLargestContentfulPaint": 2566,
  "cumulativeLayoutShift": 0.36618412272135414,
  ...
}
In this example, the unthrottled observed FCP is slower than the simulated FCP, with values of 1.8s and 1.7s, respectively. This suggests that the simulation is underestimating the real FCP value, as even on a fast connection it took 1.8s for the page to start rendering.
Why would Lighthouse underreport the First Contentful Paint? In this case, the page contained a large number of unnecessary preload tags, hurting site performance. While these tags hurt performance in Chrome, the Lighthouse simulation does not simulate their performance impact with complete accuracy.
If you use --throttling-method devtools or --throttling-method provided the observed metrics will be the same as the reported ones, as Lighthouse does not run the simulation.
Monitor page speed and Lighthouse scores over time
DebugBear is a website monitoring tool that continuously tests the loading speed of your website. It's built on top of Lighthouse and collects high-quality reliable page speed data.
Track performance and Lighthouse scores over time, and get alerted when there's a regression.
You'll also have access to in-depth custom reports that go beyond what Lighthouse offers:
- Custom recommendations
- Detailed request waterfall for performance investigation
- Video analysis of the rendering process
- Try out performance optimizations with experiments
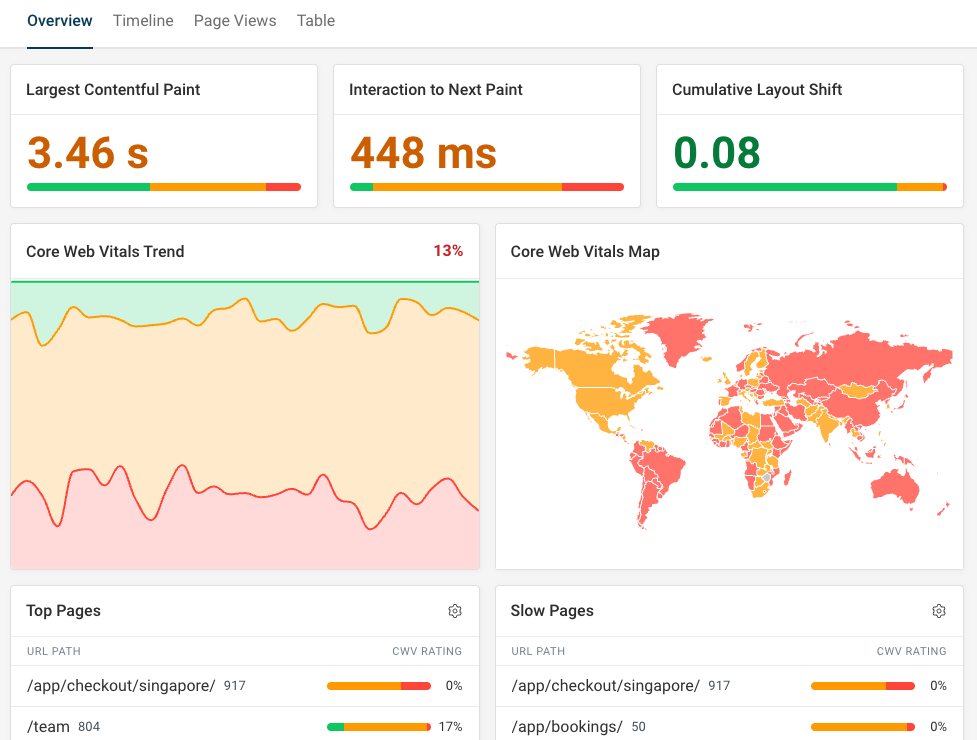
DebugBear also offers real user monitoring support, showing you how fast your website is for actual visitors. And unlike with CrUX, you don't have to wait 28 days for data to update!
See how fast your site is for visitors across the globe, and debug Google's Interaction to Next Paint metric by seeing what page elements users interact with and what scripts delay those interactions.


Monitor Page Speed & Core Web Vitals
DebugBear monitoring includes:
- In-depth Page Speed Reports
- Automated Recommendations
- Real User Analytics Data