What is Real User Monitoring (RUM)?
Monitoring real user experiences on your website can help you better understand and fix problems your visitors encounter.
RUM is particularly useful for analyzing page load performance, as experiences often vary by network speed or device size, and because Google looks at real user page speed data as a ranking factor.
This article provides a comprehensive overview of real user monitoring, including benefits, metrics, and how to get it set up on your website.
What is Real User Monitoring?
Real User Monitoring (RUM) means collecting data directly from visitors of your website. That’s in contrast to synthetic monitoring where data is collected in a controlled server environment.
Data that your website can report for real visitors might include:
- Page speed metrics
- Technical data like requests made on a page
- Analysis of user interactions and behavior
- Error tracking in the browser
Why is Real User Monitoring important?
Monitoring real user visits on your website is important because delivering a fast and enjoyable experience can have a great impact on your business. A good user experience can mean the difference between a successful purchase and a frustrated visitor closing the page and going back to the search results to visit a competitor.
Positive page load metrics can also make a difference in search engine result rankings, helping your business show up before your competitors. Google uses real user experience metrics (Core Web Vitals) as a ranking factor in their search results.
Collecting and analyzing real user metrics provides clear opportunities to improve page load experience for your users. This in turn helps you optimize your Core Web Vitals and ensure a better search results rank.
Monitoring end-user experience vs server-side metrics
Server and infrastructure metrics can also provide information about visitor experience, but they don’t always show the full picture of what really happens. For example, redirects may slow down the HTML document request, or the document may take a long time to download on a slow connection even if the server response is ready quickly.
More and more websites are also front-end applications, where a range of resources need to be loaded to render the page. Backend metrics generally only focus on one request at a time.
How is real user monitoring different from Google Core Web Vitals data?
Real user monitoring delivers two key advantages over data from Google’s Chrome User Experience Report (CrUX):
- RUM metrics update immediately after a change, while CrUX data updates slowly over a 28-day period
- CrUX only reports metrics, while RUM provides more detailed segmentation and analysis of individual visitor experiences
Developers need detailed information to triage and resolve performance issues. Real user monitoring can identify specific slow pages, slow requests, or specific page interactions that are slow.
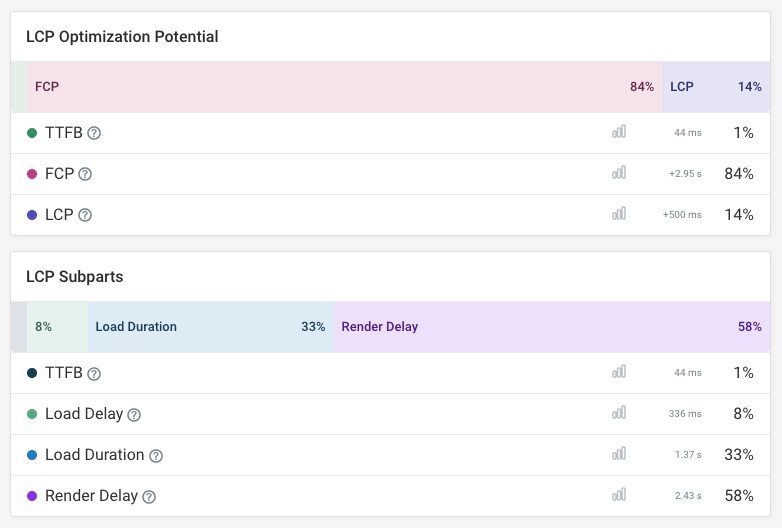
RUM also helps you prioritize optimizations, for example by showing you what content elements most often trigger the Largest Contentful Paint or what render-blocking resources usually take the longest to load.
Unlike Google CrUX, real user monitoring tools also provide alerting as soon as one of your pages starts doing worse on the Core Web Vitals. That way you can fix these problems before they impact your rankings.
Real User Monitoring Metrics
There are many different types of metrics that can be collected from real users, depending on your business requirements. These can include:
- User behavior like clicks and feature usage
- Business metrics like conversion rates
- Website performance and Core Web Vitals data
- Technical information like page load errors and device details
As many websites today are quite complex, real user monitoring plays an important role in measuring detailed technical information to help triage errors or performance issues that impact user experience. In this article, we’ll focus on real user website performance monitoring.
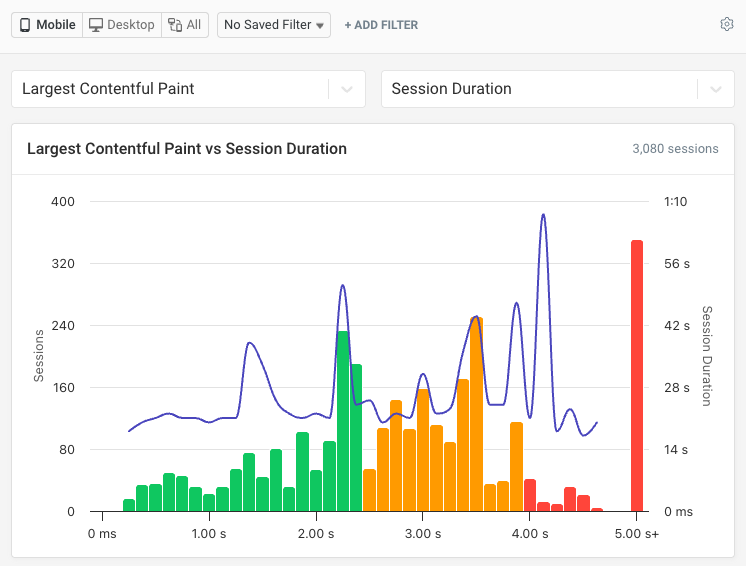
Once real user monitoring is in place it needs to be analyzed. For this it’s useful to both look at individual page views and to use visualizations like timeline charts, histograms, and maps.
Real user page speed metrics
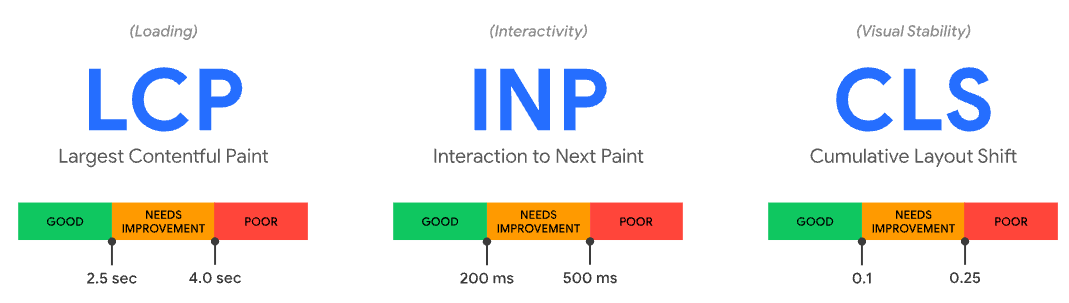
There are many types of performance metrics that can be collected from the page load process on the browser. The Web Vitals initiative by Google has gained a lot of relevance and importance since its introduction in 2020. The three Core Web Vitals metrics are:
- Largest Contentful Paint (LCP)
- Cumulative Layout Shift (CLS)
- Interaction to Next Paint (INP)
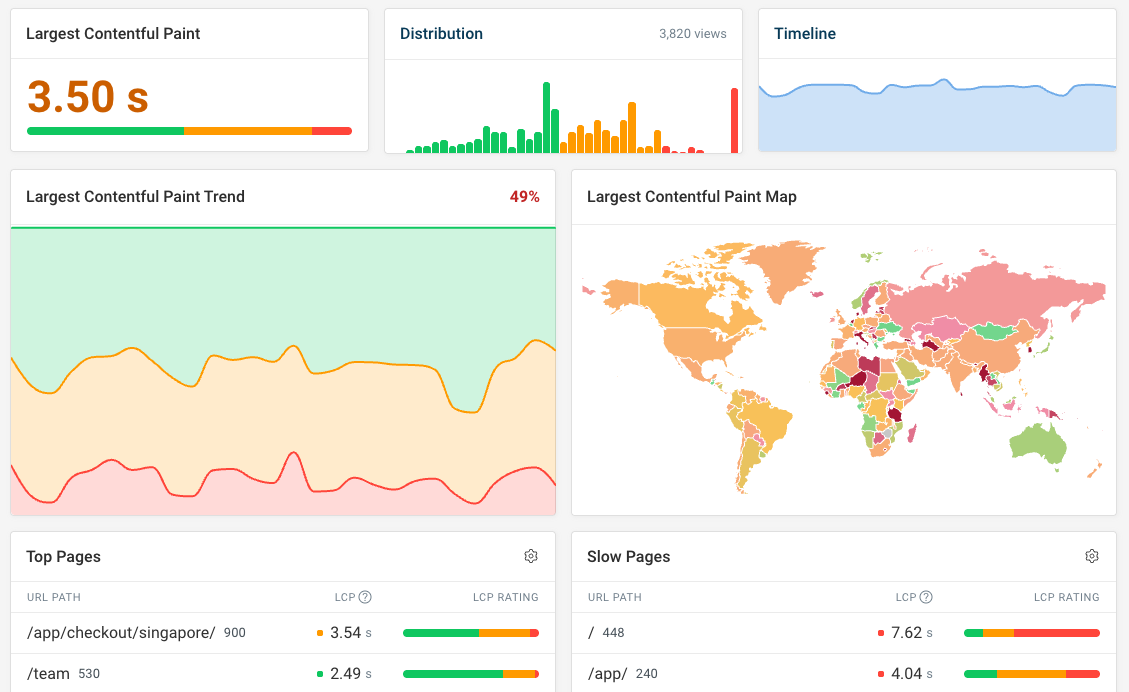
These metrics provide a great high-level view of overall website performance. However, looking at other, more granular metrics is a great way to identify optimizations. For example, when debugging LCP it’s helpful to also look at:
- Time to First Byte (TTFB): server response time
- First Contentful Paint (FCP): how quickly page content becomes visible
These and other metrics can help you identify and prioritize performance issues on your website so that your development team can address them.
Real User Monitoring for Core Web Vitals
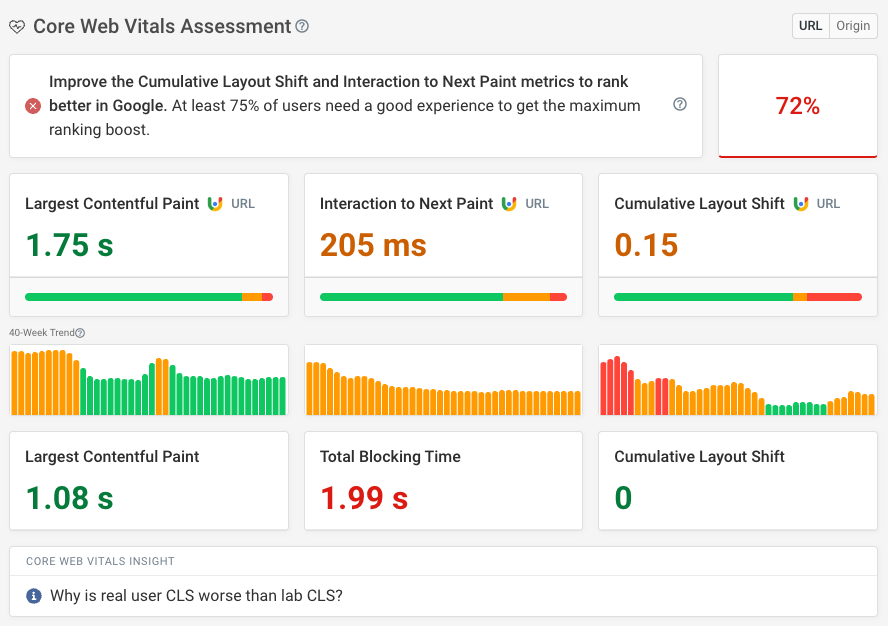
Monitoring real user Core Web Vitals is a great strategy to gain a comprehensive understanding of user experiences on your website and how they can impact Google rankings.
Google’s Chrome User Experience Report provides basic data showing how fast a specific page has been for the last 28 days. You can check a 40-week trend for your website based on Google data with our free Core Web Vitals checker.
However, a dedicated real user monitoring tool like DebugBear will provide you with more detailed real-time performance data. You’ll no longer have to wait 28 days to see if your optimization attempts are working, or look at your Interaction to Next Paint metrics wondering what those slow interactions might have been.
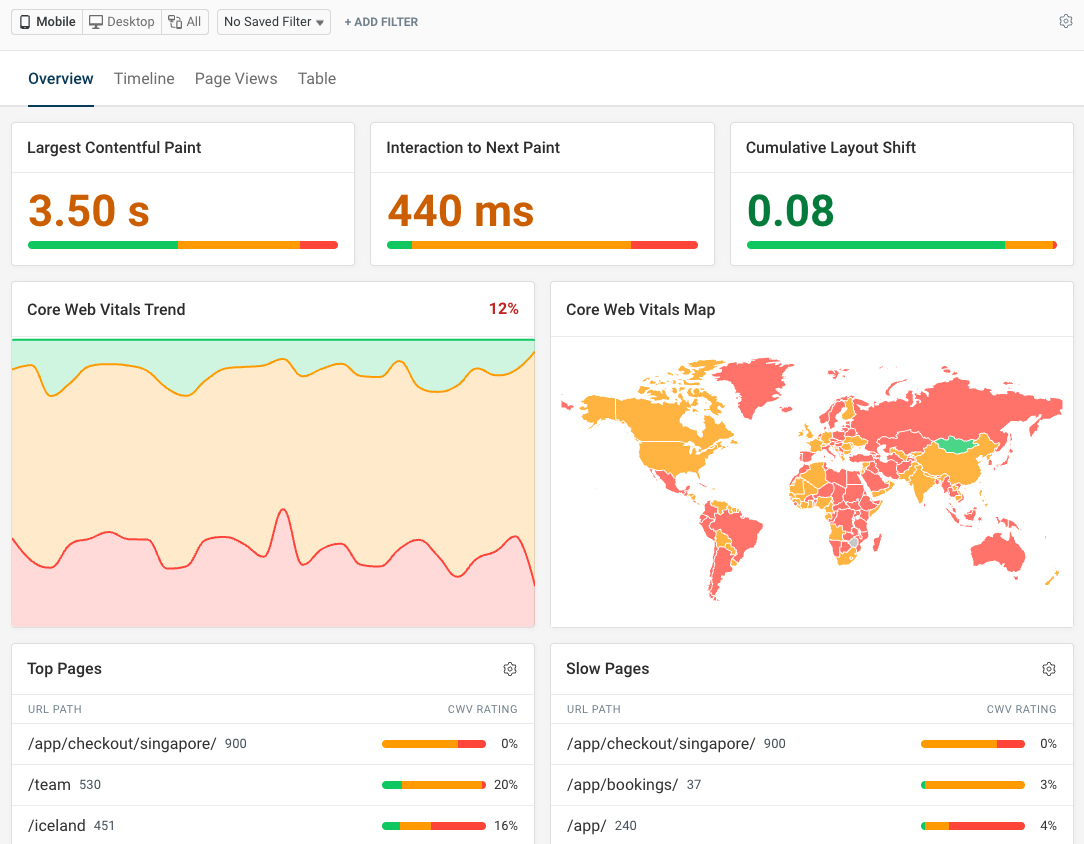
DebugBear makes it easy to see your overall website performance at a glance and identify specific pages that need to be optimized.
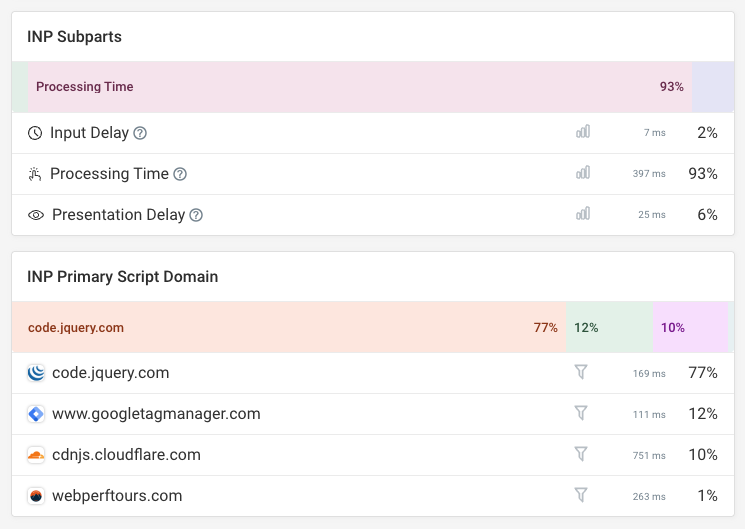
In addition to tracking the Core Web Vitals metrics themselves, RUM tools can also provide insights on what’s slowing down page load times, what page interactions are slow, or what specific scripts are slowing down user interactions.
Sign up for a free DebugBear trial to get detailed visitor experience insights as well as detailed technical reporting to fix Core Web Vitals issues.
RUM vs. Synthetic Monitoring
Lab-based monitoring, also known as "synthetic monitoring", relies on simulating a desktop or mobile environment under certain conditions in order to measure performance metrics in a controlled test environment.
This type of monitoring differs from real user monitoring because real users will access your website using a wide range of device and network types.
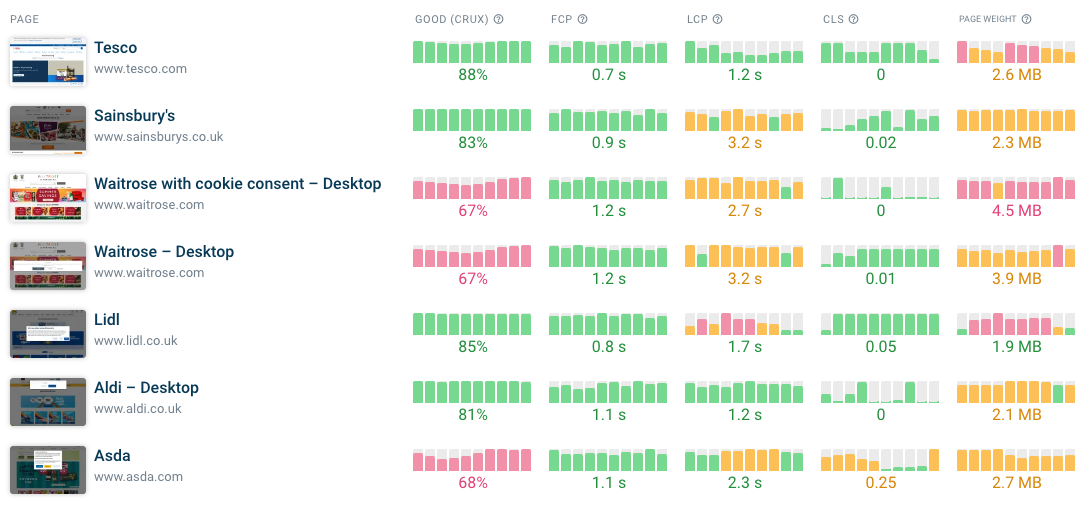
While you can only collect real user data on websites you control, lab data and CrUX metrics can be reported for any website. For example, with synthetic monitoring tools you can create a dashboard showing your website and those of your competitors.
Synthetic monitoring has a number of advantages compared to real user monitoring:
- Lab tests can provide more detailed reporting data such as request timings and screenshots.
- You can control the test conditions precisely
- Tests can be run when needed without having to wait for real user visits
- Lab data can be collected in a staging environment or as part of a continuous integration setup
All of these make regression detection and analysis easier and help you detect page speed problems as early as possible, ideally before they impact your visitors.
However, synthetic monitoring also comes with a set of limitations that can be addressed with real user data:
- Lab conditions may not match real-world conditions
- Synthetic tests require setup to measure user interactions
- Only a small number of device and network scenarios are considered
DebugBear offers monitoring for synthetic data, Google CrUX data, and custom real user monitoring focused on Core Web Vitals optimization.
How to set up Real User Monitoring
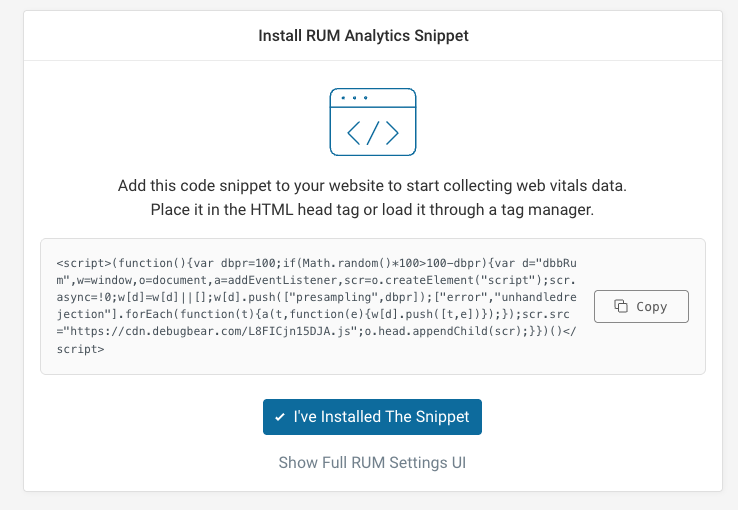
Installing a real user experience monitoring solution like DebugBear is normally done by adding a small snippet of JavaScript code on your website code. This can be added to the head tag or loaded via a tool like Google Tag Manager.
Once the analytics script is installed it will report real user metrics when someone visits your website. RUM tools then help you aggregate and analyze this data to improve your Core Web Vitals.
Does Real User Monitoring affect website performance?
Every RUM tool will add some additional download size and processing time to your website. Ideally this impact should be minimal. While some larger comprehensive monitoring solutions can slow down your website significantly, small tools dedicated to web performance optimization will have a much smaller impact.
RUM tools can load analytics code asynchronously to ensure they don’t slow down the page load speed. Data collection should also happen asynchronously where possible, so that page interactions are not delayed by web vitals data collection.
How much does real user monitoring cost?
Most commonly the cost of real user monitoring tools depends on how many page views or visitor sessions you want to track.
As an example, you can find the pricing for DebugBear here.
Get real user performance analytics for your website
DebugBear provides in-depth web performance data to help you deliver a great visitor experience and pass Google's Core Web Vitals assessment.
You can run scheduled performance tests, collect real user metrics, and measure business impact with conversion tracking.


Monitor Page Speed & Core Web Vitals
DebugBear monitoring includes:
- In-depth Page Speed Reports
- Automated Recommendations
- Real User Analytics Data